Identifying past-year self-reported suicidality in outpatients with somatic symptom disorder using an interpretable machine-learning model: a multicenter study with an online calculator
Xing Wang, Shuixiu Lai, Peng Wang, Yibo Li, Yunhui Zhong, Tieshi Zhu

TL;DR
This study developed a machine-learning model to identify SSD outpatients at risk of recent suicidality, using data from 899 patients and showing strong predictive performance.
Contribution
An interpretable machine-learning model for suicidality risk in SSD outpatients, with a web-based calculator for clinical use.
Findings
The random forest model achieved high accuracy (AUC 0.978) in predicting past-year suicidality in SSD patients.
Insomnia severity was the top predictor, followed by mindfulness and neuropsychological status.
The model showed good calibration and clinical benefit across decision thresholds.
Abstract
Somatic symptom disorder (SSD) is associated with an elevated risk of suicidality. However, clinically implementable tools to identify outpatients with SSD who may warrant prioritized suicidality assessment remain limited. We therefore aimed to develop an interpretable model using routinely available outpatient data to stratify the likelihood of past-year self-reported suicidality. We analyzed a multicenter cross-sectional registry from 3 hospitals in Ganzhou including adults aged 18–60 years with DSM-5–defined SSD. Past-year self-reported suicidality was assessed using a prespecified binary (yes/no) item. Data were split 70/30 into training/test sets. Candidate predictors were selected by the intersection of least absolute shrinkage and selection operator and Boruta. Eight algorithms were trained with repeated 5-fold cross-validation and compared primarily by area under the receiver…
Genes, proteins, chemicals, diseases, species, mutations and cell lines named across the full text — each resolved to its canonical identifier and authoritative record.
Click any figure to enlarge with its caption.
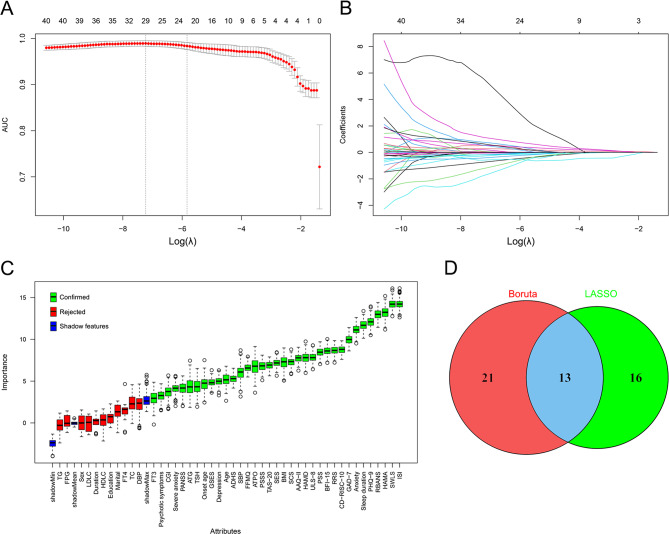 Figure 1
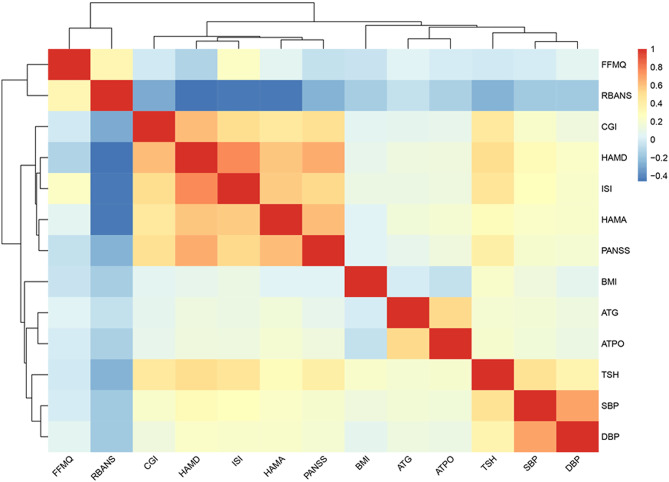 Figure 2
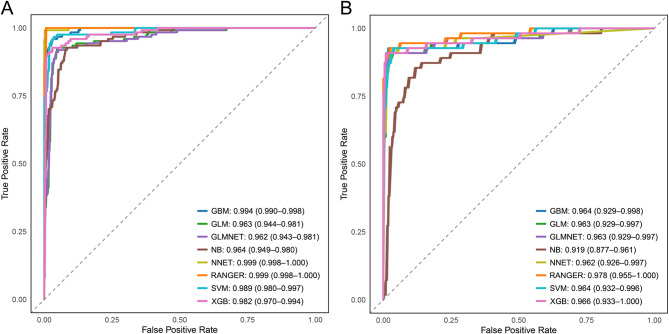 Figure 3
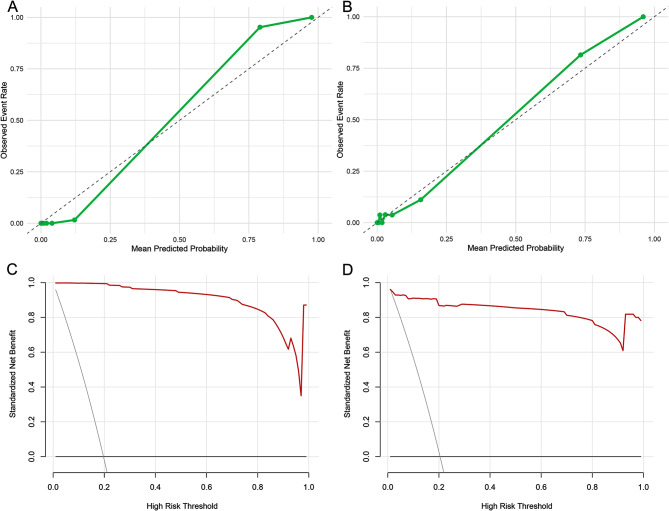 Figure 4
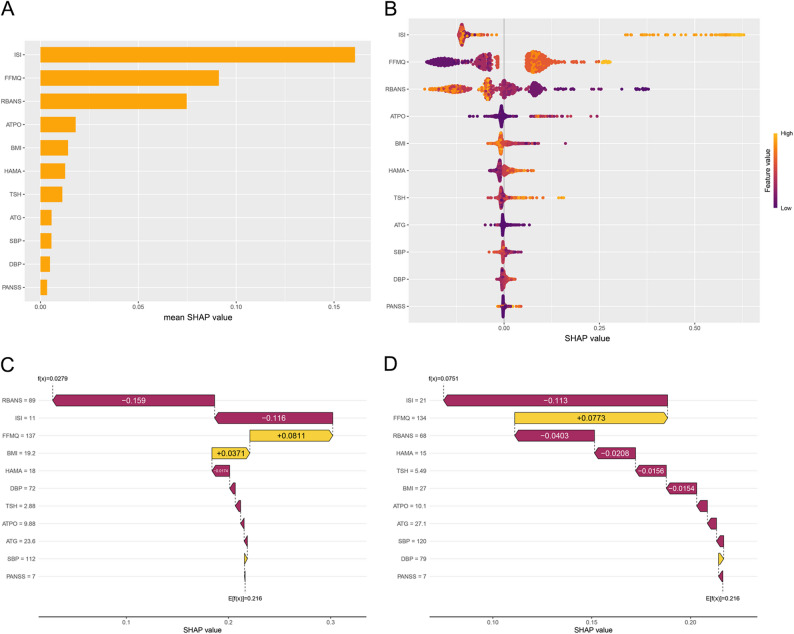 Figure 5
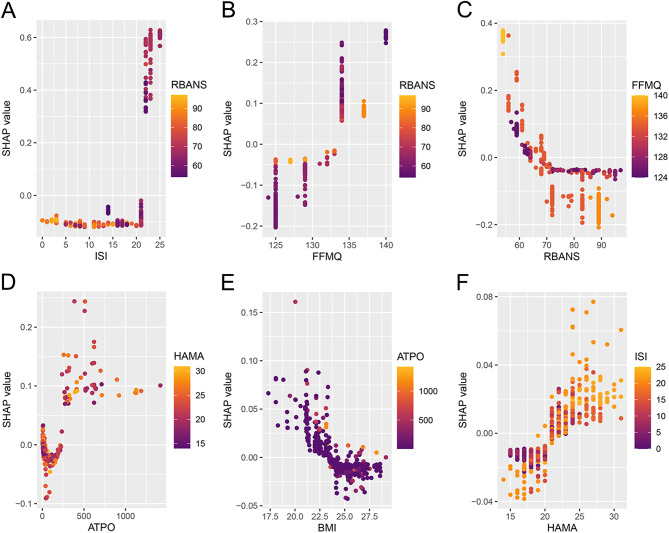 Figure 6
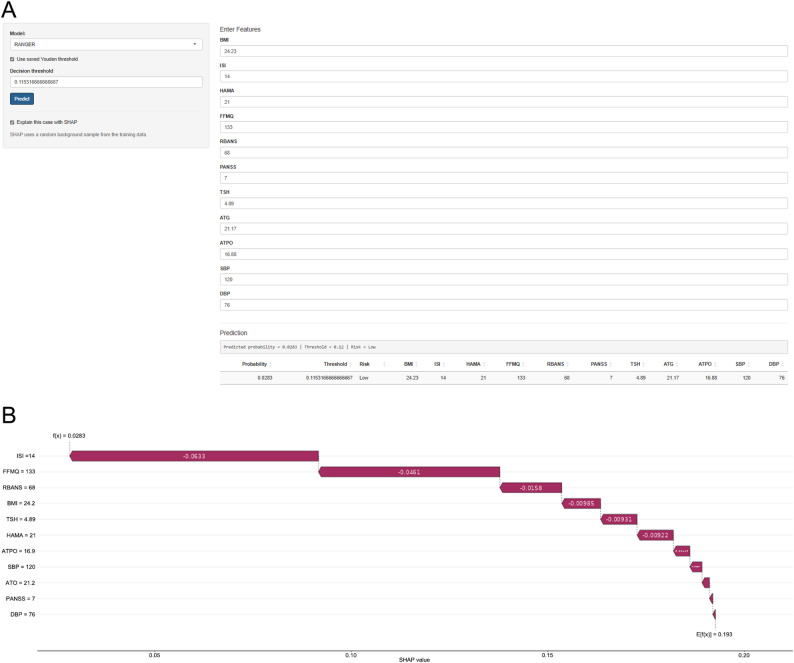 Figure 7
 Figure 8
- —the Guidance Science and Technology Project of Ganzhou
Peer Reviews
No public reviews on file for this paper yet. If you reviewed it on a platform where reviews are public (OpenReview, ICLR, NeurIPS, ICML), you can paste yours below so the community can read it here.
Videos
No videos yet. Explain this paper in a talk, walkthrough, or lecture? Add one.
Taxonomy
TopicsSuicide and Self-Harm Studies · Psychosomatic Disorders and Their Treatments · Treatment of Major Depression
Background
Somatic symptom disorder (SSD) is a common and functionally impairing condition characterized by persistent, distressing somatic symptoms accompanied by disproportionate health-related thoughts, feelings, or behaviors, irrespective of whether a medical explanation is identified [1–3]. Individuals with SSD experience substantial symptom-related distress and disability and often receive care across multiple clinical services, contributing to high health care utilization and costs [4–6]. SSD is also associated with increased risk of suicidal ideation, suicide attempts, and death by suicide [7, 8].
Given the substantial morbidity and mortality associated with suicidal behavior, timely identification of individuals at high risk is essential [9, 10]. In SSD, clinical attention often centers on bodily complaints, and patients frequently present to nonpsychiatric services [11, 12]. As a result, potential suicide risk may be obscured by complex somatic symptoms and overlooked in routine care [13, 14]. Prior studies have identified some associated factors—such as greater somatic symptom burden and poor sleep quality—but these individual risk factors have limited predictive value for suicidal behaviors [15, 16]. Therefore, a standardized, objective, and clinically implementable tool is needed to integrate multidomain information to assist clinicians in identifying high-risk individuals within SSD care pathways.
In recent years, machine learning (ML) has shown substantial promise for predicting mental health risk, owing to its capacity for pattern recognition and high-dimensional data processing [17, 18]. Compared with traditional statistical approaches, ML algorithms excel in learning nonlinear and interaction effects from complex clinical data, thereby improving risk stratification [19, 20]. ML has been applied to suicide-risk models in populations with depression and schizophrenia [21, 22], among others [23, 24]; however, evidence specific to outpatients with SSD—a distinct, high-risk group—remains limited [25]. This gap is likely driven by the clinical pathway of SSD: patients often present with predominant somatic complaints in outpatient medical settings, and care frequently prioritizes medical workups to exclude organic disease, contributing to high healthcare utilization [26–28]. Suicide-risk assessment may therefore be less systematic and receives limited attention in some existing management guidance for somatic symptom and related disorders [14]. In addition, SSD is clinically heterogeneous and frequently comorbid with affective and anxiety symptoms, and the lack of standardized, consistently documented outcomes can hinder model development and external validation [2, 3, 29]. Moreover, many ML models have limited interpretability and face barriers to clinical implementation, even when supplemented with Shapley additive explanations (SHAP). Web-based calculators built with Shiny may facilitate bedside use and dissemination [30, 31]. Therefore, predicting suicide risk is a critical clinical priority in patients with SSD. Accordingly, using outpatient data from three hospitals in Ganzhou, we developed interpretable machine-learning models to stratify the likelihood of past-year self-reported suicidality at the index visit. This retrospective stratification is intended as a pragmatic screening/triage approach to help identify patients who may warrant prioritized and structured suicide risk assessment. We also implemented a web-based Shiny calculator to facilitate clinical use.
Methods
Participants
This cross-sectional registry enrolled participants at the First Affiliated Hospital of Gannan Medical University, the Third People’s Hospital of Ganzhou, and Ganzhou People’s Hospital (Jiangxi, China) from January 2023 through April 2024. Eligible participants were Han Chinese adults aged 18 to 60 years with DSM-5 SSD and capacity to consent. Diagnoses were verified by a senior psychiatrist, with disagreements resolved during weekly case conferences. The present report addresses a research question distinct from prior analyses of this registry. Of 1068 individuals screened, 997 met inclusion criteria; 98 were excluded (pregnancy/lactation, n = 23; substance use disorder, n = 25; severe personality disorder, n = 13; serious physical illness, n = 12; declined participation, n = 20; other, n = 5), yielding a final analytic cohort of 899.
Ethical approval
The protocol was approved by the institutional review board of the Third People’s Hospital of Ganzhou (IRB: Ethics Committee of the Institute of Third People’s Hospital of Ganzhou, Ethical code: gzsyy2024044). Written informed consent was obtained from all participants, and confidentiality was maintained. All procedures adhered to the principles of the Declaration of Helsinki.
Outcome
The primary outcome was past-year self-reported suicidality, assessed at the index outpatient visit using a single binary (yes/no) item on the intake form. Because the item did not separately assess suicidal ideation, plans, and attempts, we were not able to differentiate these phenotypes. Nonsuicidal self-injury (NSSI) and unintentional self-harm were not assessed and were not included in the outcome definition. Responses were recorded as binary values (yes/no); No ambiguous responses were recorded.
Covariates
This study is a secondary analysis of a previously established multicenter outpatient SSD dataset with comprehensive baseline psychometric and laboratory assessments [32]. The available measures were treated as candidate predictors to develop an interpretable machine-learning model for stratifying the likelihood of past-year self-reported suicidality. Covariates were derived from the standardized baseline assessment and included self-report measures, clinician- and self-rated psychological scales, routinely collected laboratory indices, and vital signs. Laboratory variables were included pragmatically because they were already available in this secondary dataset and are readily obtainable in routine outpatient practice. In addition, prior studies have suggested that thyroid dysfunction may be associated with NSSI and suicide attempts among patients with major depressive disorder [33, 34], and lipid abnormalities are closely related to thyroid dysfunction [35]. Therefore, as thyroid function and lipid profiles were collected in the original dataset, we included them as candidate predictors to explore whether they could provide incremental information beyond questionnaire-based measures.
Demographic variables were age (years), sex (female/male), body mass index (BMI) (kg/m²), educational attainment (≥ college vs. < college), and marital status (married vs. other). Clinical characteristics included illness duration (months) and age at onset (years). Psychiatric clinical status comprised depression, anxiety, severe anxiety, and psychotic symptoms (all yes/no). The following scales were entered as continuous raw scores: Hamilton Depression Rating Scale (HAMD) [36], Hamilton Anxiety Rating Scale (HAMA) [37], Patient Health Questionnaire–9 (PHQ-9) [38], Generalized Anxiety Disorder–7 (GAD-7) [39, 40], Insomnia Severity Index (ISI) [41], Rosenberg Self-Esteem Scale (SES) [42], UCLA Loneliness Scale–8 item (ULS-8) [43], Adult Dispositional Hope Scale (ADHS) [44], General Self-Efficacy Scale (GSES) [45], Perceived Stress Scale (PSS) [46], 10-Item Connor–Davidson Resilience Scale (CD-RISC-10) [47], Toronto Alexithymia Scale–20 (TAS-20) [48], Ruminative Responses Scale (RRS) [49], Five Facet Mindfulness Questionnaire (FFMQ) [50], Satisfaction With Life Scale (SWLS) [51], Self-Compassion Scale (SCS) [52], Acceptance and Action Questionnaire–II (AAQ-II) [53], Perceived Social Support Scale (PSSS) [54, 55], Repeatable Battery for the Assessment of Neuropsychological Status (RBANS) [56], Positive and Negative Syndrome Scale (PANSS) [57], and Clinical Global Impression (CGI) [58]. Laboratory covariates included thyroid-stimulating hormone (TSH), free triiodothyronine (FT3), free thyroxine (FT4), anti-thyroglobulin antibody (ATG), anti-thyroid peroxidase antibody (ATPO), fasting plasma glucose (FPG), and lipid profile—total cholesterol (TC), high-density lipoprotein cholesterol (HDL-C), low-density lipoprotein cholesterol (LDL-C), and triglycerides (TG). Vital signs included systolic and diastolic blood pressure (SBP, DBP).
Statistical analysis and modeling
Data were randomly split into a training set (70%) and a test set (30%). Baseline characteristics were summarized as medians (IQRs) for continuous variables and No. (%) for categorical variables. Distributional assumptions were examined prior to hypothesis testing. Between-group comparisons used the Mann–Whitney U test for continuous variables and the χ² test for categorical variables.
Candidate predictors were screened in the training set using 2 complementary methods—least absolute shrinkage and selection operator (LASSO) regression and the Boruta algorithm. Variables retained for model development were the intersection of features selected by both procedures. Eight algorithms were then trained in the caret framework with 5-fold cross-validation repeated twice: gradient boosting machine (GBM), generalized linear model (GLM), elastic net–regularized logistic regression (GLMNET), random forest (RANGER implementation), support vector machine with radial basis function kernel (SVM), extreme gradient boosting (XGB), naïve Bayes (NB), and a single–hidden-layer neural network (NNET). Model performance was evaluated using the area under the receiver operating characteristic curve (AUC), area under the precision–recall curve (AUPRC), Brier score, accuracy, sensitivity, specificity, positive predictive value (PPV), negative predictive value (NPV), and F1 score. Primary selection metrics were AUC and Brier score. For the top-performing model, we generated calibration plots and conducted decision-curve analysis.
To enhance interpretability, we applied SHAP to the selected model to estimate global feature importance, display summary (beeswarm) plots, produce dependence plots for the 6 highest-contributing features, and create case-level waterfall plots. Finally, we implemented a Shiny-based web calculator to provide individualized risk estimates for past-year self-reported suicidality.
Interaction assessment
To evaluate whether clinically plausible effect modification materially influenced risk estimation or calibration, we prespecified and tested several interaction terms within a GLM framework. Specifically, we examined the interactions PHQ-9×ISI, PHQ-9×GAD-7, PHQ-9×psychotic symptoms, Sex×PHQ-9, and ULS-8×PSSS. Model fit was compared between the main-effects model and the interaction model using a likelihood ratio test. Discrimination and calibration were evaluated with and without interaction terms by comparing AUROC, Brier score, and calibration parameters (calibration intercept and slope).
Sensitivity analysis
To assess the robustness of model performance to the choice of data partition, we conducted a sensitivity analysis using 10 repeated random train–test splits with different random seeds. For each split, the full modeling pipeline was repeated and model discrimination was evaluated on the held-out test set by reporting the AUROC and AUPRC for each algorithm. Consistency of AUROC/AUPRC across splits was used to judge the stability of model performance. In addition, to clarify the main drivers of discrimination, we performed ablation analyses using two reduced predictor sets derived from the selected predictors. Specifically, we re-trained and evaluated models using (i) a questionnaire-only set (FFMQ, RBANS, ISI, HAMA, PANSS) and (ii) a laboratory/vital-sign–only set (TSH, ATPO, ATG, BMI, SBP, DBP). These reduced-set analyses were repeated across the same 10 splits, and test-set AUROC and AUPRC were reported to compare performance stability and to assess the relative contribution of psychometric versus laboratory/vital-sign information.
Results
Characteristics of the study population
As shown in Table 1, among 899 participants (median age, 33 years [IQR, 24–45]; 64.4% female), median illness duration was 11 months (IQR, 9–14) and age at onset was 32 years (IQR, 23–45). Educational attainment was ≥college in 33.6%, and 67.6% were married. Suicidal attempt was present in 19.9%. Depressive and anxiety symptoms were common (47.2% and 77.5%, respectively); severe anxiety occurred in 12.4% and psychotic symptoms in 10.2%.
Table 1. Baseline characteristics of the train and test setsAlln = 899Testn = 269Trainn = 630 P Age (year)33.00 (24.00,45.00)34.00 (24.00,47.00)32.00 (24.00,44.00)0.161Duration (month)11.00 (9.00,14.00)11.00 (9.00,14.00)11.00 (9.00,14.00)0.351Onset age (year)32.00 (23.00,45.00)34.00 (24.00,47.00)32.00 (23.00,44.00)0.146Female579 (64.40%)178 (66.17%)401 (63.65%)0.518BMI (kg/m^2^)24.21 (23.15,25.60)24.18 (23.21,25.60)24.22 (23.15,25.60)0.934Education0.659 ≥college302 (33.59%)87 (32.34%)215 (34.13%) < college597 (66.41%)182 (67.66%)415 (65.87%)Marital0.578 married608 (67.63%)186 (69.14%)422 (66.98%) other291 (32.37%)83 (30.86%)208 (33.02%)Suicidal behavior0.991 no720 (80.09%)216 (80.30%)504 (80.00%) yes179 (19.91%)53 (19.70%)126 (20.00%)Severe anxiety0.776 no788 (87.65%)234 (86.99%)554 (87.94%) yes111 (12.35%)35 (13.01%)76 (12.06%)Psychotic symptoms0.475 no807 (89.77%)238 (88.48%)569 (90.32%) yes92 (10.23%)31 (11.52%)61 (9.68%)Depression0.957 no475 (52.84%)143 (53.16%)332 (52.70%) yes424 (47.16%)126 (46.84%)298 (47.30%)Anxiety0.291 no202 (22.47%)67 (24.91%)135 (21.43%) yes697 (77.53%)202 (75.09%)495 (78.57%)HAMD23.00 (21.00,25.00)23.00 (21.00,25.00)23.00 (21.00,25.00)0.842HAMA21.00 (18.00,23.00)20.00 (17.00,23.00)21.00 (18.00,23.00)0.511PHQ-911.00 (5.00,18.00)11.00 (5.00,18.00)11.00 (5.00,18.00)0.538GAD-710.00 (10.00,15.00)10.00 (8.00,17.00)10.00 (10.00,15.00)0.951ISI14.00 (8.00,21.00)14.00 (8.00,21.00)14.00 (8.00,21.00)0.716Sleep duration (hour)5.50 (4.50,6.50)5.50 (4.50,6.50)5.50 (4.50,6.50)0.576SES20.00 (10.00,30.00)20.00 (10.00,30.00)20.00 (10.00,30.00)0.845ULS-824.00 (17.00,29.00)24.00 (17.00,29.00)24.00 (17.00,29.00)0.960ADHS19.00 (17.00,24.00)19.00 (17.00,25.00)19.00 (17.00,24.00)0.929GSES13.00 (11.00,22.00)13.00 (11.00,24.00)13.00 (11.00,21.00)0.562PSS30.00 (22.00,34.00)30.00 (20.00,34.00)30.00 (22.00,34.00)0.922CD-RISC-1013.00 (7.00,20.00)13.00 (7.00,20.00)13.00 (7.00,20.00)0.769TAS-2079.00 (66.00,83.00)79.00 (66.00,83.00)79.00 (66.00,83.00)0.853RRS69.00 (48.00,88.00)69.00 (42.00,88.00)69.00 (48.00,88.00)0.862FFMQ133.00 (127.00,134.00)133.00 (127.00,134.00)133.00 (127.00,134.00)0.452SWLS12.00 (7.00,15.00)12.00 (7.00,17.00)12.00 (7.00,15.00)0.635SCS27.00 (19.00,36.00)27.00 (19.00,39.00)25.00 (19.00,36.00)0.766AAQ-II37.00 (31.00,39.00)37.00 (26.00,40.00)37.00 (31.00,39.00)0.779PSSS36.00 (20.00,58.00)36.00 (20.00,58.00)36.00 (20.00,58.00)0.886RBANS68.00 (62.00,83.00)69.00 (64.00,83.00)68.00 (62.00,83.00)0.224PANSS7.00 (7.00,7.00)7.00 (7.00,8.00)7.00 (7.00,7.00)0.581CGI6.00 (5.00,7.00)6.00 (5.00,7.00)6.00 (5.00,7.00)0.503TSH (mIU/L)4.88 (3.03,6.62)4.81 (2.89,6.59)4.91 (3.12,6.68)0.743ATG (IU/mL)21.27 (14.42,42.64)20.86 (13.85,29.39)21.30 (14.58,52.45)0.091ATPO (IU/mL)17.19 (12.25,33.56)16.97 (12.23,29.21)17.37 (12.27,35.20)0.392FT3 (pmol/L)4.90 (4.38,5.40)4.86 (4.41,5.32)4.94 (4.36,5.41)0.502FT4 (pmol/L)16.58 (14.38,18.80)16.75 (14.76,18.87)16.41 (14.30,18.70)0.103FPG (mmol/L)5.31 (4.90,5.77)5.31 (4.92,5.81)5.31 (4.90,5.76)0.346TC (mmol/L)5.14 (4.42,5.92)5.12 (4.40,5.87)5.18 (4.43,5.96)0.700HDLC (mmol/L)1.23 (1.01,1.42)1.25 (1.01,1.46)1.22 (1.01,1.41)0.307TG (mmol/L)1.96 (1.37,2.78)2.03 (1.41,2.80)1.90 (1.36,2.76)0.330LDLC (mmol/L)2.90 (2.30,3.50)2.85 (2.30,3.50)2.90 (2.31,3.42)0.950SBP (mmHg)120.00 (112.00,127.00)120.00 (112.00,128.00)120.00 (112.00,126.00)0.390DBP (mmHg)76.00 (70.50,80.00)76.00 (70.00,80.00)76.00 (71.00,80.00)0.841Data are presented as median (Q1, Q3) or n (%). Q1, 1st Quartile; Q3, 3rd Quartile; BMI, body mass index; HAMD, Hamilton Depression Scale; HAMA, Hamilton Anxiety Scale; PHQ-9, Patient Health Questionnaire-9 items; GAD-7, Generalized Anxiety Disorder-7; ISI, Insomnia Severity Index; SES, Rosenberg Self-Esteem Scale; ULS-8, UCLA Loneliness Scale; ADHS, Adult Dispositional Hope Scale; GSES, General Self-Efficacy Scale; PSS, Perceived Stress Scales; CD-RISC-10, 10-Item Connor-Davidson Resilience Scale; TAS-20, Toronto Alexithymia Scale-20; RRS, Ruminative Responses Scale; FFMQ, The Five Facet Mindfulness Questionnaire; SWLS, Satisfaction with Life Scale; SCS, Self-Compassion Scale; AAQ-II, Acceptance and Action Questionnaire-II; PSSS, Perceived Social Support Scale; RBANS, The repeatable battery for the assessment of neuropsychological status; PANSS, Positive and Negative Syndrome; CGI, Clinical Global Impression; TSH, Thyroid-Stimulating Hormone; ATG, Anti-Thyroglobulin Antibody; ATPO, Anti-Thyroid Peroxidase Antibody; FT3, Free Triiodothyronine; FT4, Free Thyroxine; FPG, Fasting Plasma Glucose; TC, Total Cholesterol; HDLC, High-Density Lipoprotein Cholesterol; TG, Triglycerides; LDLC, Low-Density Lipoprotein Cholesterol; SBP, Systolic Blood Pressure; DBP, Diastolic Blood Pressure
Participants were randomly allocated to the training (n = 630) and test (n = 269) sets. Baseline demographic, clinical, psychometric, laboratory, and vital-sign characteristics were well balanced between the two sets, and no statistically significant differences were observed across variables (all P > 0.05) (Table 1).
Variable selection
Using LASSO and Boruta, we identified 29 and 34 candidate variables associated with past-year self-reported suicidality, respectively; their intersection yielded 13 variables (Fig. 1A–D). ISI and HAMD were highly correlated (r > 0.70), indicating collinearity (Fig. 2). Because HAMD contains suicide-related content that may overlap with the outcome, we excluded HAMD to reduce potential circularity. In addition, CGI represents clinician-rated global illness severity and may partially reflect clinicians’ awareness of suicidality; therefore, CGI was removed to mitigate potential information leakage. Accordingly, 11 variables were retained for model development: FFMQ, RBANS, ISI, HAMA, PANSS, BMI, ATG, ATPO, TSH, SBP, and DBP.
Fig. 1. Variable selection using LASSO and Boruta. A, Cross-validated performance of LASSO. B, LASSO coefficient paths across the penalty grid. C, Boruta feature importance. D, Overlap of predictors retained by Boruta and LASSO. Abbreviations: AUC, area under the curve; LASSO, least absolute shrinkage and selection operator; λ, lambda; other abbreviations are defined in methods
Fig. 2. Correlation heatmap of candidate predictors. Heatmap shows pairwise Spearman correlation coefficients among candidate predictors; colors indicate direction and magnitude (blue, negative; red, positive). Dendrograms display hierarchical clustering of variables. Abbreviations are defined in Methods
Model development and performance
ROC curves showed high discrimination across models (Fig. 3A–B). In the test set, RANGER achieved the highest AUROC (0.978; 95% CI, 0.955–1.000), followed by XGB (0.966; 95% CI, 0.933–1.000), GBM (0.964; 95% CI, 0.929–0.998) and SVM (0.964; 95% CI, 0.932–0.996), with GLM/GLMNET both showing AUROC of 0.963 (95% CI, 0.929–0.997), and NNET AUROC of 0.962 (95% CI, 0.926–0.997); NB showed comparatively lower AUROC (0.919; 95% CI, 0.877–0.961). Training-set AUROCs were generally higher, particularly for RANGER and NNET (Fig. 3A). Consistent with AUROC results, the performance metrics in the test set indicated that RANGER had the highest AUPRC (0.960) and the lowest Brier score (0.028), with high overall accuracy (0.967) and balanced sensitivity (0.927) and specificity (0.977) (Table 2). Calibration plots indicated good agreement between predicted and observed risk, and decision-curve analysis suggested net benefit across a broad range of clinically relevant threshold probabilities compared with treat-all and treat-none strategies (Fig. 4A–D). Two prespecified interactions (PHQ-9×ISI and PHQ-9×psychotic symptoms) were statistically significant, whereas including interaction terms resulted in only minor improvement in discrimination and no meaningful change in calibration (Table S1, S2). Sensitivity analyses using 10 different random seeds for repeated train–test splits showed stable model performance: test-set AUROC (and AUPRC) estimates were highly consistent across splits, indicating that the results were robust to the choice of random partition (Table S3). In additional ablation analyses, models restricted to the questionnaire-only predictor set retained strong discrimination across the 10 repeated splits (test-set AUROC consistently > 0.90 with generally high AUPRC) (Table S4). In contrast, models using laboratory and vital-sign variables only showed weaker but still moderate discrimination (test-set AUROC ~ 0.66–0.80 with modest AUPRC) (Table S5).
Fig. 3. Receiver operating characteristic (ROC) curves for model discrimination in Train and Test sets. A, Train set. B, Test set. AUC (95% CI) for each algorithm is shown in the in-figure legend. Abbreviations: AUC, area under the ROC curve; GBM, gradient boosting machine; GLM, generalized linear model; GLMNET, elastic-net regularized logistic regression; NB, naïve Bayes; NNET, single–hidden-layer neural network; RANGER, random forest; SVM, support vector machine (radial basis); XGB, extreme gradient boosting
Table 2. Performance metrics of machine learning models in the train and test setsModelSplitAUPRCBrierThresholdAccuracySensitivitySpecificityPPVNPVF1GBMTrain0.9780.0230.2330.9700.9520.9740.9010.9880.925Test0.9450.0340.2330.9700.9270.9810.9270.9810.927GLMTrain0.8810.0490.3670.9460.9030.9570.8360.9760.868Test0.9320.0390.3670.9550.9090.9670.8770.9760.893GLMNETTrain0.8800.0500.4120.9460.8950.9580.8410.9740.867Test0.9360.0400.4120.9630.9090.9770.9090.9770.909RANGERTrain0.9970.0110.2690.9941.0000.9920.9691.0000.984Test0.9600.0280.2690.9670.9270.9770.9110.9810.919SVMTrain0.9700.0250.3170.9670.9520.9700.8870.9880.918Test0.9370.0370.3170.9550.9270.9630.8640.9810.895XGBTrain0.9420.0300.3440.9670.9110.9800.9190.9780.915Test0.9480.0330.3440.9740.9090.9910.9620.9770.935NBTrain0.8900.0590.0450.8940.9270.8850.6650.9800.774Test0.7090.0880.0450.8770.8550.8830.6530.9590.740NNETTrain0.9980.0030.1820.9970.9920.9980.9920.9980.992Test0.9340.0400.1820.9590.9090.9720.8930.9770.901AUPRC, area under the precision–recall curve; PPV, positive predictive value; NPV, negative predictive value; GBM, gradient boosting machine; GLM, generalized linear model (logistic regression); GLMNET, generalized linear model with elastic-net regularization; RANGER, random forest (ranger implementation); SVM, support vector machine; XGB, extreme gradient boosting; NB, naive Bayes; NNET, feed-forward neural network
Fig. 4. Calibration and Decision-curve analysis for the RANGER model in Train and Test sets. A–B, Calibration. Observed event rates vs. mean predicted probabilities for RANGER; dashed line indicates perfect calibration. A, Training set. B, Test set. C–D, Decision-curve analysis. Standardized net benefit across threshold probabilities; red curve, RANGER; dark gray, treat-all; black, treat-none. C, Training set. D, Test set. RANGER, random forest
Model explanation
In the RANGER model, SHAP feature-importance rankings identified ISI as the most influential predictor, followed by FFMQ and RBANS, with smaller contributions from ATPO, BMI, and HAMA (Fig. 5A). The SHAP beeswarm plot suggested clear directionality: higher ISI and HAMA were associated with increased predicted risk of past-year self-reported suicidality, whereas higher RBANS was associated with decreased risk; higher FFMQ values generally corresponded to higher predicted risk (Fig. 5B). Individual-level waterfall plots illustrated how combinations of these features shifted predictions from the baseline risk (Fig. 5C–D). Dependence plots further indicated a threshold-like increase in SHAP values at higher ISI scores (approximately in the low-to-mid 20s) and a similar threshold pattern for FFMQ, an approximately monotonic inverse association for RBANS, and a positive association for HAMA (Fig. 6A–C and F). ATPO and BMI exhibited nonlinear relationships with predicted risk (Fig. 6D–E). Color gradients suggested modest interactions, for example, the contribution of ISI/FFMQ appeared more pronounced when RBANS was lower, and the contribution of HAMA tended to be larger when ISI was higher (Fig. 6A–B and F).
Fig. 5SHAP Explanations for the RANGER Model. A, Global feature importance ranked by mean absolute SHAP value. B, Beeswarm plot showing feature-wise SHAP values and directionality. C, Case-level waterfall plot for a high-risk prediction. D, Case-level waterfall plot for a low-risk prediction. Abbreviations: SHAP, Shapley additive explanations; RANGER, random forest. Other variable abbreviations are defined in Methods
Fig. 6SHAP Dependence Plots for the RANGER Model. Panels show feature-wise SHAP dependence with color indicating interacting feature values. A, ISI (color = RBANS). B, FFMQ (color = RBANS). C, RBANS (color = FFMQ). D, ATPO (color = HAMA). E, BMI (color = ATPO). F, HAMA (color = ISI). Abbreviations: SHAP, Shapley additive explanations; RANGER, random forest. Other variable abbreviations are defined in Methods
Web-based risk calculator
We deployed all eight algorithms as a Shiny-based web calculator (available at https://zts1994neurology.shinyapps.io/SSD-suicide-risk1/). Users can select any of the eight models, enter values for the 11 predictors used in model development, and obtain the predicted probability of past-year self-reported suicidality (Fig. 7A). When the SHAP explanation option is enabled, the tool also returns an individualized waterfall plot showing the direction and magnitude of each predictor’s contribution (Fig. 7B). The calculator is provided for research/educational use pending external validation.
Fig. 7. Web-Based Risk Calculator for Outpatients With Somatic Symptom Disorder. Screenshots of the Shiny-deployed calculator. A, Interface without SHAP enabled: users select the model (e.g., RANGER), enter values for the 11 predictors, and obtain the predicted probability and risk category. B, Interface with SHAP enabled: an individualized waterfall plot displays the direction and magnitude of each predictor’s contribution to the prediction. Abbreviations: SHAP, Shapley additive explanations; RANGER, random forest. Other variable abbreviations are defined in Methods
Discussion
In this multicenter registry of adults with SSD, we developed interpretable machine-learning models to classify participants who reported a past-year self-reported suicidality. The RANGER model showed the best overall internal performance with good calibration. SHAP analyses indicated that ISI was the most influential contributor, followed by FFMQ and RBANS. These findings extend prior work by showing that a multidomain, interpretable approach can support screening and stratification for past-year self-reported suicidality within SSD care pathways, a context in which suicide-risk assessment may be overlooked because patients present with prominent somatic complaints. The accompanying web-based calculator illustrates potential clinical utility, although external validation and prospective evaluation are needed before routine implementation.
Prior predictive models of suicidal behavior have rarely targeted outpatients with SSD, although numerous studies have examined other psychiatric populations. Deep-learning analyses of structural magnetic resonance imaging in major depressive disorder (MDD) have been used to identify suicide risk, and multimodal studies have related brain functional and structural metrics to nonsuicidal self-injury in MDD [59, 60]. Other work has leveraged blood methylome and transcriptome data to predict risks of MDD and suicidal behavior [61]. These approaches advance understanding but are difficult to operationalize in routine care because such data are not typically available in outpatient settings. In contrast, Saeed et al. used readily obtainable information—standardized symptom scales and thyroid function tests—to build a suicide-risk model for bipolar disorder, highlighting depressive symptoms and thyroid function as key correlates; however, usability remained limited [62]. In the present study, we implemented a Shiny-based web calculator that can be accessed on a mobile device and relies on inputs commonly available during outpatient visits (questionnaire scores, basic laboratory tests, and vital signs). The models demonstrated good performance, with test-set AUCs exceeding 0.95 across algorithms, alongside favorable results on secondary metrics.
Consistent with prior work, ISI and HAMA showed positive contributions to suicide risk, reinforcing sleep disturbance and anxiety as clinically actionable correlates in outpatient settings [63–65]. Higher cognitive performance (RBANS) was inversely associated with risk, aligning with reports that cognitive dysfunction is linked to suicidal behaviors in mood and psychotic disorders [66, 67]. The positive contribution of FFMQ was unexpected; possible explanations include construct overlap with ruminative attention in highly somatically focused patients, differential functioning of specific FFMQ subscales, or residual confounding. ATPO exhibited a small, nonlinear association, compatible with mixed evidence that subclinical thyroid dysfunction may relate to mood dysregulation and suicidality [68, 69]. BMI showed a modest, nonlinear pattern, echoing literature that extremes of weight can co-occur with sleep disturbance, anxiety, and somatic symptom burden [70]. Overall, these patterns corroborate established risk domains (sleep, anxiety, cognition) while highlighting potentially context-specific signals (mindfulness facets, thyroid autoantibodies) in SSD. Taken together, the feature profile suggests readily assessable targets for risk triage in SSD pathways where suicidality may be overlooked. Sleep and anxiety metrics (ISI, HAMA) can be integrated into routine screening, whereas lower cognitive scores (RBANS) may flag individuals who need closer monitoring and safety planning. Signals in FFMQ and ATPO warrant cautious interpretation and replication; they may capture somatic hypervigilance or immune-endocrine vulnerability in a subset of patients. Because SHAP quantifies associations within a predictive framework rather than causal effects, these findings should guide hypothesis generation and pragmatic care (e.g., addressing insomnia and anxiety), while prospective studies evaluate whether modifying these domains reduces risk.
To better understand the unusually high discrimination and to clarify which data domains mainly drive performance, we conducted prespecified ablation analyses across the same 10 repeated train–test splits. Models restricted to a questionnaire-only subset (FFMQ, RBANS, ISI, HAMA, PANSS) consistently retained strong test-set discrimination (AUROC generally > 0.90 with high AUPRC), indicating that proximal symptom burden and cognitive/affective profiles captured most of the predictive signal in this cross-sectional setting. In contrast, models using laboratory and vital-sign variables only (TSH, ATPO, ATG, BMI, SBP, DBP) yielded weaker but still moderate discrimination (test-set AUROC approximately 0.66–0.80 with modest AUPRC), suggesting that routinely collected physiological measures carry incremental—albeit limited—information beyond questionnaires. These findings provide a plausible explanation for the high overall AUROC: the strongest signals likely reflect contemporaneous clinical severity (e.g., insomnia and anxiety) that may be proximal to, or partly shaped by, past-year suicidality rather than representing antecedent risk. Accordingly, our tool is best interpreted as a pragmatic outpatient triage aid to flag patients who warrant prioritized suicide-risk assessment, rather than as a model for forecasting future suicidal behavior. Among non-questionnaire features, thyroid autoantibodies (ATPO) and blood pressure were retained after feature selection and showed modest contributions, supporting further investigation of immune–endocrine and autonomic/cardiometabolic correlates of past-year suicidality in SSD, ideally in prospective and externally validated cohorts.
This study has several strengths: (1) a multicenter outpatient cohort of individuals with SSD, addressing a population in which suicide risk may be underrecognized; (2) rigorous variable selection using complementary methods (LASSO and Boruta) with prespecified criteria for model choice; (3) comprehensive performance assessment including discrimination, calibration, and decision-analytic net benefit rather than AUC alone; (4) transparent model explainability with SHAP at both global and individual levels; and (5) a pragmatic, Shiny-based web calculator that enables bedside use with routinely obtainable inputs.
This work also had limitations. First, the cross-sectional design precluded causal inference and did not capture the timing, recency, or recurrence of suicidality episodes; reverse causality cannot be excluded, as current symptom severity may partly reflect prior attempts rather than antecedent risk. Second, the primary outcome was derived from a single questionnaire item, introducing potential measurement error and misclassification; the assessment did not capture severity, frequency, recency, or other suicidal phenotypes. Third, although internal validation was strong, the cohort included adults aged 18–60 years from 3 hospitals in one region and one ethnic group, which may limit generalizability. In addition, source hospital identifiers were not retained in the analytic dataset and access to full outpatient records was restricted to protect privacy; therefore, site-specific external validation could not be performed. Fourth, residual confounding is possible (e.g., unmeasured psychosocial or treatment variables). Fifth, although we excluded outcome-adjacent measures (e.g., CGI and HAMD) to mitigate potential information leakage, some predictors may still represent proximal correlates of prior attempts, which could inflate internal performance. Sixth, restricting feature selection to the intersection of LASSO and Boruta may have excluded weak but stable predictors.
Conclusion
In a multicenter cross-sectional registry of individuals with SSD, a RANGER model stratified the likelihood of past-year self-reported suicidality with good discrimination, favorable calibration, and net clinical benefit. Model explainability highlighted insomnia, anxiety, and cognition as prominent contributors to model-based risk stratification. Although the web-based calculator illustrates potential utility, external validation and prospective implementation studies are warranted before routine adoption.
Supplementary Information
Below is the link to the electronic supplementary material.
Supplementary Material 1
Supplementary Material 2
Supplementary Material 3
Supplementary Material 4
Supplementary Material 5
The reference list from the paper itself. Each links out to its DOI / PubMed record.
- 1Seo JH, Han M, Kang S, Kim SJ, Jung I, Kang JI. Healthcare utilization and costs in patients with somatic symptom and related disorders compared with those with depression and healthy controls: a nationwide cohort study. Depress Anxiety. 2024;2024:8352965.10.1155/da/8352965 PMC 1191898740226752 · doi ↗ · pubmed ↗
- 2Ahsan MM, Luna SA, Siddique Z. Machine-learning-based disease diagnosis: a comprehensive review. Healthcare (Basel). 2022;10(3).10.3390/healthcare 10030541 PMC 895022535327018 · doi ↗ · pubmed ↗
- 3Battineni G, Sagaro GG, Chinatalapudi N, Amenta F. Applications of machine learning predictive models in the chronic disease diagnosis. J Pers Med. 2020;10(2).10.3390/jpm 10020021 PMC 735444232244292 · doi ↗ · pubmed ↗