The reference genome of a Sierra Nevada endemic, the cut-leaved monkeyflower, Mimulus laciniatus (syn. Erythranthe lacinata)
Jesús Martínez-Gómez, Merly Escalona, Jack M Colicchio, Lauren N Hamm, Mohan P A Marimuthu, Oanh Nguyen, Noravit Chumchim, William Seligmann, Rachel S Meyer, Jason P Sexton, Benjamin K Blackman

TL;DR
Scientists sequenced the genome of the cut-leaved monkeyflower, a plant found only in California's Sierra Nevada, to better understand how it adapts to harsh environments.
Contribution
The study provides a high-quality genome assembly for Mimulus laciniatus, enhancing resources for studying ecological adaptation in monkeyflowers.
Findings
The primary genome assembly is 309.97 Mb with a scaffold N50 of 20.99 Mb and 98.6% BUSCO completeness.
An alternate haplotype assembly spans 213.84 Mb, contributing to understanding genetic diversity.
The genome resource supports research on adaptation and speciation in the Mimulus clade.
Abstract
Mimulus laciniatus (syn. Erythranthe lacinata) is an annual plant endemic to the Sierra Nevada region of California. M. laciniatus is notable for its specialized ecological niche, thriving in granite outcrops of alpine environments characterized by shallow soils that dry out rapidly as the snowpack is exhausted during season-ending droughts. Due to its narrow habitat range and sensitivity to environmental change, this species serves as an important model for studying adaptation and survival in marginal habitats. As part of the California Conservation Genomics Project, here we report the sequencing and assembly of a high-quality nuclear genome and chloroplast genome of M. laciniatus. The primary assembly is 309.97 Mb and consists of 104 scaffolds with a scaffold N50 of 20.99 Mb, a largest contig size of 24.29 Mb, and a contig N50 of 11.09 Mb, The alternate haplotype assembly consists of…
Genes, proteins, chemicals, diseases, species, mutations and cell lines named across the full text — each resolved to its canonical identifier and authoritative record.
Click any figure to enlarge with its caption.
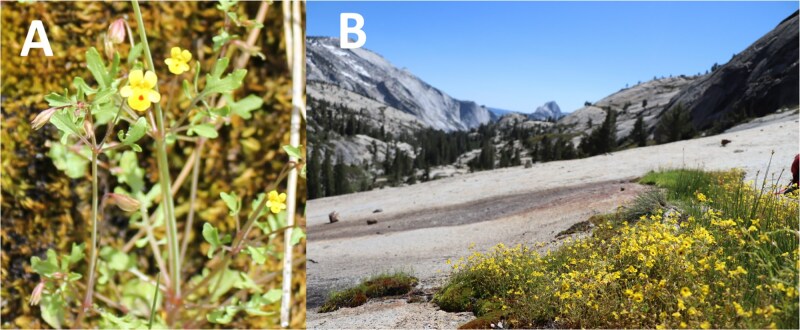 Fig. 1
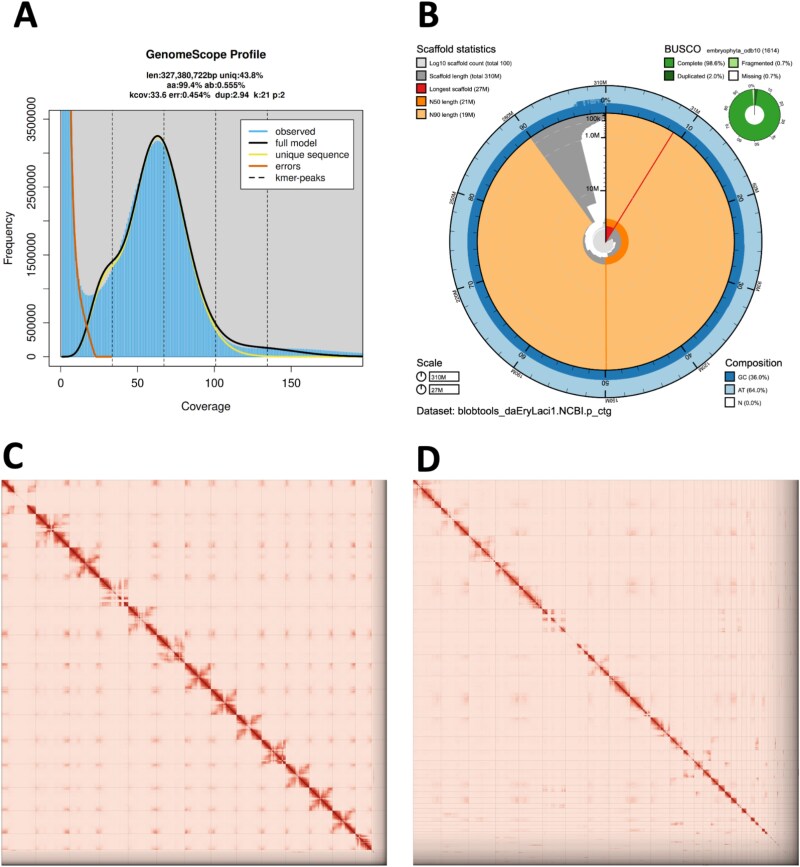 Fig. 2
|
|
|
|
| |
|---|---|---|---|---|
|
| ||||
| Filtering PacBio HiFi adapters | HiFiAdapterFilt | Commit 64d1c7b |
| |
|
| Meryl (k = 21) | 1 |
| |
|
| GenomeScope (−l.50) | 2 |
| |
|
| HiFiasm (Hi-C Mode, -l0, –primary, output hic.hap1.p_ctg, hic.hap2.p_ctg) | 0.19.5-r592 |
| |
|
| ||||
|
| Arima Genomics Mapping Pipeline | Commit 2e74ea4 |
| |
|
| BWA-MEM | 0.7.17-r1188 |
| |
| samtools | 1.11 |
| ||
| filter_five_end.pl (AGMP) | Commit 2e74ea4 |
| ||
| two_read_bam_combiner.pl (AGMP) | Commit 2e74ea4 |
| ||
| picard | 2.27.5 |
| ||
|
| SALSA (-DNASE, -i 20, -p yes) | 2 |
| |
|
| ||||
|
| BWA-MEM (-5SP) | 0.7.17-r1188 |
| |
|
| samtools | 1.11 |
| |
|
| pairtools | 0.3.0 |
| |
|
| pairix | 0.3.7 |
| |
|
| cooler | 0.8.10 |
| |
|
| hicExplorer (hicCorrectmatrix correct --filterThreshold −2 4) | 3.6 |
| |
|
| HiGlass | 2.1.11 |
| |
| PretextMap | 0.1.4 |
| ||
| PretextView | 0.1.5 |
| ||
| PretextSnapshot | 0.0.3 |
| ||
|
| Rapid curation pipeline (Wellcome Trust Sanger Institute, Genome Reference Informatics Team) | Commit 7acf220c |
| |
|
| ||||
|
| QUAST (--est-ref-size) | 5.0.2 |
| |
|
| BUSCO (-m geno, -l embryophyta) | 5.0.0 |
| |
| Merqury | 2020 January 29 |
| ||
|
| ||||
|
| BLAST+ (-db nt, -outfmt ‘6 qseqid staxids bitscore std’, -max_target_seqs 1, -max_hsps 1, -evalue 1e-25) | 2.15 |
| |
|
| BlobToolKit (HiFi coverage, BUSCO = embryophyta, NCBI Taxa ID = 4156) | 2.3.3 |
| |
|
| ||||
|
| Oatk | 1.0 (Commit |
| |
|
| GeSeq |
|
| |
|
| CCGP NCBI BioProject | PRJNA720569 | |||||
| Genera NCBI BioProject | PRJNA765633 | ||||||
| Species NCBI BioProject | PRJNA777196 | ||||||
| NCBI BioSample | SAMN38285827 | ||||||
| Specimen identification | CCGP_10_BB_OPN_1 | ||||||
| NCBI Genome accessions |
|
| |||||
| Assembly accession | |||||||
| Genome sequences | GCA_040207155.1 | GCA_040207145.1 | |||||
|
| PacBio HiFi reads | Run | 1 PACBIO_SMRT (Sequel IIe) run: 2 M spots, 30.2G bases, 18.5Gb | ||||
| Accession | SRX26067539 | ||||||
| Omni-C Illumina reads | Run | 2 ILLUMINA (Illumina NovaSeq 6000) runs: 107.1 M spots, 32.3G bases, 7.7Gb | |||||
| Accession | SRX26067540-1 | ||||||
|
| Assembly identifier (Quality code | daEryLaci1(7.7.P.Q49.C98) | |||||
| HiFi Read coverage | 95X | ||||||
|
|
| ||||||
| Number of contigs | 148 | 316 | |||||
| Contig N50 (bp) | 11,090,440 | 2,363,584 | |||||
| Contig NG50 | 11,090,440 | 838,590 | |||||
| Longest Contigs | 24,297,547 | 9,135,367 | |||||
| Number of scaffolds | 104 | 194 | |||||
| Scaffold N50 | 20,993,862 | 11,746,579 | |||||
| Scaffold NG50 | 20,993,862 | 4,460,205 | |||||
| Largest scaffold | 27,399,035 | 15,572,277 | |||||
| Size of final assembly | 309,971,392 | 213,857,377 | |||||
| Phased block NG50 | 11,220,445 | 1,195,452 | |||||
| Gaps per Gbp (# Gaps) | 142(44) | 570(122) | |||||
| Indel QV (Frame shift) | 51.35164467 | 49.71322245 | |||||
| Base pair QV | 61.0895 | 60.3083 | |||||
| Full assembly = 60.7531 | |||||||
| k-mer completeness | 98.8371 | 62.4651 | |||||
| Full assembly = 99.2715 | |||||||
| BUSCO completeness |
|
|
|
|
| ||
| H1 | 98.60% | 96.60% | 2.00% | 0.70% | 0.70% | ||
| H2 | 65.80% | 63.60% | 2.20% | 1.10% | 33.10% | ||
| Organelles | 1 Partial chloroplast sequence | ||||||
|
|
|
|
|
|
|---|---|---|---|---|
|
|
| OPN | 309.97 | This study |
|
| SF | 312.9 |
| |
|
| LVR1.1 | 315.4 |
| |
|
| IM767 | 314.6 |
| |
|
| IM62 | 339.7 |
| |
|
| IM155 | 295 |
| |
|
| IM444 | 323 |
| |
|
| IM502 | 263 |
| |
|
| IM541 | 327 |
| |
|
| IM664 | 300 |
| |
|
| IM909 | 311 |
| |
|
| IM1034 | 325 |
| |
|
| IM1192 | 284 |
| |
|
| LMC-L1 | 277 |
| |
|
| SWB-S1 | 278 |
| |
|
| FAN | 574 |
| |
|
| – | 391 |
| |
|
| EY7 | 599 |
| |
|
|
| LF10 | 423 |
|
|
| CE10 | 448 |
| |
|
| Mpar | 380 |
| |
|
| MvBL (v1.1) | 453 |
| |
|
|
| UCSD | 207 |
|
|
|
| – | 630 |
|
- —California Conservation Genomics Project
- —State of California, State Budget Act of 2019
- —National Science Foundation10.13039/100000001
- —National Institutes of Health Ruth L. Kirschstein National Research Service Award Individual Postdoctoral Fellowship
Peer Reviews
No public reviews on file for this paper yet. If you reviewed it on a platform where reviews are public (OpenReview, ICLR, NeurIPS, ICML), you can paste yours below so the community can read it here.
Videos
No videos yet. Explain this paper in a talk, walkthrough, or lecture? Add one.
Taxonomy
TopicsGenomics and Phylogenetic Studies · Plant Pathogens and Fungal Diseases · Plant Pathogens and Resistance
Introduction
A foundational goal in evolutionary biology, ecology, and conservation biology is to understand the processes that cause lineages to speciate, persist, and go extinct. The neoendemic plants of the California floristic province (CA-FP) are an excellent system to study the processes that create, maintain, and diminish biodiversity. The CA-FP is the only member of the 36 globally recognized biodiversity hotspots (Mittermeier et al. 2011) located in the continental United States and Canada (reviewed in Baldwin 2014). Endemic species—i.e. species with a distribution restricted to a particular geographic range—are an important contributor to the biodiversity of the CA-FP. Of the 6143 minimally ranked vascular plant taxa (i.e. species, subspecies, varieties) native to the CA-FP, 42% are endemic to the CA-FP (Baldwin and Goldman 2012, Burge et al. 2016). Furthermore, more than half of the endemics (63.6%) have an annual life history (Raven and Axelrod 1974). Endemic plants of California have been used as models to understand speciation, plasticity, and local adaptation (Hodges et al. 2004, Hufford and Mazer 2012, Pettengill and Moeller 2012, Gould et al. 2014, Sobel 2014, Hernández and Specht 2023), and understanding the mechanisms that shape diversity is necessary to develop conservation plans for endemics.
The yellow monkeyflower species complex Mimulus sect. Simiolus (syn. Erythranthe sect. Simiola) and the larger clade of monkeyflowers as a whole (reviewed in Yuan 2019), have long served as model lineages to study the evolutionary and ecological processes that drive adaptation and speciation (Vickery 1966, Wu et al. 2008, Twyford et al. 2015). The yellow monkeyflower clade has drawn interest due to its striking variation, including the colonization of diverse stressful edaphic environments (MacNair 1983, MacNair 1993, Lekberg et al. 2012, Sianta and Kay 2019), mating system evolution (Fenster and Ritland 1994, Martin and Willis 2007, Fishman et al. 2015), and transitions between annual and perennial life history strategies (Lowry et al. 2008, Coughlan et al. 2021). Members of this group are particularly well suited for the study of narrowly distributed taxa, especially those endemic to the CA-FP. About half of the ca. 50 minimally ranked monkeyflower taxa in sect. Simiolus are narrowly distributed (Nesom 2014), and 9 of these are endemic to CA-FP (Table S1).
Mimulus laciniatus A. Gray (syn. Erythranthe laciniata (A. Gray) G.L. Nesom) has garnered special attention in the study of narrowly distributed taxa (Fig. 1A; Note: Erythranthe laciniata is the appellation in the most recent taxonomic revision of this group (Barker et al. 2012). We continue to apply the older taxonomy for consistency with prior studies, predominance of use in the research community (Lowry et al. 2019), and public genomic resources including additional monkeyflower reference genome assemblies (Goodstein et al. 2012)). Mimulus laciniatus is restricted to the western slope of the Sierra Nevada and their western foothills. Across its range, M. laciniatus can be found in a wide range of climates and habitats (i.e. foothill woodland, montane mixed-conifer, subalpine, and alpine communities) and spans a broad elevational range (~900 to 3,270 m), but populations are generally restricted to seeps on granite outcrops, often co-occurring with mosses and spikemosses (Sexton and Dickman 2016, Fraga 2018; Fig. 1B). Mimulus laciniatus is largely self-fertilizing, reflected by its low observed heterozygosity (h_o_ = 0.07; Ferris et al. 2014) and high inbreeding coefficient (F_IS_ = 0.93; Sexton et al. 2016). The taxon is distinguished by its dissected leaves that differentiate it from nearly all other closely related members of the species complex except Mimulus filicifolius (syn. Erythranthe filicifolia; Sexton et al. 2013) and rare populations of Mimulus guttatus (syn. E. guttata and E. microphylla; Ferris et al. 2015). However, in the lab, M. laciniatus can readily be crossed with other members of the complex, and the presence of natural hybrid zones indicates low or lack of intrinsic reproductive barriers (Vickery 1978, Tataru et al. 2025). Given the degree of morphological and ecological differentiation with respect to the widely distributed outcrosser M. guttatus, this taxon has been used to study traits related to adaptive divergence and reproductive isolation, specifically the genetic basis of flowering time and its plasticity to environmental cues (Friedman and Willis 2013, Ferris 2016, Leinonen et al. 2020), leaf shape (Ferris et al. 2015, Ferris et al. 2017), and floral morphology (Ferris et al. 2017). Many of these traits are hypothesized or shown to be adaptive and contribute to local adaptation of the species (DeMarche et al. 2013, Ferris and Willis 2018, Tataru et al. 2023).
Mimulus laciniatus and its growth habit at Olmstead point. A) M. laciniatus inflorescence, displaying dissected leaves (photo credit: Benjamin Blackman). B) Source population of sequenced individual OPN: Olmstead point in Yosemite National Park, Mariposa County CA (photo credit: Diana Tataru).
In addition to this work on the ecology and genetics of speciation and adaptation, M. laciniatus has provided insight into the factors that limit species distributions (i.e. range limits) and on conservation strategies for narrow endemics of the CA-FP. Research has demonstrated that populations at the warmer edges of the species range (i.e. foothill habitats) benefit significantly from gene flow originating from populations occupying similar warm-edge climates (Sexton et al. 2011). Conversely, gene flow from centrally located populations (i.e. montane habitats) has been shown to have a detrimental effect, indicating the importance of the gene flow source. Moreover, patterns of genetic isolation by climate environment, rather than isolation by distance, have been found across the species range (Sexton et al. 2016). This finding underscores the importance of carefully evaluating spatial genetic relationships when developing conservation strategies, such as assisted gene flow programs to promote genetic or evolutionary rescue. Additionally, studies investigating adaptive responses to climate change have revealed substantial genetic potential for drought tolerance within this group (Dickman et al. 2019). However this resilience is relative. Compared to the widely distributed M. guttatus, M. laciniatus tolerates a narrower range of temperatures—a pattern consistent with other monkeyflower species pairs where distribution breath correlates with thermal tolerance (Sheth et al. 2014; Sheth and Angert 2014). The contrast between widely distributed species and narrowly distributed species highlights the distinct dynamics and unique vulnerabilities of narrowly distributed species, reinforcing the need for targeted study and conservation strategies.
Genomics has been instrumental in advancing many of these studies, providing critical insights and enabling novel approaches to answering fundamental questions in evolutionary biology, ecology, and conservation. For instance, DNA sequencing supports efforts to map the genetic basis of adaptive trait variation, infer evolutionary relationships, and provide necessary context and tools for conservation strategies. Prior genomic studies have largely been performed by aligning M. laciniatus sequences to a M. guttatus genome assembly as a reference, but reference genome bias, gene presence-absence variation, and structural variation create caveats or limitations that can impact results (Günther and Nettelblad 2019). Here we report a haplotype resolved genome of M. laciniatus. Produced as a part of the California Genomics Conservation Project (Fiedler et al. 2022, Shaffer et al. 2022) and used in concert with additional resources for more broadly distributed taxa in Mimulus sect. Simiolus (Lovell et al. 2025; Kollar et al. 2025), this genome will empower new, more rigorous research into how annual endemics of the CA-FP evolve and how to develop effective conservation strategies for these taxa.
Methods
Biological material
Dried fruits were collected from M. laciniatus located at site OPN (Olmstead Point; 37.81073°N, 119.48518°W; Elev. 2,530 m) in Yosemite National Park, Mariposa County, California (Leinonen et al. 2020). Seeds from this individual were grown in the lab and selfed for multiple generations; tissue was collected from a single descendant of this line. Multiple floral buds were collected in a 50 mL conical tube and frozen.
Nucleic acid library preparation
PacBio HiFi
We extracted high molecular weight (HMW) genomic DNA (gDNA) from 130 mg of buds using the cetyltrimethylammonium bromide (CTAB) method as described in Inglis et al. (2018), with the following modifications: 1) we used sodium metabisulfite (1% w/v) instead of 2-mercaptoethanol (1% v/v) in the sorbitol wash buffer and CTAB solution; 2) we repeated the tissue homogenate wash steps until the supernatant turned clear; 3) we performed the CTAB lysis step at 45 °C; and 4) the chloroform extraction step twice using ice-cold chloroform. The DNA purity was estimated by using the NanoDrop ND-1000 spectrophotometer (Thermo Fisher Scientific, Waltham, MA). The DNA yield (1.3 μg) was quantified using a Quantus Fluorometer (QuantiFluor ONE dsDNA Dye assay; Promega, Madison, WI), and the size distribution of the DNA was estimated using the Femto Pulse system (Genomic DNA 165 kb kit, Agilent, Santa Clara, CA), where 70% of the DNA fragments were found to be 30 kilobases (kb) or longer.
The HiFi SMRTbell library was constructed using the SMRTbell prep kit 3.0 (Pacific Biosciences—PacBio, Menlo Park, CA; Cat. #102-182-700) according to the manufacturer’s instructions. HMW gDNA was sheared to a target DNA size distribution between 15 and 18 kb using Diagenode’s Megaruptor 3 system (Diagenode, Belgium; cat. B06010003). The sheared gDNA was concentrated using 1× of SMRTbell cleanup beads provided in the SMRTbell prep kit 3.0 for the repair and a-tailing incubation at 37 °C for 30 min and 65 °C for 5 min, followed by ligation of overhang adapters at 20 °C for 30 min, clean-up using 1X SMRTbell cleanup beads, and nuclease treatment at 37 °C for 15 min. The SMRTbell library was size selected using 3.1X of 35% v/v diluted AMPure PB beads (PacBio, Cat. #100-265-900) to progressively remove SMRTbell templates < 5 kb. The 15 to 18 kb average HiFi SMRTbell library was sequenced at UC Davis DNA Technologies Core (Davis, CA) using one 8 M SMRT cell (PacBio, Cat #101-389-001), Sequel II sequencing chemistry 2.0, and 30-h movies each on a PacBio Sequel IIe sequencer.
Omni-C
The Omni-C library was prepared using the Dovetail™ Omni-C™ Kit (Dovetail Genomics, Scotts Valley, CA) according to the manufacturer’s protocol with slight modifications. First, tissue from floral buds and meristems was thoroughly ground with a mortar and pestle while cooled with liquid nitrogen. Nuclear isolation was then performed using published methods (Workman et al. 2018). Subsequently, chromatin was fixed in place in the nucleus and digested under various conditions of DNase I until a suitable fragment length distribution of DNA molecules was obtained. Chromatin ends were repaired and ligated to a biotinylated bridge adapter followed by proximity ligation of adapter containing ends. After proximity ligation, crosslinks were reversed and the DNA was purified from proteins. Purified DNA was treated to remove biotin that was not internal to ligated fragments. A next-generation sequencing library was generated using an NEB Ultra II DNA Library Prep kit (New England Biolabs, Ipswich, MA) with an Illumina compatible y-adaptor. Biotin-containing fragments were then captured using streptavidin beads. The post-capture product was split into two replicates prior to PCR enrichment to preserve library complexity with each replicate receiving unique dual indices. The library was sequenced at Vincent J. Coates Genomics Sequencing Lab (Berkeley, CA) on an Illumina NovaSeq 6000 platform (Illumina, CA) to generate approximately 100 million 2 × 150 bp read pairs per gigabase (Gb) of genome size.
Nuclear genome assembly
We assembled the genome of a M. laciniatus individual following the CCGP assembly pipeline Version 5.0, as outlined in Table 1 listing the tools and non-default parameters used in the assembly process. We removed the remnants of adapter sequences from the PacBio HiFi dataset using HiFiAdapterFilt (Sim et al. 2022) and generated an initial diploid phased assembly using HiFiasm (Cheng et al. 2022) in HiC mode, with the filtered PacBio HiFi reads and the Omni-C short-reads, a process that generates two assemblies, one per haplotype. We aligned the Omni-C data to each assembly following the Arima Genomics Mapping Pipeline (https://github.com/ArimaGenomics/mapping_pipeline) and then scaffolded the assemblies with SALSA (Ghurye et al. 2017, Ghurye et al. 2019).
The assemblies for both haplotypes were manually curated by iteratively generating and analyzing their corresponding Omni-C contact maps. Briefly, to generate the contact maps we aligned the Omni-C data with BWA-MEM (Li 2013), identified ligation junctions, and generated Omni-C pairs (Lee et al. 2022) using pairtools (Open2C et al. 2024). Then, we generated multi-resolution Omni-C matrices with Cooler (Abdennur and Mirny 2020) and balanced them with hicExplorer (Ramírez et al. 2018). We used HiGlass (Kerpedjiev et al. 2018) and the PretextSuite (https://github.com/wtsi-hpag/PretextView; https://github.com/wtsi-hpag/PretextMap; https://github.com/wtsi-hpag/PretextSnapshot) to visualize the contact maps. We identified misassemblies and misjoins in these contact maps, and modified the assemblies using the Rapid Curation pipeline from the Wellcome Trust Sanger Institute, Genome Reference Informatics Team (https://gitlab.com/wtsi-grit/rapid-curation). Some of the remaining gaps (joins generated during scaffolding and/or curation) were closed using the PacBio HiFi reads and YAGCloser (https://github.com/merlyescalona/yagcloser). We checked for contamination using the BlobToolKit Framework (Challis et al. 2020).
Genome quality assessment
We generated k-mer counts from the Omni-C short-read and PacBio HiFi long-read datasets. For the Omni-C short read data, we first removed adapters using cutadapt (Martin 2011), following the indications from Dovetail Genomics (https://omni-c.readthedocs.io/en/latest/assembly.html). For the long-read data, we used the adapter-trimmed dataset. Then, we generated the k-mer counts for each dataset using meryl (https://github.com/marbl/meryl). The k-mer counts were then used in GenomeScope2.0 (Ranallo-Benavidez et al. 2020) to estimate genome features including genome size, heterozygosity, and repeat content. To obtain general contiguity metrics, we ran QUAST (Gurevich et al. 2013). To evaluate genome quality and functional completeness, we used BUSCO (Manni et al. 2021) with the Embryophyta ortholog database (embryophyta_odb10) which contains 1,614 genes. Assessment of base level accuracy (QV) and k-mer completeness was performed using the previously generated meryl database and merqury (Rhie et al. 2020). We further estimated genome assembly accuracy via BUSCO gene set frameshift analysis using the pipeline described in Korlach et al. (2017). Measurements of the size of the phased blocks is based on the size of the contigs generated by HiFiasm on HiC mode. We follow the quality metric nomenclature established by Rhie et al. (2021), with the genome quality code x.y.P.Q.C, where, x = log10[contig NG50]; y = log10[scaffold NG50]; P = log10 [phased block NG50]; Q = Phred base accuracy QV (quality value); C = % genome represented by the first “n” scaffolds, following a karyotype of 2n = 28 for this species (Vickery 1995). Quality metrics for the notation were calculated on the primary haplotype assembly.
Chloroplast genome assembly
The chloroplast sequence for M. laciniatus was generated with Oatk (https://github.com/c-zhou/oatk). We used GeSeq (Tillich et al. 2017) to generate a draft genome annotation. After completion of the nuclear genome, we searched for matches of the resulting chloroplast assembly sequence in the nuclear genome assembly using BLAST+ (Camacho et al. 2009) and filtered out contigs and scaffolds from the nuclear genome with a percentage of sequence identity > 99% and size smaller than the chloroplast assembly sequence.
Results
Sequencing results
The Omni-C library generated 278.87 million read pairs, and the PacBio HiFi library generated 1.99 million reads. The PacBio HiFi sequences yielded ~95× genome coverage and had an N50 read length of 16,599 bp; a minimum read length of 137 bp; a mean read length of 15,173 bp; and a maximum read length of 55,779 bp (see Fig. S1 for read length distribution). Based on k-mer analysis of both short- and long-read data, we estimated a genome size of ~ 317.72 Mb. The estimations vary depending on the dataset used. Omni-C short-read data estimated a heterozygous rate of 0.56%, a sequencing error of 0.454%, and a genome size of 327.38 Mb (Fig. 2A), while the PacBio HiFi long-read data estimated a heterozygous rate of 0.26%, a sequencing error of 0.124, and a genome size of 308.07 Mb (Fig. S2a). Using default parameters for these estimations shows poor model fitting (Table S2), especially for the long-read data, so we modified the parameterization of the underlying model by using l = 50 (corresponding to the 1n peak, which is half of the coverage of our major peak; Fig. S2).
Mimulus laciniatus genome metrics. A) K-mer spectrum of Omni-C short read data without adapters using Genomescope 2.0. A single peak consistent with a selfer. B) BlobToolKit snail plot showing visualization of metrics of the primary assembly (daEryLaci1.0.p). C,D) Hi-C contact maps for the primary (C) and alternate (D) genome.
Nuclear genome assembly
The final genome assembly (daEryLaci1) consists of two phased haplotypes. Both assemblies are similar in size, but not equal to the estimated genome size from GenomeScope2.0, as has been observed in other taxa (see e.g. Pflug et al. 2020).
The primary haplotype assembly (daEryLaci1.0.p) consists of 104 scaffolds spanning 309.97 Mb with a contig N50 of 11.09 Mb, a scaffold N50 of 20.99 Mb, the largest contig size of 24.29 Mb, and the largest scaffold size of 27.39 Mb. The alternate haplotype assembly (daEryLaci1.0.a) consists of 194 scaffolds spanning 213.85 Mb with a contig N50 of 2.36 Mb, a scaffold N50 of 11.74 Mb, the largest contig size of 9.13 Mb and the largest scaffold size of 15.56 Mb. The primary haplotype assembly has a BUSCO completeness score for the Embryophyta gene set of 98.6%, a base pair quality value (QV) of 61.08, a kmer completeness of 98.83%, and a frameshift indel QV of 51.35. The alternate haplotype assembly has a BUSCO completeness score for the Embryophyta gene set of 65.8%, a base pair QV of 60.3, a kmer completeness of 62.46%, and a frameshift indel QV of 49.71.
During manual curation we made a total of 86 joins (56 on the primary haplotype and 30 on the alternate haplotype) and 26 breaks (11 on the primary haplotype and 15 on the alternate haplotype) based on the Omni-C contact map signal. We closed a total of 18 gaps (7 on the primary haplotype and 11 on the alternate haplotype) and filtered out 5 contigs corresponding to chloroplast contamination. No other contigs were removed or modified. The Omni-C contact maps show highly contiguous assemblies, with chromosome-length scaffolds (Fig. 2B). Assembly statistics are reported in Table 2 and represented graphically in Fig. 2C. We have deposited the genome assembly on NCBI GenBank (See Table 2 and Data Availability for details).
Chloroplast genome assembly
We assembled a partial chloroplast genome for M. laciniatus with Oatk. The final chloroplast sequence has a size of 155,214 bp, with base composition of A = 30.69%, C = 19.18%, G = 18.54%, T = 31.54%.
Discussion
Genome size distribution in the monkeyflowers
The assembly of the M. laciniatus genome represents the first reference genome assembly from a narrowly distributed member of the larger Phrymaceae family. The genome makes M. laciniatus the 11th member of genus Mimulus (sensu lato) and the 6th in section Simiola (pre Barker et al. 2012 taxonomic revision; Table 3) with a reference genome assembly. While we did not obtain a chromosome-level assembly, the first 14 scaffolds are by far the largest (Fig. 2C), consistent with prior chromosome counts (2n = 28; Vickery 1995). Of the other plant genomes published in the CCGP, spanning liverworts, ferns and vascular plants, the M. laciniatus genome is the smallest to date (Anghel et al. 2022, Chaturvedi et al. 2024, González-Ramírez et al. 2024, Song et al. 2025). The genome size of the primary assembly is 309.97 Mb (Fig. S2), consistent with prior flow cytometry-based estimates (i.e. 360 to 368 Mb; Ferris et al. 2014). Our genome size range falls well within the range of other genomes in section Simiola (average = 338 Mb; Table 3). Genome sizes, of the assemblies or as determined by flow cytometry, are relatively stable in the genus overall (Range: 207 to 630 Mb), with the exceptions of recent allotetraploid Mimulus sookensis (574 Mb; Whitener et al. 2024), the allotetraploid Mimulus luteus var. luteus (599 Mb; Cooley et al. 2022), and Mimulus ringens (630 Mb; Bai et al. 2012). Mimulus luteus var. luteus belongs to a larger clade that experienced an ancestral polyploidization event, resulting in an approximate doubling of the base chromosome number (n = 30; Beardsley et al. 2004). In contrast, M. ringens, which is not known to be a polyploid and has a smaller but variable base chromosome number (n = 8, 11, 12; Iyer 1980, Vickery 1995), is distantly related to the species in section Simiola. Nonetheless, the sequenced monkeyflower genomes likely represent a bias towards diploids, as polyploidy is common especially in section Simiola (Vickery 1995; Beardsley et al. 2004).
Genomics provides insight into the process of speciation
Mimulus laciniatus has been recognized as a morphologically and ecologically distinct species, yet its speciation history has remained unclear. Differences in flowering time and habitat differentiation have been identified as important prezygotic reproductive isolation barriers between M. laciniatus and M. guttatus (Ferris et al. 2017, Tataru et al. 2023). Yet, early phylogenetic analyses with few nuclear markers were unable to resolve the evolutionary relationship of M. laciniatus, particularly whether or not it represents a selfing lineage derived from M. guttatus independently from the origin of M. nasutus (Ritland et al. 1993, Ferris et al. 2014). A recent study using whole genome resequencing data has found that M. laciniatus forms a well-supported clade with M. nasutus, and this clade is sister to the, previously named, “southern M. guttatus clade” that includes both annual and perennial M. guttatus populations (Ivey et al. 2023). Additional investigation into these relationships is needed, however, to account for any complicating signals resulting from historic and ongoing introgression; natural hybrid zones between M. laciniatus, M. nasutus, M. guttatus likely introduce phylogenetic ambiguity (Vickery 1978; Tataru et al. 2025). The accession we have sequenced, OPN, comes from a population that is not sympatric with either M. nasutus or M. gutattus. Thus, the new M. laciniatus genome we have assembled provides an excellent resource that may be used in conjunction with the newly published M. nasutus (Lovell et al. 2025) and southern M. guttatus clade (Kollar et al. 2025) genome assemblies to continue disentangling the complicated evolutionary history of the yellow monkeyflower species complex as well as to investigate how gene flow and introgression have contributed to differentiation and homogenization of these lineages.
Importance of conservation strategies tailored to endemics of the CA-FP
In an era defined by rapid biodiversity loss and climate instability, understanding how species adapt at the genomic level has become increasingly crucial for effective conservation. This new M. laciniatus reference genome provides a foundation for future evolutionary and conservation genetics studies to uncover genetic mechanisms underpinning resilience in extreme environments. Due to its restricted range and specialized habitat requirements, M. laciniatus faces inherent vulnerability to climate change, reflected by its automatic classification as California Rare Plant Rank 4. Even so, M. laciniatus populations possess adaptive variation that can respond to strong selection pressures. For instance, resurrection experiments using seed collected before and after the multi-year drought experienced in the Western US in the 2010s found that seed from post-drought collections germinated more quickly than seed from pre-drought collections, indicative of adaptation for drought escape (Dickman et al. 2019). Climate conditions also appear to affect the extent of gene flow with other taxa. The strength of reproductive isolation between M. laciniatus and M. guttatus is stronger in drought years compared to wetter years (Tataru et al. 2023), suggesting that drought years promote M. laciniatus to differentiate more from M. guttatus, but also limiting potential contributions of adaptive introgression to genetic or evolutionary rescue. Understanding the phenotypic and genomic diversity of M. laciniatus is therefore critical for predicting evolutionary and ecological responses to environmental change and guiding conservation interventions. This reference genome will allow evolutionary and landscape genomics studies that can identify adaptive genetic variants or centers of genetic diversity and guide actions such as habitat preservation, assisted migration, and genetic rescue (Shay et al. 2021, Fiedler et al. 2022; Shaffer et al. 2022). Such insights may be extendable to the > 40 additional monkeyflowers (Mimulus sensu lato) in the California Rare Plant Inventory (Table S1) or to California endemic plants more broadly.
Supplementary Material
Supplementary_Figures_Revised_esaf059
Table_S1_Revised_esaf059
Table_S2_Revised_esaf059
The reference list from the paper itself. Each links out to its DOI / PubMed record.
- 1Abdennur N, Mirny LA. Cooler: scalable storage for hi-C data and other genomically labeled arrays. Bioinformatics. 2020;36:311–316. 10.1093/bioinformatics/btz 54031290943 PMC 8205516 · doi ↗ · pubmed ↗
- 2Anghel IG, Jacobs SJ, Escalona M, Marimuthu MP, Fairbairn CW, Beraut E, Nguyen O, Toffelmier E, Shaffer HB, Zapata F. Reference genome of the color polymorphic desert annual plant sandblossoms, Linanthus parryae. J Hered. 2022;113:712–721. 10.1093/jhered/esac 05236107789 PMC 9709995 · doi ↗ · pubmed ↗
- 3Bai C, Alverson WS, Follansbee A, Waller DM. New reports of nuclear DNA content for 407 vascular plant taxa from the United States. Annals of Botany. 2012;110:1623–1629. 10.1093/aob/mcs 22223100602 PMC 3503501 · doi ↗ · pubmed ↗
- 4Baldwin BG, Goldman DH eds. The Jepson manual: vascular plants of California. Oakland (CA): University of California Press; 2012. 10.1525/9780520951372 · doi ↗
- 5Baldwin BG . Origins of plant diversity in the California Floristic Province. Annu Rev Ecol Evol Syst. 2014;45:347–369. 10.1146/annurev-ecolsys-110512-135847 · doi ↗
- 6Barker WR, Nesom GL, Beardsley PM, Fraga NS. A taxonomic conspectus of Phrymaceae: a narrowed circumscription for Mimulus, new and resurrected genera, and new names and combinations. Phytoneuron. 2012;39:1–60.
- 7Beardsley PM, Schoenig SE, Whittall JB, Olmstead RG. Patterns of evolution in western north American Mimulus (Phrymaceae). Am J Bot. 2004;91:474–489. 10.3732/ajb.91.3.47421653403 · doi ↗ · pubmed ↗
- 8Brandvain Y, Kenney AM, Flagel L, Coop G, Sweigart AL. Speciation and introgression between Mimulus nasutus and Mimulus guttatus. P Lo S Genet. 2014;10:e 1004410. 10.1371/journal.pgen.100441024967630 PMC 4072524 · doi ↗ · pubmed ↗