QTL identification for yield components using single segment substitution lines dissected by rice CSSL-Z799
Xiaodong Wang, Aoni Xiang, Xinyu Fan, Guofeng Li, Minghui Zhao, Dachuan Wang, Kaiyue Yang, Yinghua Ling, Zhenglin Yang, Fangming Zhao

TL;DR
This study identifies genetic regions (QTL) in rice that affect yield traits and explains how these regions influence grain length through different cellular mechanisms.
Contribution
The study introduces a new method using SSSLs to identify 35 QTL for rice yield traits and reveals distinct cellular mechanisms for grain length enhancement.
Findings
Five SSSLs identified 35 QTL for yield traits, including five distinct QTL for grain length.
Four QTL increased grain length via cell division, while one QTL did so via cell expansion.
The CSSL Z799 provides a platform for gene cloning and designed breeding.
Abstract
As one of the world’s most important cereals, rice (Oryza sativa L.) demands sustained yield improvement. However, this goal is challenging because yield components are complex quantitative traits governed by numerous minor-effect genes. To reveal this genetic complexity, Single Segment Substitution Lines (SSSLs) provide an ideal platform for gene identification and designed breeding. Here, we report on a Chromosome Segment Substitution Line (CSSL), Z799, containing 10 substitution segments from the restorer line R225 in the genetic background of Nipponbare. These substitution located on eight different chromosomes, with an average substitution length of 3.0 Mb. Z799 exhibited a complex yield-related phenotype relative to Nipponbare, with several traits being significantly altered. Genetic mapping in a secondary F2 population of Nipponbare/Z799 uncovered 27 QTL, but a more efficient…
Genes, proteins, chemicals, diseases, species, mutations and cell lines named across the full text — each resolved to its canonical identifier and authoritative record.
Click any figure to enlarge with its caption.
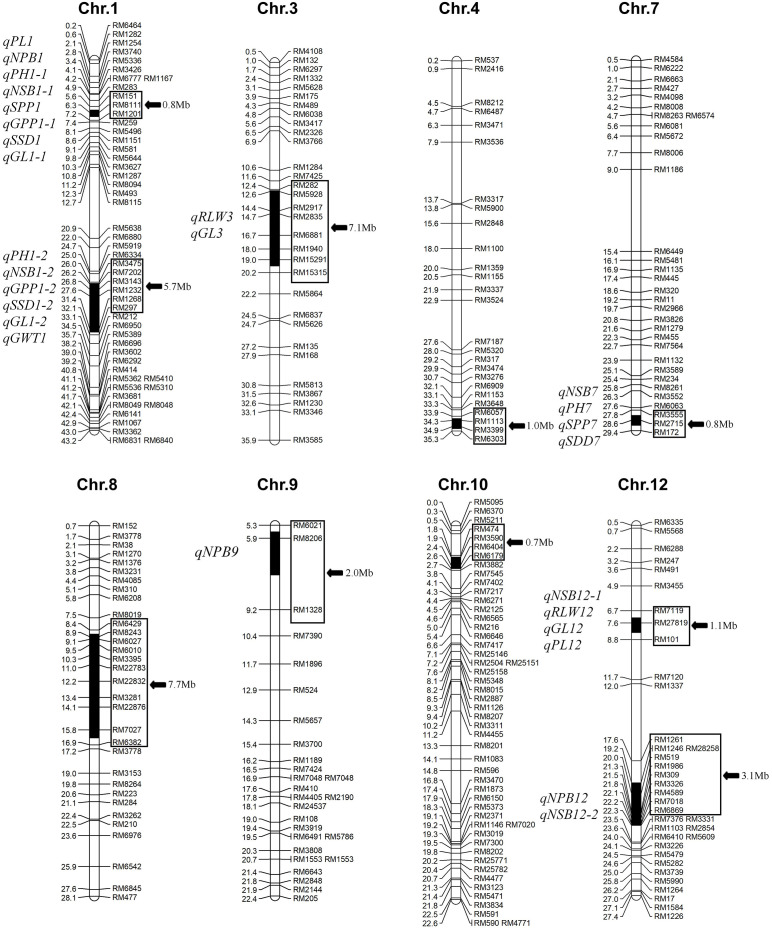 Figure 1
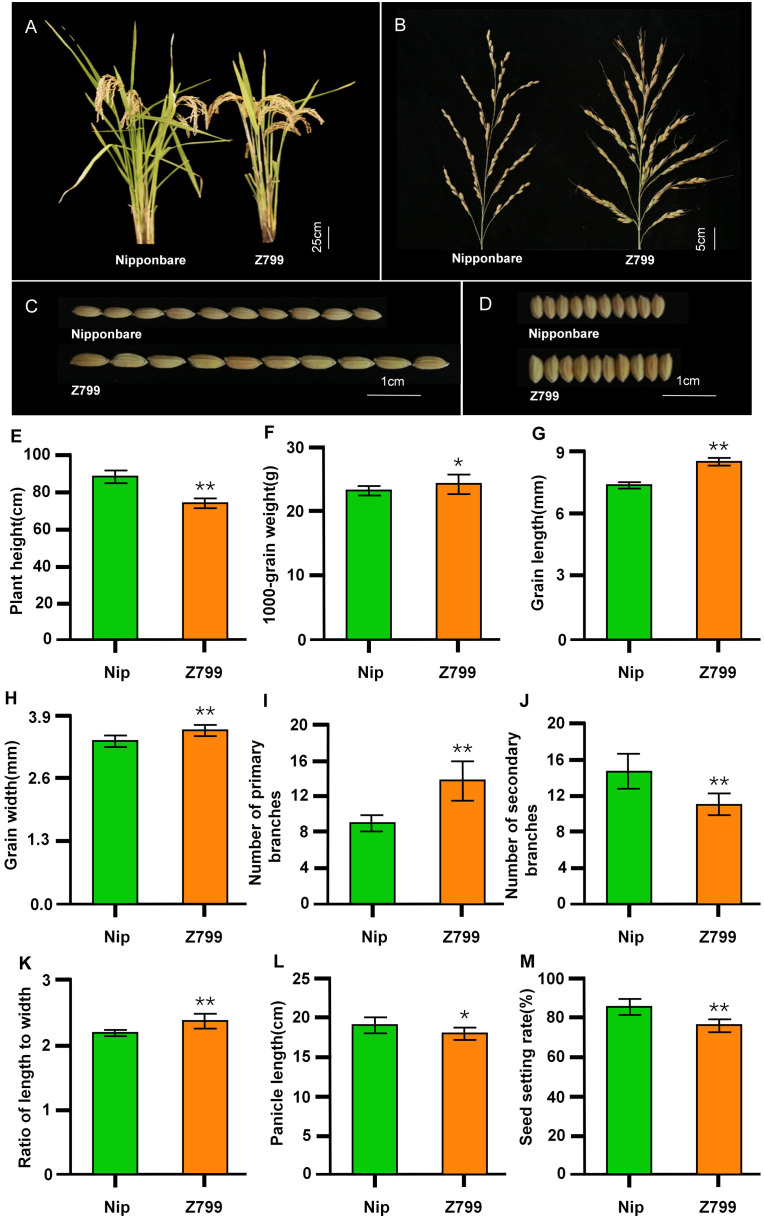 Figure 2
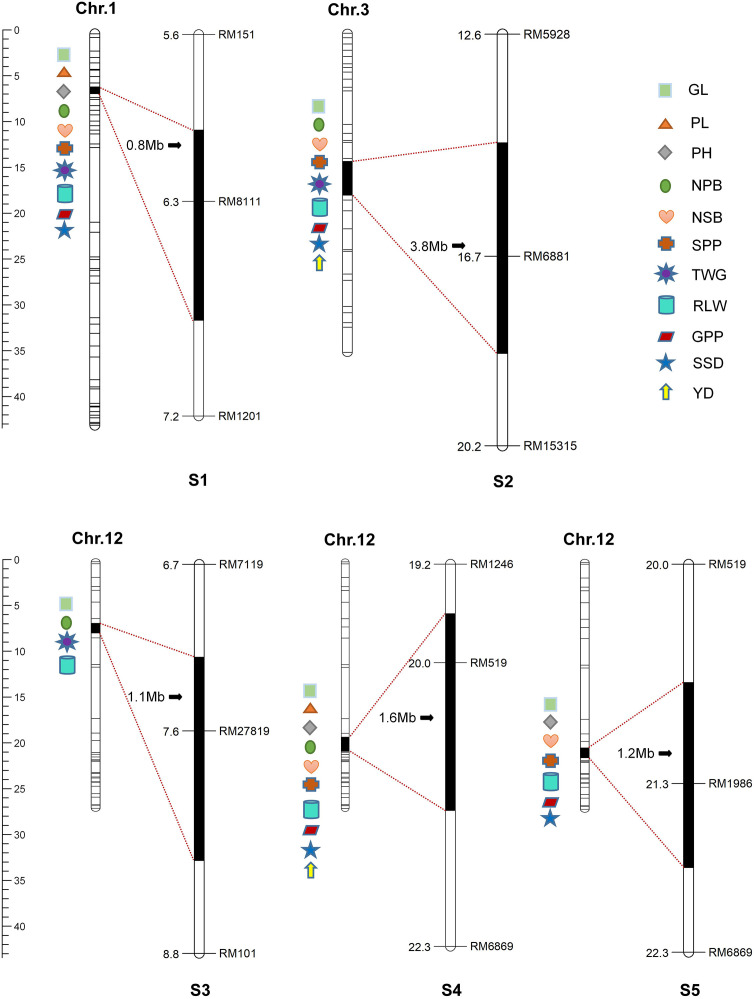 Figure 3
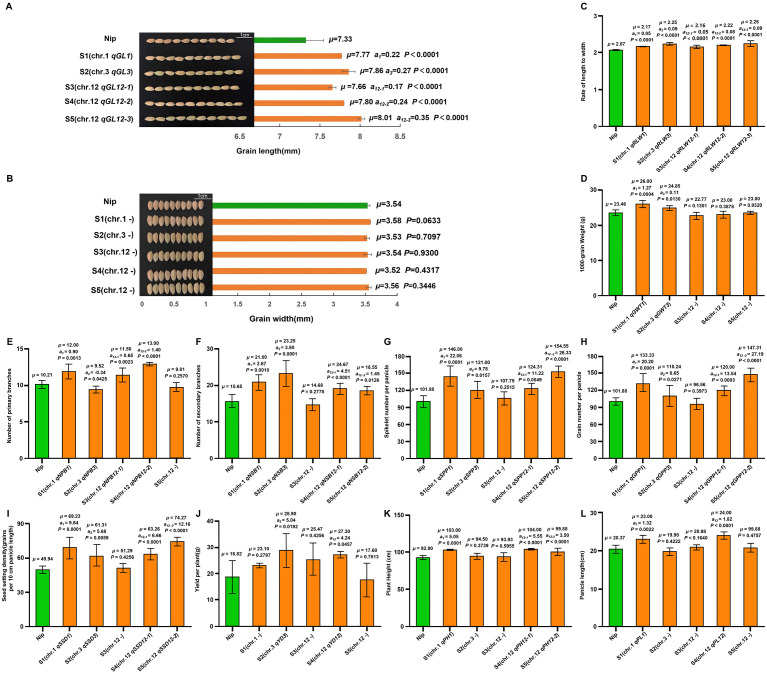 Figure 4
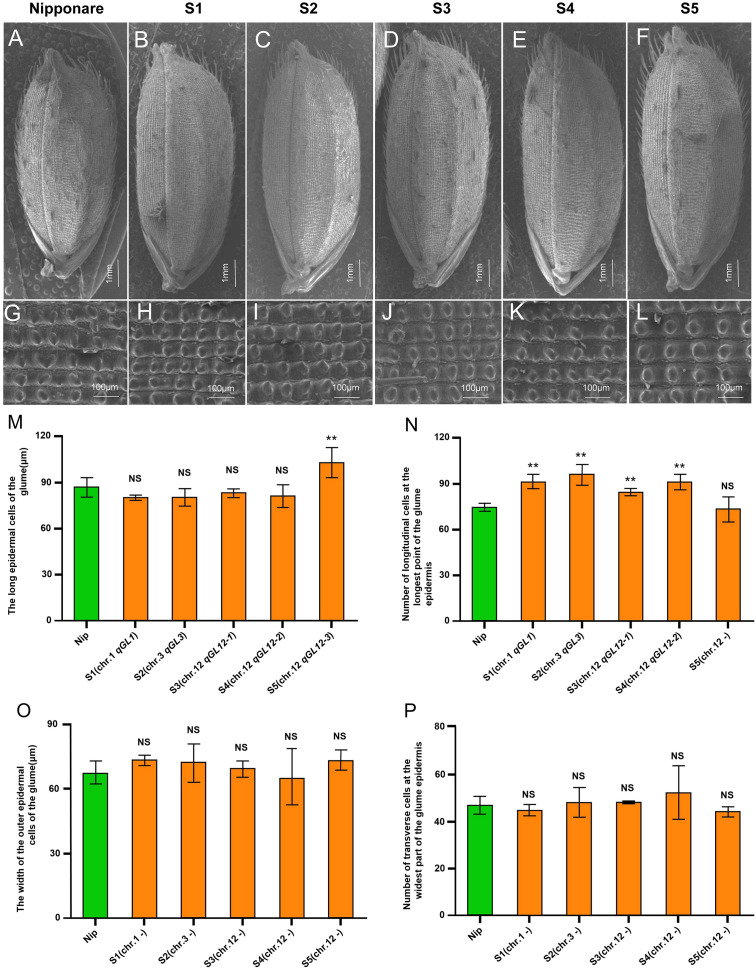 Figure 5
| Traits | QTL | Chromosome | Linked marker | Additive effect | Expained | |
|---|---|---|---|---|---|---|
| Panicle length (cm) |
| 1 | RM8111 | 0.51 | 10.61 | <0.0001 |
|
| 12 | RM27819 | -0.47 | 9.62 | 0.0075 | |
| Number of primary branches |
| 1 | RM8111 | 0.43 | 17.45 | <0.0001 |
|
| 7 | RM172 | 0.36 | 12.58 | <0.0001 | |
|
| 9 | RM8206 | 0.19 | 3.45 | 0.0240 | |
|
| 12 | RM519 | 0.31 | 9.48 | 0.0028 | |
| Plant height (cm) |
| 1 | RM8111 | 1.59 | 3.14 | 0.0221 |
|
| 1 | RM1268 | -2.96 | 10.96 | <0.0001 | |
|
| 7 | RM172 | 1.60 | 3.27 | 0.0194 | |
| Number of secondary branches |
| 1 | RM8111 | 1.64 | 8.40 | 0.0004 |
|
| 1 | RM1268 | -1.37 | 5.86 | 0.0064 | |
|
| 12 | RM27819 | -1.19 | 4.49 | 0.024 | |
|
| 12 | RM519 | 1.71 | 9.29 | 0.0021 | |
| Spikelets per panicle |
| 1 | RM8111 | 10.70 | 16.54 | <0.0001 |
|
| 7 | RM172 | 5.34 | 4.25 | 0.0106 | |
| Grains per panicle |
| 1 | RM8111 | 5.88 | 5.35 | 0.0018 |
|
| 1 | RM1268 | -4.63 | 3.34 | 0.0185 | |
| Seed-setting density |
| 1 | RM8111 | 3.83 | 13.19 | <0.0001 |
|
| 1 | RM1268 | -1.96 | 3.49 | 0.0306 | |
|
| 7 | RM172 | 2.02 | 3.76 | 0.0149 | |
| Grain length (mm) |
| 1 | RM8111 | 0.05 | 2.44 | 0.0491 |
|
| 1 | RM1268 | 0.10 | 9.23 | 0.0005 | |
|
| 3 | RM5928 | 0.05 | 2.66 | 0.0263 | |
|
| 12 | RM27819 | 0.06 | 2.81 | 0.0351 | |
| Ratio of length to width |
| 3 | RM5928 | 0.02 | 3.53 | 0.0071 |
|
| 12 | RM27819 | 0.02 | 4.15 | 0.0129 | |
| 1000-grain weight (g) |
| 1 | RM1268 | 0.39 | 2.47 | 0.0270 |
| Traits | PH | PN | GL | GW | GWT | YD | PL | NPB | NSB | GPP | SPP | SSR | RLW | SSD |
|---|---|---|---|---|---|---|---|---|---|---|---|---|---|---|
| PH | 1 | |||||||||||||
| PN | 0.121 | 1 | ||||||||||||
| GL | 0.015 | -0.122 | 1 | |||||||||||
| GW | -0.025 | -0.071 | 0.018 | 1 | ||||||||||
| GWT | 0.009 | -0.191* | 0.122 | 0.283** | 1 | |||||||||
| YD | 0.200* | 0.604** | 0.081 | 0.005 | 0.021 | 1 | ||||||||
| PL | 0.129 | 0.047 | 0.021 | 0.038 | 0.005 | 0.102 | 1 | |||||||
| NPB | 0.106 | 0.009 | -0.048 | 0.027 | -0.009 | 0.039 | 0.323** | 1 | ||||||
| NSB | 0.190 | 0.141 | -0.012 | 0.009 | -0.031 | 0.146 | 0.213* | 0.210* | 1 | |||||
| GPP | 0.019 | -0.025 | 0.009 | -0.042 | -0.045 | 0.027 | 0.089 | 0.020 | 0.070 | 1 | ||||
| SPP | 0.112 | 0.043 | -0.018 | -0.019 | -0.034 | 0.090 | 0.171 | 0.122 | 0.217* | 0.764** | 1 | |||
| SSR | 0.020 | -0.022 | 0.032 | 0.001 | -0.012 | 0.013 | 0.043 | 0.007 | 0.018 | 0.580** | 0.453** | 1 | ||
| RLW | -0.018 | 0.027 | 0.314** | -0.412** | -0.193* | 0.025 | -0.021 | -0.005 | -0.042 | 0.018 | 0.006 | 0.024 | 1 | |
| SSD | 0.092 | 0.011 | -0.020 | 0.002 | -0.040 | 0.066 | 0.141 | 0.072 | 0.166 | 0.610** | 0.773** | 0.320** | -0.011 | 1 |
Peer Reviews
No public reviews on file for this paper yet. If you reviewed it on a platform where reviews are public (OpenReview, ICLR, NeurIPS, ICML), you can paste yours below so the community can read it here.
Videos
No videos yet. Explain this paper in a talk, walkthrough, or lecture? Add one.
Taxonomy
TopicsGenetic Mapping and Diversity in Plants and Animals · Rice Cultivation and Yield Improvement · Plant Molecular Biology Research
Introduction
1
Rice (Oryza sativa L.), one of the world’s most important food crops, also play a vital role in China’s agricultural production (Gross and Zhao, 2014). Enhancing the yield is still a central objective of ongoing breeding efforts. Rice yield is primarily determined by grain weight, number of grains per panicle, and number of effective panicles (Song et al., 2022). These traits often exhibit complex trade-offs and constraints; deciphering their intrinsic genetic regulatory networks is key to achieving breakthroughs in breeding. Dissecting these quantitative trait loci (QTL) that regulate rice yield traits into specific chromosome segment substitution lines (CSSLs) is therefore essential for achieving high-yield design breeding.
CSSLs enable the precise identification of QTL (Koumproglou et al., 2002; Subudhi et al., 2015) and are also important resources for studying gene function and designed breeding (Zhang et al., 2021). When a CSSL contains only a single substituted segment, it is referred to as a single-segment substitution line (SSSL), which represents a more efficient genetic and breeding resource Zhang (2021). To date, numerous yield-related QTL have been map-based cloned and functionally characterized using CSSLs or near-isogenic lines (NILs). The GW2 gene encodes a RING-type E3 ubiquitin ligase. It functions by specifically recognizing and degrading positive regulators of the cell cycle, such as OsSPL16, through the ubiquitin-proteasome system (UPS). The process suppresses the mitotic activity of lemma epidermal cells and ultimately results in a significant reduction in rice grain width (Song et al., 2007). GS5 encodes a serine carboxypeptidase and positively regulates grain width, grain filling, and thousand-grain weight in rice (Li et al., 2011; Liu et al., 2017). The TGW2 gene encodes an F-box-type cell proliferation regulator, OsCNR1, which specifically interacts with the cell cycle inhibitor KRP1 (Kip-related protein 1) to mediate its ubiquitination and degradation. Impairment of this regulatory module reduces cell proliferation activity, ultimately leading to decrease the grain width and thousand-grain weight by approximately 15% and 20%, respectively (Ruan et al., 2020). GSW3.1 positively regulates grain size and thousand-grain weight (Long et al., 2024). Promoter variation of SGW5 drives its high expression in wide-grain varieties, positively regulating grain width by influencing lemma cell size and division (Abbas et al., 2024). GS3 is a major QTL controlling grain size, functioning as a negative regulator in modulating grain and organ size (Mao et al., 2010; Zhang et al., 2012). GL7 is a QTL on chromosome 7 that primarily controls grain length and width in rice (Wang et al., 2015). It encodes a cell elongation regulator functionally homologous to the Arabidopsis LONGIFOLIA protein. In large-grain germplasm, a 17.1-kb tandem repeat sequence upstream of the GL7 gene enhances grain length and significantly improves rice appearance quality (Lee et al., 2006; Wang et al., 2015). OsGSW3.2 (also known as qGL3.5) is a natural variant allele identified on chromosome 3, derived from the Oryza rufipogon inbred line Huaye3 (HY3). It negatively affects grain size by regulating cell proliferation and the brassinosteroid (BR) signaling pathway, and its natural variation is closely associated with the differentiation between indica and japonica rice subspecies (Chu et al., 2006). OsSPL16/GW8 is a SBP domain transcription factor. It directly binds to the promoter region of the GW7 gene and inhibits its transcriptional activity. This regulatory mechanism constitutes a network for the negative control of grain width in rice (Wang et al., 2015). GS9 encodes a transcriptional regulatory protein that lacks clearly defined conserved domains and functions to regulate grain shape by modulating cell division patterns (Zhao et al., 2018). OsSPL13 (encoded by GLW7) is a rice-specific transcription factor that positively regulates lemma cell size, significantly promoting longitudinal grain elongation and grain weight (Sheng et al., 2022). As a newly identified positive regulator, GW5 mediates the brassinosteroid signaling pathway, leading to increase rice grain width and weight (Liu et al., 2017). Gn1a regulates rice grain number per panicle by encoding OsCKX2; a cytokinin oxidase/dehydrogenase; its downregulation elevates cytokinin levels in the panicles, resulting in more primary branches and enhanced yield (Kurakawa et al., 2007). GRAIN SIZE AND NUMBER1 (GSN1) encodes a mitogen-activated protein kinase phosphatase, OsMKP1. Within the rice cell signaling network, OsMKP1 specifically binds to and dephosphorylates OsMPK6, inactivating this kinase. The action negatively regulates the OsMKKK10-OsMKK4-OsMPK6 cascade, ultimately influencing the number of secondary branches and grain size (Duan et al., 2014; Guo et al., 2018; Liu et al., 2015). The panicle architecture gene DEP1 is directly activated by the transcription factor IPA1 (OsSPL14). IPA1 expression is negatively regulated by OsmiR156; a point mutation that escapes this repression causes IPA1 accumulation, which in turn promotes primary branching and suppresses tillering by activating target genes including DEP1, thereby shaping ideal panicle structure (Jiao et al., 2010; Miura et al., 2010). The cloning of these QTL has laid a solid foundation for molecular design breeding of high-yield rice.
Although some yield-related QTL have been cloned, many minor-effect QTL remain unidentified. To address this, it is essential to develop a single-segment substitution lines (SSSLs) library to eliminate background interference. However, SSSL development is a challenging systematic project, requiring gradual screening to reduce multiple substitution segments to a single segment. Based on previous research using the rice chromosome segment substitution line Z255―which carries 18 substitution segments in Nipponbare genetic background (Zhang et al., 2025)―this study further utilized the CSSL-Z799 (derived from Nipponbare/Z255 and containing 10 substitution segments) as research material. We performed QTL mapping for yield-related traits and developed secondary single-segment substitution lines. Using five derived SSSLs, additive effect analysis of QTL for yield traits were analyzed, and cytological examinations of grains was conducted for SSSLs harboring grain shape QTL. This work lays the foundation for the future map-based cloning of related genes, while also provides reliable genetic information and resources for molecular design breeding in rice.
Materials and methods
2
Plant materials
2.1
Rice CSSL-Z799 was developed through marker-assisted selection (MAS) from the progeny (F_2:5_) of a cross between Nipponbare and Z255―a CSSL carrying 18 substitution segments from the indica restorer line R225 in the Nipponbare genetic background. The resulting CSSL contains 10 substitution segments (Zhang et al., 2025). The recipient parent, Nipponbare, is a high-quality japonica cultivar with a fully sequenced genome. While the donor parent, R225, is an elite indica restorer line developed by the Rice Research Institute.
Based on the MAS-derived background of Z799, this study used 16 polymorphic molecular markers (RM8111, RM7202, RM1268, RM5928, RM6303, RM172, RM8243, RM7027, RM8206, RM474, RM3590, RM6404, RM1246, RM27819, RM28258, RM519) corresponding to the 10 substitution segments and 32 polymorphic SSR markers outside these segments to verify the substitution segments and assess genetic background purity using 10 Z799 plants. Banding patterns identical to the recipient parent Nipponbare were scored as “-1”; those matching the donor parent R225 were scored as “1”; and heterozygous banding patterns were scored as “0”.
A secondary F_2_ population comprising 200 individuals, derived from a cross between Nipponbare and Z799, was used for preliminary QTL mapping. Based on the phenotypic evaluations and the preliminary QTL results, secondary segment substitution lines were subsequently developed in the following year.
Plant materials and cultivation
2.2
Hybridization stage (2021)
2.2.1
In July 2021, crosses between the recipient parent Nipponbare and Z799 were conducted at the Xiema Experimental Base of Southwest University to generate hybrid seeds. In September of the same year, these F_1_ hybrid seeds were planted at the Hainan Base to produce seeds for the F_2_ population.
Field experiments (2022-2024)
2.2.2
2022 Cycle: On March 10, seeds of the parental lines (Nipponbare, R225, Z799) and the F_2_ population were sown. On April 18, thirty seedlings per parental line and 200 F_2_ plants were transplanted using the spacing of 16.5 cm inter-row × 26.4 cm intra-row, with 10 plants per row.
2023 Cycle: On March 10, the seeds of parental lines and five F_2_-derived SSSLs candidates were sown. On April 18, thirty plants per line were transplanted using identical spacing.
2024 Cycle: On March 12, the seeds of parental lines and the developed five SSSLs (S1-S5) were sown. On April 20, thirty plants per line were transplanted with identical spacing.
All trials were managed following standard Chongqing regional agronomic practices to ensure experimental consistency across generations.
Evaluation of yield-related traits
2.3
At full maturity, 10 individuals were randomly sampled from the plots of Nipponbare, Z799 and SSSLs (S1-S5) respectively, along with 200 individual plants from the F_2_ population. Fourteen yield-related traits were investigated for the parental lines, F_2_ population according to the method described by Ma et al. (2019) and Wang et al. (2021). Plant height was measured as the distance from the top of the highest panicle to the field surface in meters for each plant. Panicle numbers, panicle length, number of primary branches, number of secondary branches, number of spikelets per panicle, number of grains per panicle, yield per plant were measured using all the effective panicles in the plant. The total length and width of 10 grains lined up were measured with a 20-cm ruler for three replications then used to calculate average per-grain values of each plant. Ratio of grain length-to-width was calculated as grain length divided by grain width. The 1000-grain weight of Nipponbare and Z799 was measured from random samples of 3000 grains, from which 1000-grain subsets were weighed on an electronic balance, with three repetitions. The 1000-grain weight of each F_2_ plant was determined as the weight of 200 grains, multiplied by 5, with three repetitions. The seed-setting rate was calculated as grains per panicle as a percentage of the number of spikelets per panicle. The seed setting density was determined as spikelet number per 10 cm of panicle length. The mean value, standard deviation, and relevant statistical analyses for each trait were calculated using Microsoft Excel 2016.
QTL mapping
2.4
Four weeks after transplanting, leaf samples were collected from individual F_2_ plants, Z799, Nipponbare, and secondary segment substitution lines. Genomic DNA was extracted via the CTAB method and used as a template for PCR amplification. Sixteen polymorphic SSR markers corresponding to the 10 substitution segments in Z799 were used as primers. PCR was performed in a 12.5 μL reaction mixture containing 1.25 μL of 10× PCR buffer, 0.65 μL of 25 mmol L^−1^ MgCl_2_, 0.5 μL of 2.5 mmol L^−1^ dNTPs, 8.0 μL of ddH_2_O, 1.0 μL of 10 μmol L^−1^ primers, 1.0 μL of template DNA, and 0.1 μL of 5 U μL^−1^ Taq DNA polymerase. The PCR protocol consisted of initial denaturation at 94 °C for 3 min, followed by 35 cycles of denaturation at 94 °C for 20 s, annealing at 56 °C for 20 s, and extension at 72 °C for 40 s, with a final extension at 72 °C for 7 min. The PCR products were separated by 10% native polyacrylamide gel electrophoresis (PAGE) and visualized by rapid silver staining. Banding patterns were scored as “1” for Z799 type, “-1” for Nipponbare type, “0” for heterozygous, and “.” for missing data. Based on phenotypic data from the 200 individual plants, QTL analysis was performed using the Mixed Linear Model (MLM) in SAS 9.3 (SAS Institute Inc., Cary, NC, USA). A significance threshold of P < 0.05 was applied for declaring the presence of a quantitative trait locus (QTL).
Development of single segment substitution lines
2.5
Based on the QTL mapping results, five F_3_ plants harboring only a single homozygous substituted segment and 0–1 heterozygous markers were selected from the F_2_ population using marker-assisted selection (MAS). These were then grown as individual lines. From each line, leaves of 20 plants were sampled for DNA extraction, and genotyping was performed using markers for the substitution segments and heterozygous markers. The scoring criteria were as follows: target substitution segment markers were scored as “1” (identical to Z799), and heterozygous markers were selected as “0” (identical to Nipponbare).
QTL identification and additive effect analysis in single segment substitution Lines
2.6
Since each SSSL differs from Nipponbare only in a single chromosomal segment, phenotypic differences can be attributed to the unique substitution segment. The genetic model was defined as follows: for Nipponbare, P_0_ = μ_0_+ϵ (where μ_0_ is the mean and ϵ is the error); for an SSSL, Pi = μ_0_ + a_i_ + ϵ (where a_i_ is the additive effect). Thus, QTL for yield traits in each SSSL were identified using a t-test: the null hypothesis (H_0_) stated that no QTL controlling the trait was present in the substituted segment of SSSLi, while the alternative hypothesis (H_1_) stated that a QTL was present. When P < 0.05, H_1_ was accepted, indicating the presence of a QTL for a specific trait in SSSLi. The additive effect a_i_ was estimated as half the difference between p_i_ and p_0_ (Li et al., 2022).
Cytological analysis of glume using scanning electron microscopy in SSSLs and Nipponbare
2.7
At the booting stage completion and prior to heading, 3 grains from the middle part of the main panicle of each plant were taken from the 3 plants per SSSL and Nipponbare. The inner and outer epidermal cells of the glume in Nipponbare and the five SSSLs (S1–S5) were examined using a Hitachi SU3500 scanning electron microscope (Hitachi, Tokyo, Japan) equipped with a freezing stage (–40 °C) under low-vacuum conditions.
Results and analysis
3
Identification of chromosomal substitution segments in Z799
3.1
Analysis of substitution segments and genetic background purity in 10 Z799 plants confirmed the accuracy of all 10 target segments and the absence of residual segments from donor line R225. The 10 substitution segments in Z799 were located on chromosomes 1, 3, 4, 7, 8, 9, 10, and 12, with a total length of was 30 Mb. The individual segments range from 0.8 Mb to 7.7 Mb in length, averaging 3.0 Mb (Figure 1).
Substitution segments in Z799 and detected QTL. The physical distance (Mb) and mapped QTL were marked at the left of each chromosome, and marker name with substitution lengths (indicated by black arrows) were on the right. Black regions represent the substitution fragment, while white region represents the genetic background of Nipponbare. Chromosomes not shown are identical to Nipponbare. Trait abbreviations in QTL names are as follows: PH, plant height; GL, grain length; NSB, number of secondary branches; NPB, number of primary branches; RLW, ratio of length to width; GWT, 1000- grain weight; GW, grain width; PL, panicle length; GPP, grain number per panicle; SPP: spikelet number per panicle; SSR, seed setting ratio; SSD, seed setting density.
Yield-related traits analysis of Z799 and Nipponbare
3.2
Compared to Nipponbare, the plant height (73.71 cm) of Z799 was significantly reduced by 16.34% (Nipponbare: 88.11 cm) (Figures 2A, E). The panicle length (18.00 cm) of Z799 was 5.61% shorter than that (19.07 cm) of Nipponbare (Figures 2B, L). In contrast, the grain length (8.72 mm) and grain width (3.45 mm) of Z799 were significantly increased by 16.89% and 0.58%, respectively, relative to Nipponbare (7.46 mm and 3.43 mm) (Figures 2C, D, G, H). The number of secondary branches (11.00) of Z799 was significantly decreased by 24.35% compared to that of Nipponbare (14.54) (Figure 2J); whereas the seed setting rate (91.76%) of Z799 was significantly increased by 12.37% relative to that of Nipponbare (81.66%) (Figure 2M).Conversely, the number of primary branches (13.88) and the length-to-width ratio (2.37) of Z799 were significantly higher than those of Nipponbare (9.23 and 2.17, respectively) (Figures 2I, K), corresponding to increases of 50.38% and 9.22%, respectively. Furthermore, 1000-grain weight of Z799 (24.41 g) was 5.30% greater than that (23.18 g) of Nipponbare (Figure 2F).
Analysis of yield-related traits in Nipponbare and Z799. (A–D) Plant type (A), panicle type (B), grain length (C) and grain width (D) of Nipponbare and Z799. (E–M) Statistical analysis of 9 traits between Nipponbare and Z799. (E) Plant height, (F) 1000-grain weight, (G) Grain length, (H) Grain width, (I) Number of primary branches number, (J) Number of secondary branches, (K) Ratio of length to width, (L) Panicle length, (M) Seed setting ratio. * and ** indicate significant differences between Nipponbare(Nip) and Z799 at the 0.05 and 0.01 levels using two-tail t-test, respectively.
QTL mapping for yield-related traits carried by substitution segments in Z799
3.3
Twenty-seven QTL controlling yield-related traits were identified using the secondary F_2_ population derived from Nipponbare/Z799. These QTL were distributed across five chromosomes: 1, 3, 7, 9, and 12. They comprised three for plant height (PH), two for panicle length(PL), four for the number of primary branches(NPB), four for the number of secondary branches(NSB), two for spikeletes per panicle(SPP), two for grains per panicle(GPP), three for seed-setting density(SSD), four for grain length(GL), two for the ratio of length to width(RLW), and one for 1000-grain weight(GWT). The phenotypic variation explained (PVE) by these QTL ranged from 2.23% to 17.45%, with six QTL (qPL1, qNPB1, qNPB7, qPH1-2, qSPP1, qSSD1-1) each exceeding 10%. On chromosome 1, seven QTL (qPH1-1, qPL1, qNPB1, qNSB1-1, qSPP1, qGPP1-1, qSSD1-1, qGL1-1) were closely linked to the marker RM8111. Their additive effects from the restorer line R225 were as follows: qPH1–1 increased plant height by 0.51 cm, qNPB1–1 increased the number of primary branches by 0.43, qPL1 increased panicle length by 1.59 cm, qNSB1–1 increased the number of secondary branches by 1.64, qSPP1 increased the total number of grains per panicle by 10.70, qGPP1–1 increased the number of filled grains per panicle by 5.88, and qGL1–1 increased grain length by 0.05 mm. Another six QTL (qPH1-2, qNSB1-2, qGPP1-2, qSSD1-2, qGL1-2, and qGWT1) were closely linked to the marker RM1268. The additive effects from R225 were: qPH1–2 decreased plant height by 2.96 cm, qNSB1–2 decreased the number of secondary branches by 1.37, qGPP1–2 decreased the number of grains per panicle by 4.63, qSSD1–2 decreased grains number per 10 cm panicle length by 1.96, qGL1–2 increased grain length by 0.10 mm, and qGWT1 increased thousand-grain weight by 0.39 g. On chromosome 3, qGL3 and qRLW3 were closely linked to the marker RM5928. The additive effects from R225 were: qGL3 increased grain length by 0.05 mm, and qRLW3 increased the length-to-width ratio by 0.02. On chromosome 7, four QTL (qNPB7, qPH7, qSPP7, and qSSD7) were closely linked to the marker RM172. The additive effects from R225 were: qNPB7 increased the number of primary branches by 0.36, qPH7 increased plant height by 1.60 cm, qSPP7 increased the spikelets per panicle by 5.34, and qSSD7 increased grains per 10 cm panicle length by 2.02. On chromosome 12, four QTL (qPL12, qNSB12-1, qGL12, and qRLW12) were closely linked to the marker RM27819. The additive effects from R225 were: qPL12 decreased plant height by 0.47 cm, qNSB12–1 decreased the number of secondary branches by 1.19, qGL12 increased grain length by 0.06 mm, and qRLW12 increased ratio of length-to-width by 0.02.Additionally, two QTL (qNPB12 and qNSB12-2) were linked to the second substitution segment marker RM519, with additive effects from R225 of increasing primary branches by 0.31 and increasing secondary branches by 1.71, respectively (Table 1).
In addition, we also found that some QTL were always detected in cluster. For example, qPL1, qNPB1, qNSB1-1, qPH1-1, qSPP1, qGPP1-1, qSSD1–1 and qGL1 linked to the same marker, so was qPL12, qNSB12–1 and qGL12, as well as qNPB7, qPH7, qSPP7 and qSSD7. etc. Whether these traits correlated? We analyzed the Pearson correlation coefficient for 14 yield-related traits in the F_2_ population by IBM SPSS25.0 statistical software (Table 2). The 1000-grain weight (GWT) was significantly negatively correlated with panicle number (PN) (r = −0.191) but positively correlated with grain width (GW) (r = 0.283). Yield per plant (YD) showed strong positive correlations with both panicle number (PN) (r = 0.604) and plant height (PH) (r = 0.200). The number of primary branches per panicle (NPB) was positively correlated with panicle length (PL) (r = 0.323), while the number of secondary branches (NSB) was positively correlated with both NPB (r = 0.210) and PL (r = 0.213). Spikelets per panicle (SPP) exhibited strong positive correlations with grains per plant (GPP) (r = 0.764) and NSB (r = 0.217). Seed setting rate (SSR) was significantly positively correlated with GPP (r = 0.580) and SPP (r = 0.453). The ratio of grain length-to-width (RLW) showed a significant positive correlation with grain length (GL) (r = 0.314), but negative correlations with grain width (GW) (r = −0.412) and 1000-grain weight (GWT) (r = −0.193). Seed setting density (SSD) was significantly positively correlated with GPP (r = 0.610), SPP (r = 0.773), and SSR (r = 0.320) (Table 2). These correlation patterns suggest pleiotropic effects among certain QTL clusters. Specifically, qPL1, qNPB1, qNSB1-1, qSPP1, qGPP1-1, and qSSD1–1 appear to represent a pleiotropic region, whereas qGL1 and qPH1–1 should be only loosely associated with this group. Similarly, qNPB7, qPH7, qSPP7, and qSSD7 likely share pleiotropic effects. Additionally, qPL12 and qNSB12–1 appear to be pleiotropic, while qGL12 should be only weakly linked.
Development of single segment substitution lines from Z799
3.4
Based on the QTL mapping results, five single segment substitution lines (S1–S5) were. further developed. Among them, S1 and S2 harbored substitution segments on Chromosome 1 and 3, respectively, while S3, S4 and S5 all carried substitution segments on Chromosome 12. Detailed substitution information was provided in Figure 3.
QTL distribution in secondary single segment substitution lines (S1-S5). S1(Chr.1: RM151--RM8111--RM1201); S2(Chr.3: RM5928--RM6881--RM15315); S3(Chr.12: RM7119--RM27819--RM101); S4(Chr.12: RM1246--RM519--RM6869); S5(Chr.12: RM519--RM1986--RM6869). GL, Grain length; PL, Panicle length; PH, Plant height; NPB, Number of primary branches; NSB, Number of secondary branches; SPP, Spikelet number per panicle; GWT, 1000- grain weight; RLW, Ratio of the length to width; GPP, Grain number per panicle; SSD, Seed setting density; SSR, Seed setting rate.
Additive effect analysis and detection of QTL for yield traits in developed SSSLs (S1-S5)
3.5
A total of 35 QTL for yield-related traits were identified in the single segment substitution lines S1–S5, including five for grain length, three for spikelets per panicle, three for grains per panicle, five for ratio of length-to-width, three for 1000-grain weight, four for number of primary branches, three for number of secondary branches, three for seed-setting density, two for yield per plant, two for plant height, and two for panicle length. Among them, 15 QTL (qPL1, qNPB1, qNPB12-2, qPH1, qNSB1, qNSB12, qSPP1, qGPP1, qSDD1, qGL1, qGL12-1, qGL3, qRLW3, qRLW12-1, qGWT1) were also detected in the aforementioned F_2_ population, indicating stable inheritance across years. The remaining 18 QTL (qGL12-2, qSPP3, qSPP12, qGPP3, qGPP12, qRLW1, qRLW12-2, qGWT3, qGWT12, qNPB3, qNPB12-1, qNSB3, qSDD3, qSDD12, qYD3, qYD12, qPH12, qPL12) were detected only in the SSSLs (Figure 3, Figures 4A–L), demonstrating higher QTL detection efficiency of SSSLs compared to the F_2_ population.
Additive effect analysis of QTL for yield –related traits in S1-S5. (A–L) the identification and additive effects of QTL for different yield-related traits carried by SSSLs(S1–S5). (A) Grain length; (B) Grain width; (C) Ratio of length-to-width; (D) 1000-grain weight; (E) Number of primary branches; (F) Number of secondary branches; (G) Spikelet number per panicle; (H) Grain number per panicle; (I) Seed-setting density; (J) Yield per plant; (K) Plant height; (L) Panicle length. The bottom lowercase letters above the column indicate the Duncan’s multiple comparison results (P < 0.05). μ: Mean trait value of each line, ai: additive effect of QTL. p < 0.05 in SSSL indicates a significant QTL identified within the substitution segment of the SSSL; p > 0.05 indicates no QTL existed in the SSSLi. S1(Chr.1: RM151--RM8111--RM1201); S2(Chr.3: RM5928--RM6881--RM15315); S3(Chr.12: RM7119--RM27819--RM101); S4(Chr.12: RM1246--RM519--RM6869); S5(Chr.12: RM519--RM1986--RM6869).
The grain length of QTL–carrying SSSLs S1–S5 (qGL1, qGL3, qGL12-1, qGL12-2, qGL12-3,with additive effects of 0.22, 0.27, 0.17, 0.24 and 0.35 mm, respectively) was significantly greater (7.77, 7.86, 7.66, 7.80, and 8.01 mm) than that (7.33 mm) of Nipponbare (Figure 4A). In contrast, grain width did not differ between these SSSLs (3.58, 3.53, 3.54, 3.52 and 3.56 mm), and Nipponbare (3.54 mm) (Figure 4B). The ratio of grain length-to-width was significantly higher in S1–S5 (carrying qRLW1, qRLW3, qRLW12-1, qRLW12-2, and qRLW12-3, with additive effects of 0.05, 0.09, 0.05, 0.08, and 0.09, respectively) compared to Nipponbare (2.17, 2.25, 2.16, 2.22, and 2.25 vs. 2.07; Figure 4C).
1000-grain weight was significantly increased in S1 (carrying qGWT1, a=1.27 g; 26.00 g) and S2 (carrying qGWT3, a=0.11 g; 24.85 g) relative to Nipponbare (23.46 g), whereas S3–S5, which lack 1000-grain weight QTL, showed no significant difference (22.77, 23.00, and 23.00 g; Figure 4D). For number of primary branches, S1 (qNPB1, a=0.90), S3 (qNPB12-1, a=0.65), and S4 (qNPB12-2, a=1.40) had significantly more branches (12.00, 11.50, and 13.00) than Nipponbare (10.21), while S2 (qNPB3, a=-0.34) had significantly fewer (9.52) and S5 (no QTL) showed no difference (9.81; Figure 4E). Number of secondary branches was significantly higher in S1 (qNSB1, a=2.67), S2 (qNSB3, a=3.80), S4 (qNSB12-1, a=4.51), and S5 (qNSB12-2, a=1.45) compared to Nipponbare (21.00, 23.25, 24.76, and 18.55 vs. 15.65), with no difference observed in S3 (14.68; Figure 4F). Spikelets per panicle were significantly increased in S1 (qSPP1, a=22.06), S2 (qSPP3, a=9.78), S4 (qSPP12-1, a=11.22), and S5 (qSPP12-2, a=26.33) relative to Nipponbare (146.00, 121.00, 124.31, and 154.55 vs. 101.88), while S3 showed no significant difference (121.00; Figure 4G). Similarly, Grains per panicle were significantly greater in S1 (qGPP1, a=20.20), S2 (qGPP3, a=8.65), S4 (qGPP12-1, a=13.54), and S5 (qGPP12-2, a=27.19) than in Nipponbare (133.33, 110.24, 96.56, and 154.55 vs. 101.88), with no significant difference in S3 (121.00; Figure 4H). Spikelets density per 10 cm panicle was also significantly higher in S1 (qSSD1, a=9.64), S2 (qSSD3, a=5.68), S4 (qSSD12-1, a=6.66), and S5 (qSSD12-2, a=12.16) compared to Nipponbare (69.23, 61.31, 63.26, and 74.27 vs. 49.94), whereas S3 did not differ (51.29; Figure 4I).
Yield per plant was significantly higher in S2 (qYD3, a=5.04 g; 28.90 g) and S4 (qYD12, a=4.24 g; 27.30 g) than in Nipponbare (18.82 g), while S1, S3, and S5 (lacking yield QTL) showed no significant difference (23.10, 25.47, and 17.60 g; Figure 4J). Plant height was significantly increased in S1 (qPH1, a=5.05 cm), S4 (qPH12-1, a=5.55 cm), and S5 (qPH12-2, a=3.50 cm) relative to Nipponbare (103.00, 104.00, and 99.88 cm vs. 92.90 cm), with no difference in S2 and S3 (94.50 and 93.93 cm; Figure 4K). Finally, panicle length was significantly longer in S1 (qPL1, a=1.32 cm) and S4 (qPL12, a=1.82 cm) than in Nipponbare (23.00 and 24.00 cm vs. 20.37 cm), while S2, S3, and S5 (lacking panicle length QTL) did not differ significantly (19.90, 20.98, and 20.82 cm; Figure 4L).
Cytological analysis of glume cells in SSSLs (S1-S5) carrying different QTL for grain size
3.6
Grain length was significantly increased in five single-segment substitution lines (SSSLs)—S1 (qGL1, a=0.22), S2 (qGL3, a=0.27), S3 (qGL12-1, a=0.17), S4 (qGL12-2, a=0.24), and S5 (qGL12-3, a=0.35)—compared to the recipient parent Nipponbare. None of these lines carry grain-width QTL, and their grain width did not differ significantly from Nipponbare (Figures 5A–F). To investigate the cytological basis of the grain-length increase conferred by these QTL, we examined glume cell morphology in the five SSSLs and Nipponbare using scanning electron microscopy (Figures 5G–L). The average longitudinal cell number in the lemma was significantly higher in S1–S4 (91, 95, 85, and 91, respectively) than in Nipponbare (74), corresponding to increases of 23%, 29%, 14%, and 23%. In contrast, S5 (73) showed no significant difference from Nipponbare (Figure 5N). Measurements of lemma epidermal cell length using Image J revealed that cell length in S5 (102.97 µm) was significantly greater—by 19%—than in Nipponbare (86.84 µm). By contrast, cell lengths in S1–S4 (80.19, 80.41, 83.26, and 80.88 µm, respectively) did not differ significantly from Nipponbare (Figure 5M). These results indicate that the increased grain length in S1–S4 results from a higher cell number, whereas in S5 it is due to enhanced longitudinal cell expansion. This suggests that qGL1, qGL3, qGL12-1, and qGL12–2 may regulate cell division, while qGL12–3 likely influences cell expansion. No significant differences were observed in lemma epidermal cell width among S1–S5 (73.26, 71.73, 69.27, 65.05, and 73.13 µm, respectively) and Nipponbare (67.32 µm) (Figure 5O). Similarly, transverse cell numbers did not differ significantly between the SSSLs (45, 48, 48, 52, and 44, respectively) and Nipponbare (47) (Figure 5P), indicating no transverse cell expansion in the SSSL grains relative to Nipponbare.
Scanning electron microscope observation and analysis of hulls of S1-S5. (A–P) Scanning electron microscopy images of grain (A–E) and outer epidermis (G–L), (M) Average cell length of outer epidermis, (N) Mean longitudinal cell number of outer epidermis, (O) Average cell width of outer epidermis, P: Average lateral cell number of outer epidermis, P < 0.05 indicates significant difference between Japanese sunny and S1-S5 in the two-tailed t test.
Discussion
4
Single segment substitution lines (S1-S5) (Derived from CSSL-Z799)are a valuable resource for molecular-designed rice breeding
4.1
With advances in molecular marker-assisted selection (MAS) breeding, Chromosome Segment Substitution Lines (CSSLs) are now widely applied in various crops such as rice, rapeseed, maize, and wheat. Through hybridization and MAS, desirable traits from different CSSLs can be pyramided into a single variety rapidly and accurately. Zhang (2021), for instance, established a library of rice SSSLs and used it to successfully design and breed four new rice varieties that met predetermined specifications.
In this study, we develop a CSSL designated Z799, which carries 10 substitution segments from the donor restorer line R225 in the genetic background of the recipient parent Nipponbare. Through QTL analysis of a Nipponbare/Z799 F_2_ population and subsequent MAS, we developed five SSSLs (S1-S5), each harboring key QTL for yield-related traits. These SSSLs not only validated 15 QTL previously detected in the F_2_ population — including qPL1, qNPB1, qNPB12-2, qPH1, qNSB1, qNSB12, qSPP1, qGPP1, qSDD1, qGL1, qGL12-1, qGL3, qRLW3, qRLW12-1, qGWT1—but also uncovered 18 novel QTL (qGL12-2, qSPP3, qSPP12, qGPP3, qGPP12, qRLW1, qRLW12-2, qGWT3, qGWT12, qNPB3, qNPB12-1, qNSB3, qSDD3, qSDD12, qYD3, qYD12, qPH12, qPL12). This demonstrated that SSSLs offer superior QTL detection efficiency compared to F_2_ populations, significantly improving mapping accuracy while enriching the genetic resources available for rice breeding. Phenotypic evaluation revealed significant trait improvements across the SSSLs. For example, grain length increased significantly in all five SSSLs compared to Nipponbare (7.33 mm), reaching up to 8.01 mm in S5. Similarly, ratio of grain length-to-width, thousand-grain weight, panicle branch number, spikelets per panicle, and yield per plant were notably enhanced in specific SSSLs. Detailed trait measurements for each line are summarized in Figures 4A–L. In conclusion, the five SSSLs derived from Z799 all harbor favorable QTL for yield-related traits. They provide a robust foundation for future fine-mapping, map-based cloning, and functional studies of these QTL, while also serving as practical breeding resources for designed high-yield breeding in japonica rice-growing regions.
Comparison of QTL carried by Z799 with previously reported genes
4.2
Through QTL analysis of the Nipponbare/Z799 F_2_ population and the subsequently developed SSSLs, we identified 33 QTL associated with yield-related traits in rice and compared them with previously reported genes in corresponding intervals.
On chromosome 1, qGL1, qPL1, qPH1, qNPB1, qNSB1, qSPP1, qGWT1, qRLW1, qGPP1, and qSSD1 are all linked to the molecular marker RM8111 (6.27 Mb). Within this interval, we selected two potential candidate genes, SDG721 and OsFTL1, located approximately 0.23 Mb and 0.22 Mb from this marker, respectively. The mutant sdg721 exhibits gibberellin-deficient phenotypes compared to the wild type, including semi-dwarfism, shortened cell length, and reduced number of secondary branches and grains per panicle (Jiang et al., 2018), making it a potential candidate gene for qNSB1 and qGPP1. FT-L1 encodes a florigen-like protein that promotes flowering in rice. The transport of florigens Hd3a and RFT1 to the shoot apical meristem activates FT-L1. The gene enhances the effects of Hd3a and RFT1 during the transition of the vegetative meristem to the inflorescence meristem and organizes panicle branching by increasing the determinacy of distal meristems, thereby affecting primary branch number and panicle length (Giaume et al., 2023), suggesting it as a candidate for qNPB1 and qPL1.
On chromosome 3, QTL (qGL3, qNPB3, qNSB3, qSPP3, qGWT3, qRLW3, qGPP3, qSSD3, qYD3) are linked to the molecular marker RM5928 (12.55 Mb). Three potential candidate genes—OsSUS4, OsFUG1, and ACE1— were screened in the region, located approximately 1.62 Mb, 0.25 Mb, and 0.35 Mb from this marker, respectively. Overexpression of OsSUS4 significantly increased the thousand-grain weight and yield per plant in transgenic plants, with no significant differences in tiller number per plant, seeds per panicle, or seed setting rate (Fan et al., 2019), suggesting it is a potential candidate for qGWT3 and qYD3. The OsFUG1 knockout mutant fug1 showed dwarfism, defects in fertility, grain weight, and panicle morphology (Rosa et al., 2018), indicating it as a potential candidate for qYD3 and qNSB3. ACE1 may be involved in GA signaling (Han et al., 2005). It encodes a protein of unknown function whose expression confers the capacity for cell division in the intercalary meristem zone, promoting internode elongation in the presence of gibberellin and increased grain length (Bailey-Serres and Voesenek, 2020), making it a candidate for qGL3.
On chromosome 12, QTL (qGL12-1, qNPB12-1, qGWT12, qRLW12) are linked to the molecular marker RM27819 (7.6 Mb). Within this interval, we identified OsAK3 as a candidate gene. OsAK3 encodes an adenylate kinase that regulates grain size by controlling cell growth in the spikelet hull. Compared to the wild type Dongjin (DJ), the osak3 mutant has fewer tillers, exhibits dwarfism and shortened internodes but increased internode number, and shows significantly reduced grain length, grain width, and thousand-grain weight, along with lower sensitivity to exogenous Brassinolide (BL) treatment. Overexpression of OsAK3 increased grain length. Cytological observation revealed that lemma cell length and width were significantly reduced in osak3, while cell number increased, indicating that OsAK3 modulates grain size by regulating cell growth (Zhang et al., 2021), supporting its candidacy for qGL12-1.
In another interval on the same chromosome, QTL (qGL12-2, qPL12, qPH12, qNPB12-2, qNSB12, qSPP12, qRLW12-2, qGPP12, qSSD12, qYD12) are linked to the molecular marker RM519 (20.0 Mb). Two candidate genes, qTGW12a and GNP12, were identified approximately 0.35 Mb and 1.23 Mb from this marker, respectively. Knockout of qTGW12a (LOC_Os12g36660) in ZH11 resulted in significantly narrower grains and reduced grain weight compared to the wild type (Du et al., 2021), suggesting it as a potential candidate for qYD12. GNP12 positively regulates panicle development in rice by modulating Cytokinin levels. Compared to the wild type Ce253, panicle length, grain number per panicle, grain length, and seed setting rate were decreased in the relevant materials (Pan et al., 2022), indicating its potential role in qPL12, qGL12-2, qSSD12, qGPP12, and qSPP12.
The limitation of the work is lack of assured candidate gene for each QTL. Future work will focus on fine-mapping to narrow down the identified QTL intervals, refining the candidate gene list, and combining sequencing of relevant candidates with complementation tests to validate the accuracy of the inferred candidate genes.
The reference list from the paper itself. Each links out to its DOI / PubMed record.
- 1Abbas W. Shalmain A. Zhang J. Sun Q. Zhang C. Li W. . (2024). The GW 5-WRKY 53-SGW 5 module regulates grain size variation in rice. New Phytol. 242, 2011–2025. doi: 10.1111/nph.19704, PMID: 38519445 · doi ↗ · pubmed ↗
- 2Bailey-Serres J. Voesenek L. (2020). Genetic drivers of high-rise rice that survives deep floods. Nature 584, 44–45. doi: 10.1038/d 41586-020-02059-0, PMID: 32669726 · doi ↗ · pubmed ↗
- 3Chu H. Qian Q. Liang W. Yin C. Tan H. Yao X. . (2006). The floral organ number 4 gene encoding a putative ortholog of Arabidopsis CLAVATA 3 regulates apical meristem size in rice. Plant Physiol. 142, 1039–1052. doi: 10.1104/pp.106.086736, PMID: 17012407 PMC 1630730 · doi ↗ · pubmed ↗
- 4Du Z. Huang Z. Li J. Bao J. Tu H. Zeng C. . (2021). q TGW 12a, a naturally varying QTL, regulates grain weight in rice. Theor. Appl. Genet. 134, 2767–2776. doi: 10.1007/s 00122-021-03857-4, PMID: 34021769 PMC 8354980 · doi ↗ · pubmed ↗
- 5Duan P. Rao Y. Zeng D. Zhang B. Li Y. Li C. . (2014). SMALL GRAIN 1, which encodes a mitogen-activated protein kinase kinase 4, influences grain size in rice. Plant J. 77, 547–557. doi: 10.1111/tpj.12405, PMID: 24320692 · doi ↗ · pubmed ↗
- 6Fan C. Wang G. Wang Y. Zhang C. Li X. Zhang J. . (2019). Sucrose synthase enhances hull size and grain weight by regulating cell division and starch accumulation in transgenic rice. Int. J. Mol. Sci. 20. doi: 10.3390/ijms 20204971, PMID: 31600873 PMC 6829484 · doi ↗ · pubmed ↗
- 7Giaume F. Bono G. A. Martignago D. Fornara F . (2023). Two florigens and a florigen-like protein form a triple regulatory module at the shoot apical meristem to promote reproductive transitions in rice. Nat. Plants 9, 525–534. doi: 10.1038/s 41477-023-01383-3, PMID: 36973415 · doi ↗ · pubmed ↗
- 8Gross B. L. Zhao Z. (2014). Archaeological and genetic insights into the origins of domesticated rice. Proc. Natl. Acad. Sci. U.S.A. 111, 6190–6197. doi: 10.1073/pnas.1308942110, PMID: 24753573 PMC 4035933 · doi ↗ · pubmed ↗