What characterizes the exceptional cognition of superagers? A systematic review of multidomain biomarkers of successful cognitive aging
Yiru Yang, Xiaolei Li, Shudan Gao, Yuanxu Gao

TL;DR
This review explores what makes some older adults maintain exceptional cognitive function by analyzing various biological markers linked to successful cognitive aging.
Contribution
The study systematically categorizes and integrates multidomain biomarkers associated with successful cognitive aging for the first time.
Findings
Successful cognitive aging is linked to multidomain biological mechanisms, not just resistance to aging-related brain changes.
Key biomarkers include young DNA methylation age, high von Economo neuron density, and efficient glucose metabolism.
Neuroimaging highlights a specific brain network involving the cingulate gyrus, medial temporal lobe, and frontal cortex.
Abstract
Substantial heterogeneity in cognitive aging trajectories has been observed among older adults, with some individuals maintaining exceptional cognitive function (“superagers” or “successful cognitive aging [SCA]”). The biological mechanisms underlying SCA remain unclear. This systematic review synthesizes current evidence on quantifiable SCA biomarkers to address this critical gap. Following the Preferred Reporting Items for Systematic Reviews and Meta-Analyses guidelines, we systematically searched PubMed, Scopus, PsycINFO, and Web of Science (up to December 2024). After screening 6,699 records, 62 studies met the inclusion criteria. Data from included studies were extracted, assessed for risk of bias, and synthesized for integrated findings. We identified 34 SCA definitions, categorized them into three types, and analyzed biomarkers across six domains: (1) genetic/epigenetic…
Genes, proteins, chemicals, diseases, species, mutations and cell lines named across the full text — each resolved to its canonical identifier and authoritative record.
Click any figure to enlarge with its caption.
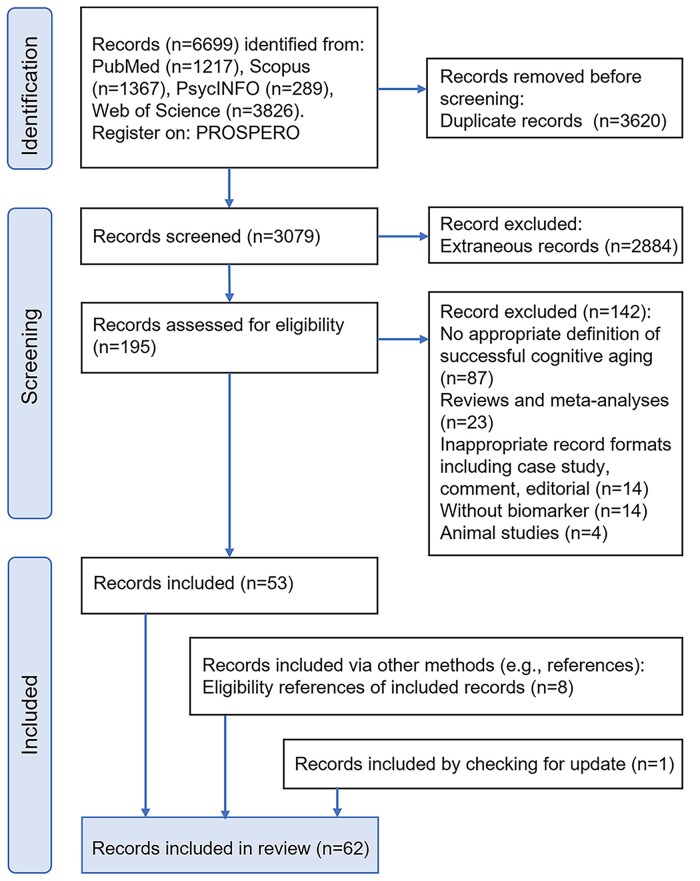 Figure 1
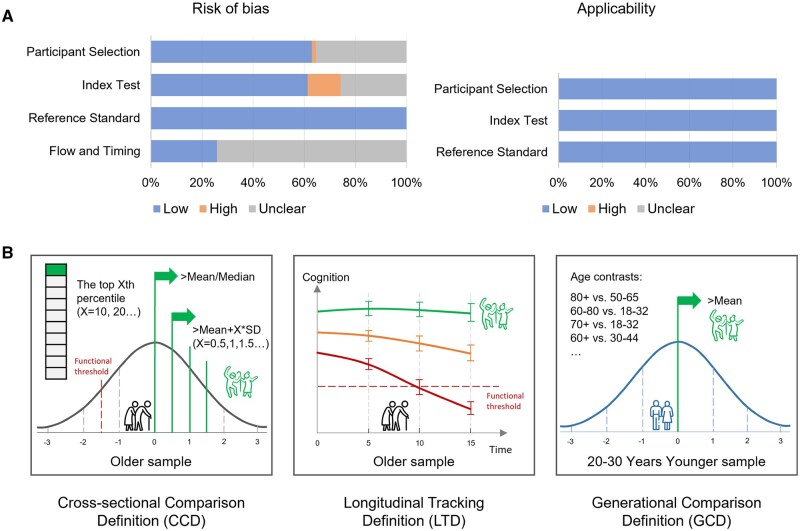 Figure 2
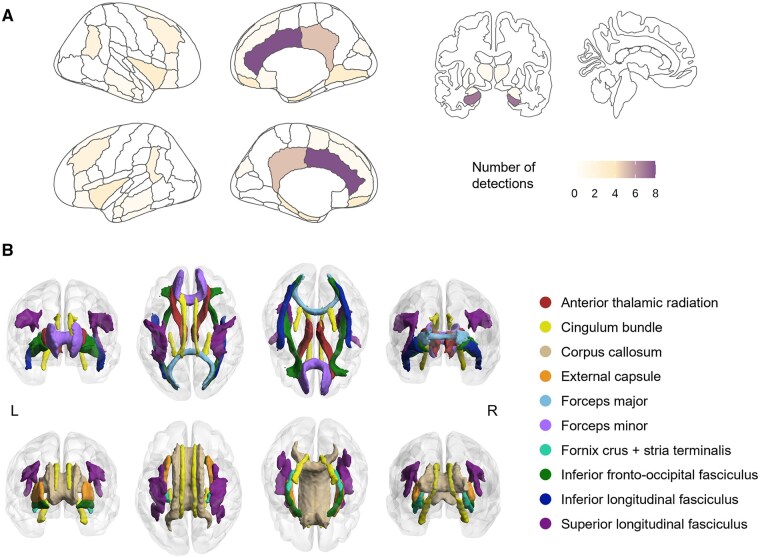 Figure 3
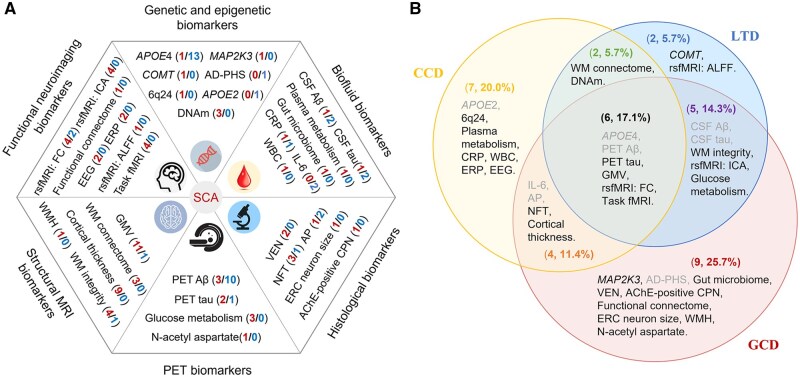 Figure 4
| Publications | Thresholds | Definitions |
|---|---|---|
|
| ||
|
| Median score |
|
|
| The 67th percentile |
|
|
| Mean + 0.5 |
|
|
| The 10th percentile |
|
|
| Mean + 1.5 |
|
|
| Mean ± 1.35 |
|
|
| The 20th percentile |
|
|
| Mean |
|
|
| The 50th percentile |
|
|
| Mean + 1 |
|
|
| Mean + 1.5 |
|
|
| Median score |
|
|
| Mean + 1.5 |
|
|
| MMSE > 28 |
|
|
| ||
|
| Slope > 0; 9 years |
|
|
| LC; 15 years |
|
|
| Mean + 1.5 |
|
|
| LC; 5 years |
|
|
| Normal; 5 years |
|
|
| LC, 4 years |
|
|
| LC, 8 years |
|
|
| Slope |
|
|
| ||
|
| 80+ |
|
|
| 60–80 |
|
|
| 60–80 |
|
|
| 70+ |
|
|
| 60+ |
|
|
| 60+ |
|
|
| 70+ |
|
|
| 70+ |
|
|
| 70–85 |
|
|
| 65+ |
|
|
| 60+ |
|
|
| ||
|
| Bottom 20% of cognitive age, top 20% of cognitive performance; 70+ | 70+ years old, four types of definitions: (1) |
| Biomarkers | Main findings | Definition types | Publications |
|---|---|---|---|
|
| |||
|
| (+) | LTD |
|
| (−) SCA and NCA groups had no differences in | CCD, LTD, GCD |
| |
|
| (−) SCA and NCA groups had no differences in | CCD |
|
|
| (+) | LTD |
|
|
| (+) SCA was linked to the 6q24 region, including SNP rs6902875. | CCD |
|
|
| (+) SCA was associated with variants in the | GCD |
|
|
| (−) There was no significant difference in the Alzheimer’s disease (AD)-PHS between Superagers and cognitively normal controls. | GCD |
|
|
| (+) SCA individuals had a younger delta age (DNA methylation age minus chronological age) compared with average or accelerated decliners. | LTD |
|
| (+) The SCA group showed significantly delayed intrinsic and extrinsic EAA than the NCA group. | CCD |
| |
| (+) | CCD |
| |
|
| |||
|
| (+) Aβ1-42+ were more likely to be in low stable agers compared to successful agers. | LTD |
|
| (−) No between-group difference was found in CSF Aβ. | LTD, GCD |
| |
|
| (+) Individuals with t-tau+ were more likely to appear in declining agers compared to successful agers. | LTD |
|
| (−) No between-group difference was found in CSF tau. | LTD, GCD |
| |
|
| (+) A significant differential abundance of 12 metabolites was found in those with SCA relative to controls. | CCD |
|
|
| (+) Higher CRP in cognitively intact probands was associated with a lower risk of dementia in relatives. | CCD |
|
| (−) No between-group difference was found in CRP. | CCD |
| |
|
| (+) Participants from SCA families had a higher monocyte count at baseline. | CCD |
|
|
| (−) No between-group difference was found in IL-6. | CCD, GCD |
|
|
| (+) Significant microbiome features for distinguishing superagers included Alistipes, PAC001137_g, PAC001138_g, Leuconostoc, and PAC001115_g. | GCD |
|
|
| |||
|
| (+) Superagers showed a lower frequency of AP than controls. | GCD |
|
| (−) There were no significant differences in AP density. | CCD, GCD |
| |
|
| (+) Superagers showed a lower frequency of NFT than controls, especially in ERC, where controls had about threefold NFTs than superagers. | GCD |
|
| (−) There were no significant differences in NFT density. | CCD |
| |
|
| (+) Superagers showed a higher density of VENs than controls, especially in the cingulate regions. | GCD |
|
|
| (+) Superagers had a larger soma size of layer II ERC neurons compared with controls. | GCD |
|
|
| (+) Superagers showed a significantly lower density of AChE-positive cortical pyramidal neurons when compared with same-age peers. | GCD |
|
|
| |||
|
| (+) Superagers had a lower percentage of Aβ-positive or less Aβ burden compared to controls in specific regions, such as the cingulate cortex. | LTD |
|
| (−) Superagers showed no difference in Aβ deposition compared with controls. | CCD, LTD, GCD |
| |
|
| (+) Superagers had lower tau deposition compared with controls, especially in the ERC. | CCD, LTD, GCD |
|
| (−) Superagers showed no difference in tau deposition compared with controls. | CCD |
| |
|
| (+) Superagers had higher glucose metabolism than controls in multiple regions, especially in the cingulate cortex. | LTD, GCD |
|
|
| (+) There was a higher total | GCD |
|
|
| |||
|
| (+) Superagers had greater cortical thickness in multiple regions than same-age controls and even had similar cortical thickness with young controls, especially in the cingulate cortex, prefrontal cortex, etc. (Please refer to | CCD, GCD |
|
|
| (+) Superagers had greater GMV than controls in multiple regions, including the medial temporal area, cingulate cortex, middle frontal cortex, etc. (Please refer to | CCD, LTD, GCD |
|
| (−) Successful older adults had smaller GMVs in the bilateral hippocampus and right parahippocampal gyrus than average older adults. | LTD |
| |
|
| (+) Superagers had lower WMH volumes than controls. | GCD |
|
|
| (+) Superagers had higher FA and lower MD, RD, and AD than controls in multiple fibers, including the cingulum bundle, the corpus callosum, etc. (Please refer to | LTD, GCD |
|
| (−) There were no significant between-group differences in FA values. | LTD |
| |
|
| (+) Superagers had stronger WM connections and greater efficiency among multiple regions, and a unique structural connectome remains stable over time in superagers relative to controls. | CCD, LTD |
|
|
| |||
|
| (+) Superagers generate a larger P3 response detected by ERP to novel relative to standard stimuli than controls. | CCD |
|
|
| (+) Superagers showed high temporal complexity of EEG signals on a slower time scale in the frontal, parietal, and temporal lobes. | CCD |
|
| (+) Superagers had a high betweenness centrality in the frontal region in the functional network of resting-state EEG signals. | CCD |
| |
|
| (+) Superagers had significantly stronger or weaker FCs between the cingulate cortex and multiple regions, stronger FCs within DMN and SN, and stronger FCs of basal forebrain with putamen and insular cortex. | CCD, LTD, GCD |
|
| (−) Superagers do not demonstrate significantly stronger FC within DMN or SN. | GCD |
| |
| (−) Within- and between-network FCs and segregation measurements of seven large-scale networks were not the differentiators between superagers and controls. | GCD |
| |
|
| (+) A “Supernormal map” that differentiated superagers from controls was identified, including the right FFG, right MFG, right anterior CC, left MTG, etc. | LTD |
|
|
| (+) Superagers had increased FC of the right superior frontal gyrus with the independent component 6 than controls. | GCD |
|
| (+) The DMN, SN, and language networks differentiated superagers and controls. | GCD |
| |
| (+) Superagers had the lowest FC and possessed enhanced neural processing efficiency. | LTD |
| |
| (+) The SCA group had enhanced resting-state network connectivity strength in the left FPN, the anterior DMN, and the basal ganglia network. | GCD |
| |
|
| (+) A functional connectome was identified, and the most discriminative nodes for predicting superagers include the precuneus, posterior CC, insular cortex, and superior, middle, and inferior frontal gyrus. | GCD |
|
|
| (+) Superagers showed more BOLD activation in the cingulate region than decliners. | CCD |
|
| (+) Superagers had higher BOLD signals during encoding than average older adults, notably in the bilateral prefrontal cortex and the left hippocampus. | LTD |
| |
| (+) Superagers exhibited greater neural differentiation and neural reinstatement compared with controls. | GCD |
| |
| (+) Superagers exhibited higher subsequent memory effects and showed additional recruitment in prefrontal clusters than controls. | LTD |
| |
- —National Natural Science Foundation of China10.13039/501100001809
- —Shandong Provincial Natural Science Foundation10.13039/501100007129
Peer Reviews
No public reviews on file for this paper yet. If you reviewed it on a platform where reviews are public (OpenReview, ICLR, NeurIPS, ICML), you can paste yours below so the community can read it here.
Videos
No videos yet. Explain this paper in a talk, walkthrough, or lecture? Add one.
Taxonomy
TopicsDementia and Cognitive Impairment Research · Alzheimer's disease research and treatments · Genetics, Aging, and Longevity in Model Organisms
The aging population is rapidly increasing worldwide, posing significant challenges to public health and social services (Dogra et al., 2022), particularly due to presently incurable age-related cognitive impairments like Alzheimer’s disease (AD) (Scheltens et al., 2021). While cognitive decline resulting in cognitive impairment was once considered inevitable, research now highlights substantial heterogeneity in cognitive aging trajectories (Lindenberger, 2014; Nyberg et al., 2020). Notably, some older adults maintain exceptional cognitive function, termed “superagers” or “successful cognitive aging (SCA)” (Harrison et al., 2012; Krivanek et al., 2021). Beyond preventing cognitive disease, achieving graceful aging and high-quality longevity is a social priority, driving scientific interest in SCA’s underlying mechanisms (Nyberg & Pudas, 2019).
Biomarker research has provided comprehensive insights into the biological underpinnings of cognitive aging, especially pathological cognitive aging, for cognitive disease diagnosis and treatment (Jack et al., 2024; Scheltens et al., 2021). Despite genetic, histological, and biochemical analyses of biofluids or in vitro tissue samples, advancements in neuroimaging techniques, including magnetic resonance imaging (MRI), electroencephalography, event-related potential (ERP), and positron emission tomography (PET), etc., have particularly revolutionized our understanding of brain aging and serve as powerful tools for discovering biomarkers. Various approaches have been employed to explore the distinct biological characteristics of SCA, aiming at identifying reliable biomarkers (de Godoy et al., 2021a). These biomarkers could not only potentially serve as early indicators of the cognitive trajectory for targeted cognitive enhancement (Lindenberger, 2014) but also inform new strategies against age-related cognitive impairment (Mapstone et al., 2017; Santangelo et al., 2022).
Despite the growing attention in this field, several crucial issues remain unsolved. First, a consensus definition of SCA is not available, resulting in difficulty in taking full advantage of biomarkers for group identification. Much more work is needed to establish the biological criteria of SCA individuals, similar to the AT(N) system of AD (Jack et al., 2024). A systematic review of existing definitions and biomarkers is a critical first step. Second, it is unknown whether SCA reflects resistance to pathology or unique preservation mechanisms. Some studies associate SCA with lower tau pathology and reduced risk of conversion to cognitive impairment (Dang et al., 2019a; Gefen et al., 2021), while others highlight distinct neural signatures of successful and pathological cognitive aging (Arenaza-Urquijo et al., 2019; Yang et al., 2022). Third, most existing SCA reviews focus on definitions and behavioral influencing factors, including demographical factors, physical conditions, mental health, lifestyles, and so on (Krivanek et al., 2021; Nyberg et al., 2020); with few examining biomarkers (Borelli et al., 2018; de Godoy et al., 2021a), and existing biomarker reviews are narrow in scope (n = 9 and 21, separately) and lack synthesis across domains. Finally, the heterogeneous nature of cognitive aging is demonstrated (Loaiza, 2024), and a “successful–usual–pathological cognitive aging” conceptual framework has been proposed (Nyberg & Pudas, 2019), where the mechanism explorations of successful and pathological cognitive aging are theoretically equally important for ameliorating age-related cognitive deficits. Currently, however, the relatively few explorations and summaries of the underlying mechanisms of SCA skew research of cognitive aging heterogeneity toward pathological cognitive aging, which, to some extent, exacerbates older adults’ fear of ageing and raises the issue of possible ageism, which is detrimental to the promotion of healthy aging (Nelson, 2016).
A comprehensive integration of multidomain biomarkers is critically needed to elucidate the underlying mechanisms of SCA, particularly given the current paucity of systematic reviews in this field. This systematic review synthesizes current evidence on SCA biomarkers, including genetic, histological, biochemical, and neuroimaging, aiming to answer the aforementioned questions. By clarifying the biological mechanisms of SCA, we aim to inspire targeted strategies for preventing cognitive impairment and promoting cognitive health.
Method
This systematic review followed the standard guidelines of Preferred Reporting Items for Systematic Reviews and Meta-Analyses (PRISMA) 2020 (Page et al., 2021) and was registered with PROSPERO (International Prospective Register of Systematic Reviews, ID: CRD42024578134).
Literature search strategy
Four databases (PubMed, Scopus, PsycINFO, and Web of Science) were searched from inception to December 15, 2024, and the search terms were as follows: (“successful cognitive aging” OR “exceptional aging” OR “superaging” OR “super-aging” OR “superager” OR “supernormal” OR “high performing” OR “cognitive resilience” OR “exceptional cognition” OR “superior cognition” OR “maintained cognition” OR “exceptional memory” OR “superior memory” OR “maintained memory”) AND (“biomarker” OR “neuroimaging” OR “magnetic resonance imaging” OR “positron emission tomography” OR “biology” OR “pathology” OR “histology” OR “gene” OR “metabolism”). Two independent researchers (Y.R.Y., X.L.L.) conducted the search, screened references, and resolved discrepancies by consensus.
Inclusion and exclusion criteria
We focused on studies that explored potential biomarkers of SCA using genetic, histological, biochemical, neuroimaging, or other quantitative methods. The inclusion criteria for this study were as follows: (1) peer-reviewed, English-language articles; (2) participants aged 60 years and older; (3) SCA defined by neuropsychological tests; (4) at least one biomarker reported; and (5) original data analyzed. The exclusion criteria were as follows: (1) reviews and meta-analyses; (2) inappropriate records, including case studies, comments, editorials, conference abstracts, and preprints; and (3) inappropriate subject populations, including animals, young or middle-aged adults only, and specific patient groups.
Study selection and data extraction
Records were screened by Y.R.Y. and X.L.L. independently, and discrepancies were solved by consensus. The search results were merged, and duplicates were deleted first. Titles and abstracts of remaining articles were read, and articles unrelated to the current theme and inappropriate ones were excluded according to the exclusion criteria. The included articles were identified after the aforementioned selection and imported into EndNote 21, and the references of them were all screened to identify additional records.
Data were extracted from each included study, including study details (title, authors, year of publication, journal, country, database), participant demographics (sample size, age, sex), neuropsychological tests and partition criteria used in SCA definitions, biomarker types (genetic/epigenetic, biofluid, histological, PET, structural MRI, and functional neuroimaging), and key findings, especially the statistically significant differences between the SCA group and the normal control group.
Risk of bias and study quality assessments
The risk of bias and study quality were evaluated using the Quality Assessment of Diagnostic Accuracy Studies-2 (QUADAS-2) (Whiting et al., 2011) instrument. QUADAS-2 comprises four domains: patient selection, index test, reference standard, and flow and timing. All the domains are designed to assess the risk of bias, and the first three domains are also designed to evaluate concerns regarding applicability. Two researchers, Y.R.Y. and S.D.G., assessed the included papers, and discrepancies were solved by consensus. Each domain was considered to have either a “low” or “high” risk of bias, and “unclear” was used when insufficient information was available to permit a judgment.
Data synthesis and visualization
First, we organized all SCA definitions, including neuropsychological tests and partition criteria, and synthesized these definitions according to study design (e.g., cross-sectional or longitudinal) and control group selection (e.g., same-age peers or younger adults) to identify typical types of definitions. Second, key findings of included studies were synthesized by six biomarker domains and labelled by definition types qualitatively for further comparison and induction. Third, for structural neuroimaging findings, we further identified all brain regions of interest (ROIs) showing significant preservation in SCA individuals in the included studies, and (1) gray matter (GM) ROIs were mapped to the Harvard-Oxford atlas (for cortical regions) and the Automatic subcortical segmentation subcortical atlas (for subcortical regions) using the “ggseg” package (https://ggseg.github.io/ggseg/) of R software (version 4.2.0), the data and code can be found at https://github.com/ariayryang/SCA-signature; (2) white matter (WM) ROIs were visualized based on the JHU WM tractography atlas via BrainNet Viewer software (https://www.nitrc.org/projects/bnv/).
Results
General characteristics and quality assessment
The PRISMA-guided selection process (Figure 1) identified 6,699 records from four databases. After removing 3,620 duplicates and 2,884 irrelevant records, 195 full-text articles were screened, with 142 excluded according to the criteria. Three researchers (Y.R.Y., X.L.L., S.D.G.) independently evaluated 53 eligible articles, supplemented by eight additional records from reference screening and one added by checking for updates, yielding 62 included studies (Table S1). The general characteristics of the included studies are summarized in Table S2. Most studies (n = 51) were published after 2015, with 32 published after 2020, reflecting growing interest in the biological mechanism of SCA. The sample sizes of SCA participants varied widely (range: 5–1,060; median = 34; mean ± SD = 94.64 ± 164.68). We identified 14 distinct terms describing SCA populations, with “superager” being the most common (n = 27). Geographically, studies primarily came from the United States (n = 36), followed by South Korea (n = 5), China (n = 4), and several other countries. Forty-seven studies utilized established aging cohorts, notably the Alzheimer’s Disease Neuroimaging Initiative (n = 14) and the Northwestern SuperAging Program (n = 8).
Flow chart of study screening and selection under the guidance of the PRISMA 2020.
QUADAS-2 assessment revealed a generally low risk of bias (Figure 2A, Table S3), with several exceptions. One study showed high patient selection bias from convenience sampling; eight studies had high index test bias due to unblinded biomarker assessment with knowledge of the results of grouping, and 16 studies provided insufficient information for clear judgments. Most studies (n = 46) had an unclear risk of bias in flow and timing because the information was incomplete to estimate if the interval between the index test and reference standard was inappropriate. By strictly enforcing the inclusion and exclusion criteria, the risks of applicability of included studies were all low and acceptable.
(A) Quality assessment results of included studies; the data are consistent with Table S3. (B) The “three-type” framework of successful cognitive aging definitions.
Definitions of SCA
We identified 34 distinct SCA definitions across 62 studies (Table 1), and the inconsistency of SCA definition is self-evident. We divided these definitions into three types (Figure 2B): (1) cross-sectional comparison definition (CCD, 14 definitions in 19 studies), identifying top cognitive performers compared with their peers; (2) longitudinal tracking definition (LTD, 8 definitions in 14 studies), identifying high cognitive maintainers longitudinally; and (3) generational comparison definition (GCD, 11 definitions in 28 studies), identifying older adults who had equivalent cognition to adults 20–30 years younger. Additionally, another study identified SCA using more than one method. Memory (54 studies) and executive function (39 studies) were most frequently assessed when defining SCA, typically using the Rey Auditory Verbal Learning Test (AVLT, 25 studies) and the Trail-Making Test Part B (TMT-B, 31 studies) (Table S4).
The CCD approach utilized various thresholds, including median scores (three studies), mean scores (two studies), 10th–67th percentiles (six studies), and 0.5–1.5 SD above the mean (seven studies). The CCD makes full use of the cognitive aging norms and facilitates data acquisition and between-group comparisons, but it can reflect only the cognitive state at a single time point and cannot capture the dynamic nature of cognitive aging. The LTD approach was used in longitudinal studies that followed cognitive changes for 2.56–15 years. The latent clustering method is commonly used in this approach to identify “supernormal” maintainers (Chen et al., 2022; Josefsson et al., 2012; Lin et al., 2017b). Despite latent clustering, positive cognitive slopes, sustained high cognitive Z-scores, and maintaining normal cognition longitudinally were all incorporated in the included studies. LTD provides dynamic perspectives despite greater resource demands in longitudinal studies. GCD definitions predominantly featured “superagers,” the most distinctive SCA subgroup in our review. The Northwestern study group first defined superagers as older adults aged 80+ years with episodic memory performance at least as good as normative values for those 50- to 65-year-olds (Harrison et al., 2012), and the BRAINS program focused on a younger older adults group aged 60–80 years compared to young adults aged 18–32 years (Katsumi et al., 2021; Sun et al., 2016; Zhang et al., 2020). Other studies using the GCD have conducted various age comparisons, including 70+ versus 18- to 32-year-olds (Harrison et al., 2018), 60–80 versus 20- to 30-year-olds (Bott et al., 2017), etc. While GCD effectively demonstrates the cognitive youthfulness of SCA, significant variability in reference ages (from 16 to 60 years old) and about 30-year comparison gaps may introduce potential cohort effects.
Genetic and epigenetic biomarkers
Genetic factors significantly influence cognitive variability, yet their role in SCA remains unclear. We synthesize studies that examine how variations in genes (DNA sequences) and their regulation (e.g., DNA methylation) may influence SCA. The apolipoprotein E (APOE) gene, particularly its ε4 allele (APOE4), represents the strongest genetic risk factor for AD (Scheltens et al., 2021). Among 20 included studies examining genetic/epigenetic biomarkers (Table 2 and Table S5), 14 investigated the APOE4 carrier rate. Consistent findings show lower APOE4 carrier rates in SCA compared to pathological cognitive aging groups (Baran et al., 2018; Josefsson et al., 2012; Lin et al., 2017b). However, most studies found no significant APOE4 differences between SCA and normal controls (13 studies), with one exception reporting higher APOE4 frequency in cognitively low stable agers than successful agers (Lin et al., 2017b). Additionally, neither APOE2 allele frequency nor AD polygenic hazard scores distinguished SCA individuals from normal controls (Patel et al., 2024; Spencer et al., 2022), suggesting that neurodegenerative genetic risk factors seem to minimally impact SCA.
Beyond APOE, several candidate genes have been identified: Josefsson et al. (2012) identified catechol-O-methyltransferase (COMT)-met genotype as predictive of cognitive maintainers in the Betula study. Whole-exome sequencing revealed associations between SCA and mitogen-activated protein kinase kinase 3 (MAP2K3) gene variants (Huentelman et al., 2018), and another genome-wide analysis linked exceptional cognition to the 6q24 region (Barral et al., 2014). Epigenetically, three DNA methylation studies demonstrated that SCA individuals exhibit younger biological age profiles, including younger DNA methylation age compared to average or accelerated decliners (Degerman et al., 2017), delayed epigenetic age acceleration (Park et al., 2021) and differential methylated gene expression especially in cycle exit and neuronal differentiation 1 (CEND1) and microRNA 885 (Park et al., 2022b).
Biofluid biomarkers
Studies are synthesized to review measurable substances in blood, cerebrospinal fluid (CSF), or other bodily fluids that reflect brain health or pathology. Core AD biomarkers, including amyloid β_42_ (Aβ_42_), total tau protein (t-tau), and phosphorylated tau protein (p-tau) found in CSF or peripheral plasma, were examined in three studies to assess neuropathological resistance in SCA (Table 2 and Table S6). While Aβ_42_+ and t-tau+ individuals were more likely to be classified as cognitively low stable and declining agers than successful agers (Lin et al., 2017b), no significant difference in CSF Aβ/p-tau ratio was observed between SCA and average agers (Chen et al., 2020), nor in Aβ_42_/Aβ_40_ ratio, t-tau, p-tau, or p-tau/Aβ_42_ ratio (Garo-Pascual et al., 2023). Three of the included studies examined peripheral inflammatory markers with mixed findings. Higher C-reactive protein (CRP) levels were found associated with reduced familial dementia risk (Silverman et al., 2012), while resilient agers showed lower levels of interleukin-6 (IL-6) than did declining agers but not average agers (Bott et al., 2017), and SCA group had a marginally higher monocyte white blood cells counts and no significant difference in CRP or IL-6 levels compared with the control group (Patel et al., 2024). Additionally, metabolomic analyses identified 12 plasma metabolites distinguishing SCA and controls (area under the curve = 0.89) (Mapstone et al., 2017), and significant differences in the gut microbiome between superagers and typical agers were found with several selected microbial features (Kim et al., 2024). These emerging biomarkers highlight novel pathways in cognitive resilience.
Histological biomarkers
Six histological studies examined whether SCA reflects resistance to AD-related neuropathology or distinct neurophysiological mechanisms (Table 2 and Table S7), and these biomarkers are derived from postmortem brain tissue analysis, revealing microscopic changes linked to cognitive aging. The Northwestern University superaging group conducted a series of histological investigations revealing that superagers exhibited approximately one-third fewer AD-type neurofibrillary tangles (NFTs) in the entorhinal cortex (ERC) (Gefen et al., 2015, 2021; Nassif et al., 2022), and demonstrated larger soma sizes of ERC neurons (Nassif et al., 2022) compared to normal controls and even younger controls. In addition, superagers had fewer amyloid plaques in the anterior cingulate regions (Gefen et al., 2015). However, the 90+ study found no association between AD neuropathological changes and SCA (Biswas et al., 2023).
In addition to the findings for AD-related pathology, histological studies have identified several distinctive neurobiological features associated with SCA (Table 2 and Table S7). Von Economo neurons (VENs), specialized large bipolar neurons unique to humans and great apes, were found to be significantly denser in superagers compared to controls, particularly in anterior cingulate regions (Gefen et al., 2015, 2018). Additionally, an investigation on cholinergic pathways revealed that superagers exhibited reduced staining intensity and density of acetylcholinesterase (AChE)-positive cortical pyramidal neurons than controls (Janeczek et al., 2018), suggesting enhanced cholinergic function. This finding aligns with evidence of SCA individuals showing less cholinesterase-associated neuropathology in prefrontal and hippocampal regions compared to AD patients (Maxwell et al., 2022). Collectively, these findings suggest that SCA may involve both resistance to certain age-related neuropathological changes and the preservation of distinct neurobiological features.
PET biomarkers
Positron emission tomography imaging studies track molecular activity in the living brain to identify patterns associated with superaging. Fourteen PET studies examined various pathophysiological markers in SCA, including Aβ, tau, glucose metabolism, and N-acetyl aspartate (Table 2 and Table S8). Aβ deposition was investigated in 13 studies, and most of the results (10 studies) consistently revealed no significant difference in Aβ burden between SCA and normal control groups, aligning with the aforementioned biofluid and histological findings. Only three studies documented significant group differences: reduced regional Aβ deposition in the cingulate isthmus of SCA individuals than normal controls (Baran et al., 2018) or versus cognitive decliners, not normal controls (Arenaza-Urquijo et al., 2019; Harrison et al., 2024). In addition, longitudinal assessments suggested Aβ status, rather than SCA classification, influenced brain atrophy and cognition (Dang et al., 2019a, 2019b), and no difference was found in the rates of change in AD-related neuropathological biomarkers between maintainers and decliners (Harrison et al., 2024). Tau PET results were mixed: two studies found that SCA individuals presented lower levels of tau accumulation in the ERC (Harrison et al., 2024; Pezzoli et al., 2024), aligning with histological findings, while one showed no difference in tau deposition (Dominguez et al., 2024).
Cerebral glucose metabolism is one of the physiological indicators of cognitive function. Three [^18^F]-fluorodeoxyglucose-PET studies demonstrated significantly higher metabolism in the SCA group than controls in the cingulate cortex, anterior temporal pole, hippocampus, and several frontal and temporal regions (Arenaza-Urquijo et al., 2019; Baran et al., 2018; Borelli et al., 2021). Notably, a “resilience signature” was identified as predictive of cognitive stability independent of Aβ status (Arenaza-Urquijo et al., 2019). Another brain metabolic signature was found using proton magnetic resonance spectroscopy (^1^H-MRS), showing superagers exhibit higher N-acetyl aspartate concentrations in the posterior cingulate cortex (de Godoy et al., 2021b), also suggesting enhanced neuronal viability in SCA individuals.
Brain structural MRI biomarkers
Structural MRI findings from 22 studies measured physical brain characteristics, including cerebral thickness (CT), GM volume, white matter hyperintensity (WMH), etc., and revealed consistent brain preservation patterns in SCA (Table 2 and Table S9). One typical brain region involved in SCA’s structural preservation was the cingulate cortex, which was detected 14 times in nine studies. Initial observations by Fjell et al. (2006) demonstrated superior CT in high cognitive performers compared to average peers, with posterior cingulate regions even exceeding young controls. Subsequent research confirmed this cingulate preservation across its anatomical subdivisions, including the anterior cingulate cortex (eight studies), posterior cingulate cortex (four studies), cingulate gyrus isthmus, and paracingulate cortex. The hippocampus emerged as another key region of structural preservation of SCA, with seven studies reporting larger volumes compared to controls, extending to its neighboring structures in the medial temporal lobe (MTL), such as the parahippocampal gyrus and the ERC (Garo-Pascual et al., 2023; Pezzoli et al., 2024; Rosano et al., 2012). Preservations of frontal structures are also relatively common in SCA studies (Fjell et al., 2006; Harrison et al., 2018; Pezzoli et al., 2024; Sun et al., 2016), and were further emphasized in the “frontal preservation, temporal impairment (FPTI)” hypothesis (Yang et al., 2022), claiming that frontal preservation is one of the specific brain substrates of SCA. Subcortical structures, including the insula, basal forebrain, amygdala, and thalamus, also demonstrated GM advantages in SCA, and many fewer results were distributed in middle–posterior brain regions. Evidence for the longitudinal brain atrophy rate of SCA individuals is controversial, with some reporting slower hippocampal decline (Garo-Pascual et al., 2023; Harrison et al., 2024), while others found no group differences (Gardener et al., 2021; Harrison et al., 2018). A representative result regarding GM substrates of SCA was defined by Sun et al. (2016) as a “superaging signature.” Based on prior work, we summarize an updated GM preserved signature of SCA as shown in Figure 3A and Table S10.
Summarized brain signatures of regions showing significant structural preservation in successful cognitive aging (SCA) individuals. (A) Gray matter signature: The cortical regions are mapped in the left panel, and the subcortical regions are mapped in the right panel. The color change from yellow to purple indicates an increasing number of findings with SCA individuals having significantly better gray matter preservation than normal controls in included studies; this figure is depicted via R software with the “ggseg” package (https://ggseg.github.io/ggseg/). (B) White matter signature: Tracts presented in the upper panel are extracted from the Johns Hopkins University white matter tractography atlas (including 20 tracts), and tracts presented in the bottom panel are extracted from the ICBM-DTI-81 white matter labels atlas (including 48 tracts).
White matter investigations, though fewer in number, revealed important microstructural findings (Table 2 and Table S9). SCA individuals exhibited lower WMH burden (Harrison et al., 2018) and superior integrity (higher fractional anisotropy or lower mean diffusivity) in key tracts, including the cingulate cortex, the corpus callosum, and the superior longitudinal fasciculus (Kim et al., 2020; Rosano et al., 2012). A “frontal preservation”-type distribution of SCA’s WM advantage was found: an anteroposterior gradient with greater group differences in anterior tracts (Garo-Pascual et al., 2024). WM fibers that showed significantly greater integrity in SCA are summarized in Figure 3B and Table S11. WM connectome analyses revealed distinctive network properties in SCA, including stable structural connectome contributing to the prediction of pathology resistance (Chen et al., 2020), enhanced frontal connections (Wang & Zhang, 2021), and superior topological efficiency in frontal–basal ganglia regions (Yang et al., 2022), suggesting that preserved WM connectivity complements regional GM advantages in SCA, especially in frontal regions.
Brain functional neuroimaging biomarkers
Using functional MRI (fMRI) and related techniques, SCA individuals were found with unique advantages in dynamic brain functional activity that are strongly associated with their superior cognition (Table 2 and Table S12). Resting-state fMRI studies yield mixed functional connectivity (FC) findings. Four studies reported positive results indicating that FC differentiates between SCA individuals and average cognitive agers in the cingulate cortex (Borelli et al., 2021; Lin et al., 2017a), within both the default mode network (DMN) and salience network (SN) (Zhang et al., 2020), and between basal forebrain with putamen and insular cortex (Jia et al., 2022). In contrast, the other two studies find no significant FC differences in network level (Diamond et al., 2024; Keenan et al., 2024). Independent component analysis studies identified key differentiating networks (the DMN, SN, frontoparietal network, basal ganglia network, and language network) (Borelli et al., 2021; de Godoy et al., 2023; Xu et al., 2023), and proposed an enhanced neural efficiency hypothesis in SCA individuals (Klinedinst et al., 2023), and a machine learning study revealed discriminative nodes in cingulate and frontal regions for SCA prediction (Park et al., 2022a). Benchmarking the “superaging signature” proposed by brain structural studies, a “supernormal map” was defined as significantly differentiating SCA individuals and normal controls longitudinally (Wang et al., 2019), and regions in this map are similar to the structurally preserved regions summarized by this review (Figure 3A and Table S10).
Electroencephalography/ERP studies found a larger anterior P3 response to novel stimuli (Daffner et al., 2006; Riis et al., 2008), and greater temporal synchronicity, complexity, and interaction of brain activities (Linuma et al., 2022; Tobe et al., 2023) in SCA, both suggesting frontal compensatory. Task-based fMRI studies have provided further evidence of SCA’s frontal mechanism. SCA individuals showed greater activation in the prefrontal and hippocampal cortex (Pudas et al., 2013), greater neural differentiation during encoding, and greater neural reinstatement between encoding and retrieval (Katsumi et al., 2021), all of which were correlated with their memory performance. In addition, Chen et al. (2022) designed a subsequent memory paradigm and found that successful agers both exhibited greater subsequent memory effects on task-related regions and had compensatory frontal recruitment. These findings collectively highlight the frontal regions’ crucial role in cognitive preservation, complementing structural observations.
Integration of SCA biomarkers
All identified biomarkers are integrated based on the six-domain biomarker classification (Figure 4A) and the three-type definitional framework (Figure 4B). The most frequently studied biomarkers (examined in more than 10 studies) include APOE4, PET Aβ, and brain GM morphology, with the first two being found with mainly negative findings (i.e., minimal differences between SCA individuals and normal controls on APOE4 carrier rate or PET Aβ deposition). In contrast, consistent positive findings emerged from DNA methylation, VEN density, and PET glucose metabolism, along with various neuroimaging findings across multiple brain regions. From the perspective of definitional differences, only 6 of 35 biomarkers (17.1%) were examined across all three definitional types, while over half were investigated using just one definition type—often in single studies. Among the 62 included studies, 19 (30.6%) studies employed multidomain approaches (Table S13), yet only two (Gardener et al., 2021; Pudas et al., 2013) of them explored cross-domain interactions. These findings suggest that while current research has established a preliminary SCA biomarker framework, critical knowledge gaps remain. Future studies should particularly address: (1) definition-dependent consistency in biomarker findings, and (2) the synergistic effects of cross-domain biomarkers on cognitive outcomes.
Integration of biomarker findings of successful cognitive aging based on six biomarker domains and three types of definitions. (A) A hexagonal diagram showing all biomarkers discussed in this review by six domains. The numbers in parentheses indicate the number of studies with positive findings (in red color)/the number of studies with negative findings (in blue color); (B) A Venn diagram dividing all biomarkers based on the definitions these studies used. Biomarkers in gray color were those with over half of the related studies showing negative findings. AChE = acetylcholinesterase; AD-PHS = Alzheimer’s disease polygenic hazard score; ALFF = amplitude of low-frequency fluctuation; AP = amyloid plaques; APOE = apolipoprotein E; Aβ = amyloid β; CCD = cross-sectional comparison definition; COMT = catechol-O-methyltransferase; CPN = cortical pyramidal neuron; CRP = C-reactive protein; CSF = cerebrospinal fluid; DNAm = deoxyribonucleic acid methylation; EEG = electroencephalography; ERC = entorhinal cortex; ERP = event-related potential; FC = functional connectivity; fMRI = functional magnetic resonance imaging; GCD = generational comparison definition; GMV = gray matter volume; ICA = independent components analysis; IL = interleukin; LTD = longitudinal tracking definition; MAP2K3 = mitogen-activated protein kinase kinase 3; MRI = magnetic resonance imaging; MTL = medial temporal lobe; NFT = neurofibrillary tangles; PET = positron emission tomography; rsfMRI = resting-state magnetic resonance imaging; SCA = successful cognitive aging; VEN = von Economo neuron; WBC = white blood cell; WM = white matter; WMH = white matter hyperintensity.
Discussion
This systematic review synthesizes evidence from 62 studies examining biomarkers of SCA, addressing a critical gap in understanding the underlying mechanisms of exceptional cognition in old age. We identified a three-type definitional framework and analyzed six biomarker domains (genetic/epigenetic, biofluid, histological, PET, structural MRI, and functional neuroimaging biomarkers), revealing both consistent findings and important divergences in this emerging field.
This review highlights substantial heterogeneity in SCA definitions, identifying 14 diverse terms and 34 distinct definitions across included studies. This definitional variability poses challenges for comparative research, though the use of validated neuropsychological tests provides some standardization. We identified a “three-type” framework for SCA definitions: CCD, LTD, and GCD. Based on prior work, we propose several possible solutions to enhance definitional consistency, including: (1) prioritizing longitudinal designs (Nyberg, 2024) and data-driven methods such as latent clustering; (2) prioritizing episodic memory and executive function as assessed cognitive domains, and using TMT-B and Rey AVLT as specific cognitive tests; (3) applying the “three-type” framework of SCA definitions in the same study and selecting the overlapped sample of different definitions based on big data; and (4) expanding cultural diversity in study samples and conducting cross-cultural comparison studies.
Findings in this review suggest that the core mechanism of SCA differs from that of AD-related pathological cognitive aging. Aβ positivity is considered the pathological “gold standard” for AD, and high levels of APOE4 carrying rate and tau deposition are also characteristics of neurodegeneration (Jack et al., 2024). The relationship between APOE4 and SCA appears minimal, with only one of 14 studies reporting a significant difference between successful agers and low-stable agers, which were driven by latent classification analysis and were not proper normal controls (Lin et al., 2017b). Similarly, most studies found no Aβ differences between SCA individuals and normal controls (10 of 13 PET studies, two of three biofluid studies, and two of three histological studies), with exceptions showing reduced Aβ burden of the SCA group specifically in the cingulate cortex (Baran et al., 2018; Gefen et al., 2015), or less Aβ pathology in SCA individuals than cognitive decliners or low-stable agers, neither of which were proper normal controls (Arenaza-Urquijo et al., 2019; Harrison et al., 2024; Lin et al., 2017b). Controversial results were obtained for tau or NFTs in SCA studies: 6 of 10 studies reported significantly lower levels of tau in the CSF, postmortem brain issues, or PET images in SCA individuals, with a specific focus on the ERC, while the other four studies found no difference. Definitional differences and measurement techniques may account for these divergent findings, and more validating studies are needed in this field. It is worth noting that the aforementioned findings imply SCA individuals’ regional resistance to AD-related pathologies (Aβ and tau) in the cingulate and the medial temporal cortex, which aligns with their structural preservation.
Some consistently positive results may represent the specific resilience of SCA individuals. Epigenetic studies revealed that SCA individuals have a young DNA methylation age (Degerman et al., 2017; Park et al., 2021, 2022b), which tends to be a valuable biomarker for identifying SCA. Based on these positive results and the recent progress of aging clock studies, other biological age prediction models, such as brain age (Seitz-Holland et al., 2024), may also play an important role in identifying SCA. Another positive and consistent biomarker is high glucose metabolism in SCA individuals (Arenaza-Urquijo et al., 2019; Baran et al., 2018; Borelli et al., 2021). These studies emphasized the cingulate cortex as a crucial region and that glucose metabolism is independent of the Aβ burden. Having a healthier metabolic profile was also identified as a biofluid biomarker of SCA (Mapstone et al., 2017). The cingulate cortex was also highlighted in the findings of histological biomarkers with a high VEN density (Gefen et al., 2015, 2018), whose biological meaning has been interpreted as contributing to individual differences in general intelligence (g) by rapidly inducing the coherence of neuronal oscillations (Bruton, 2021), which needs further exploration in the aging process. Other potential biomarkers, including COMT, MAP2K3, ERC neuron size, AChE level, WMH, etc., require further validation due to limited replication.
A robust finding emerging from our cross-domain synthesis is the identification of a characteristic “cingulate gyrus–MTL–frontal cortex” signature, which may serve as a potential unifying framework for understanding the brain substrate of SCA. The cingulate cortex demonstrates convergent preservation across multiple biomarker domains in SCA individuals, showing lower Aβ deposition (Baran et al., 2018; Gefen et al., 2015), higher VEN density (Gefen et al., 2015, 2018), enhanced glucose metabolism (Arenaza-Urquijo et al., 2019; Baran et al., 2018; Borelli et al., 2021), and elevated N-acetyl aspartate concentrations (de Godoy et al., 2021b). The MTL, particularly the hippocampus, emerges as a pivotal substrate for both pathological and successful cognitive aging, likely due to its central role in episodic memory (Moscovitch et al., 2016), the most marked cognitive domain estimated in cognitive aging. The frontal components of this signature are particularly noteworthy; multiple neuroimaging signatures of SCA emphasized frontal regions (Sun et al., 2016; Wang et al., 2019; Zhang et al., 2020), and the recently proposed FPTI hypothesis (Yang et al., 2022) established a pivotal role of the frontal structure preservation in SCA. Moreover, the frontal maintenance and compensation mechanisms of brain function are commonly identified (Chen et al., 2022; Pudas et al., 2013; Vidal-Pineiro et al., 2019), suggesting that multiple protective mechanisms may converge in frontal regions. This tripartite signature aligns remarkably well with several established models of brain aging: (1) It encompasses key nodes of the DMN whose integrity is crucial for memory function and cognitive aging (Sun et al., 2016); (2) it reflects the frontal-predominant vulnerability and compensation predicted by the frontal aging hypothesis (West, 1996), the posterior–anterior shift in aging (Davis et al., 2008), and the scaffolding theory of aging and cognition (Reuter-Lorenz & Park, 2014). In summary, the “cingulate gyrus–MTL–frontal cortex” brain signature of SCA proposed by this review is supported by converging evidence, providing a testable model for future SCA research.
There are six domains of biomarkers that are synthesized and compared in this current review. Each biomarker category presents unique strengths and limitations: Genetic biomarkers offer stable early-risk assessment but lack dynamic information and typically unchangeable; biofluid biomarkers (e.g., plasma, saliva, urine) offer significant practical advantages as minimally invasive and cost-effective tools yet peripheral measures may not fully reflect brain pathology; histological biomarkers provide gold-standard validation but require postmortem tissue; PET imaging delivers molecular specificity at a high cost; structural MRI balances spatial precision with clinical accessibility; functional neuroimaging reveals neural mechanisms but shows state-dependent variability. For implementation, biofluid biomarkers and structural MRI currently may show the best feasibility-profile balance by now. After synthesizing, we found that most included studies treat biomarkers additively rather than interactively, and the cross-domain relationships between biomarkers are still unclear. We would like to emphasize that multimodal approaches used to explore SCA biomarkers and investigations on uncovering cross-domain interactions may optimize future research and applications (Bao et al., 2023), and emerging mobile health technologies and AI models may integrate multimodal data for better cognitive predictions and support (Czaja et al., 2025).
This systematic review has several limitations. First, the comparability of findings may be affected by differing SCA definitions, though most studies used validated neuropsychological tests and age-matched controls for reliable reference standards. Second, some studies had a small sample of SCA individuals, potentially limiting statistical power, and over half of the included studies were conducted in North America, which may reduce cultural generalizability. Third, due to methodological diversity across domains and the small sample sizes of some studies, the present study did not conduct a meta-analysis; future studies could include meta-analyses of SCA biomarkers as more findings become available.
Conclusions
This systematic review synthesizes evidence from 62 studies to characterize SCA through three definitional approaches and six biomarker domains. The overall profile of biomarkers shows that SCA represents an active neurobiological process marked by unique resilience mechanisms, rather than merely reflecting resistance to typical age-related pathologies (e.g., Aβ/tau deposition). Key findings demonstrate that SCA individuals have specific resilience mechanisms, as represented by their youthful epigenetic age, high VEN density, efficient glucose metabolism, and structural and functional integrity of critical brain networks. By summarizing neuroimaging studies, superior brain reserve, maintenance, and compensation in SCA individuals were found in brain regions centered on a “cingulate gyrus–MTL–frontal cortex” signature. The findings suggest that the aging process involves not only a decline and loss but also a process of maintenance and adaptation, emphasizing the importance of shifting research paradigms to better understand and optimize neural resilience capacities. We advocate for more studies on SCA’s biological mechanisms and interventions targeting clear resilience pathways in the future. Such work could ultimately enable more individuals to achieve healthy, graceful aging.
Supplementary Material
gnaf277_Supplementary_Data
The reference list from the paper itself. Each links out to its DOI / PubMed record.
- 1Arenaza-Urquijo E. M. , Przybelski S. A., Lesnick T. L., Graff-Radford J., Machulda M. M., Knopman D. S., Schwarz C. G., Lowe V. J., Mielke M. M., Petersen R. C., Jack C. R., Vemuri P. (2019). The metabolic brain signature of cognitive resilience in the 80+: Beyond Alzheimer pathologies. Brain: A Journal of Neurology, 142, 1134–1147. 10.1093/brain/awz 03730851100 PMC 6439329 · doi ↗ · pubmed ↗
- 2Bao H. , Cao J., Chen M., Chen M., Chen W., Chen X., Chen Y., Chen Y., Chen Y., Chen Z., Chhetri J. K., Ding Y., Feng J., Guo J., Guo M., He C., Jia Y., Jiang H., Jing Y., … Liu G.-H. (2023). Biomarkers of aging. Science China Life Sciences, 66, 893–1066. 10.1007/s 11427-023-2305-037076725 PMC 10115486 · doi ↗ · pubmed ↗
- 3Baran T. M. , Lin F. V., Hanseeuw B.; Alzheimer’s Disease Neuroimaging Initiative. (2018). Amyloid and FDG PET of successful cognitive aging: Global and cingulate-specific differences. Journal of Alzheimer’s Disease: JAD, 66, 307–318., 10.3233/jad-18036030282358 PMC 6538036 · doi ↗ · pubmed ↗
- 4Barral S. , Cosentino S., Christensen K., Newman A. B., Perls T. T., Province M. A., Mayeux R.; Long Life Family Study. (2014). Common genetic variants on 6q 24 associated with exceptional episodic memory performance in the elderly. JAMA Neurology, 71, 1514–1519. 10.1001/jamaneurol.2014.166325317765 PMC 4355405 · doi ↗ · pubmed ↗
- 5Biswas R. , Kawas C., Montine T. J., Bukhari S. A., Jiang L., Corrada M. M., Abner E. (2023). Superior global cognition in oldest-old is associated with resistance to neurodegenerative pathologies: Results from the 90+ study. Journal of Alzheimer’s Disease: JAD, 93, 561–575. 10.3233/jad-22106237066908 · doi ↗ · pubmed ↗
- 6Borelli W. V. , Leal-Conceição E., Andrade M. A., Esper N. B., Feltes P. K., Soder R. B., Matushita C. S., Hartmann L. M., Radaelli G., Schilling L. P., Moriguchi-Jeckel C., Marques da Silva A. M., Portuguez M. W., Franco A. R., da Costa J. C. (2021). Increased glucose activity in subgenual anterior cingulate and hippocampus of high performing older adults, despite amyloid burden. Journal of Alzheimer’s Disease: JAD, 81, 1419–1428. 10.3233/jad-210063 · doi ↗
- 7Borelli W. V. , Schilling L. P., Radaelli G., Ferreira L. B., Pisani L., Portuguez M. W., da Costa J. C. (2018). Neurobiological findings associated with high cognitive performance in older adults: A systematic review. International Psychogeriatrics, 30, 1813–1825. 10.1017/S 104161021800043129667572 · doi ↗ · pubmed ↗
- 8Bott N. T. , Bettcher B. M., Yokoyama J. S., Frazier D. T., Wynn M., Karydas A., Yaffe K., Kramer J. H. (2017). Youthful processing speed in older adults: Genetic, biological, and behavioral predictors of cognitive processing speed trajectories in aging. Frontiers in Aging Neuroscience, 9, 55. 10.3389/fnagi.2017.0005528344553 PMC 5344896 · doi ↗ · pubmed ↗