Bioactive IGF-I Concentrations in Children on GH Therapy
Lea Vilmann, Jakob Albrethsen, Jørgen Holm Petersen, Stine Agergaard Holmboe, Peter Christiansen, Katharina Maria Main, Line Cleemann, Kristian Horsman Hansen, Jan Frystyk, Casper P Hagen, Anders Juul

TL;DR
This study examines bioactive IGF-I levels in children on GH therapy to better understand their safety and effectiveness.
Contribution
The study introduces a method to measure bioactive IGF-I and compares it with total IGF-I in GH-treated children.
Findings
Bioactive IGF-I levels increase with age and correlate with total IGF-I in healthy children.
Only 13% of GH-treated children had bioactive IGF-I above +2SD, compared to 25% for total IGF-I.
Monitoring bioactive IGF-I may help optimize GH dosing in specific patient subgroups.
Abstract
Monitoring IGF-I concentration is recommended during GH therapy in children. Supranormal levels of total IGF-I have raised concerns of long-term risks. To evaluate bioactive and total IGF-I in healthy and in GH-treated children and adolescents. A reference population of 570 children (59% girls) from the Copenhagen Puberty Study III and 126 short children (36% girls) with GH deficiency (GHD) and other non-GHD conditions. We established pediatric, sex-specific reference ranges of serum concentrations of bioactive IGF-I (KIRA) and compared with total IGF-I and IGF-I/IGFBP-3 molar ratio (iSYS) and total IGF-I, -II, IGFBP-3, and acid labile subunit (liquid chromatography-tandem mass spectrometry) in a subgroup. Further, we compared IGF-I bioactivity with total IGF-I, IGFBP-3 (iSYS) and IGF-I/IGFBP-3 molar ratio during GH therapy. Bioactive IGF-I increased with age in healthy children and…
Genes, proteins, chemicals, diseases, species, mutations and cell lines named across the full text — each resolved to its canonical identifier and authoritative record.
Click any figure to enlarge with its caption.
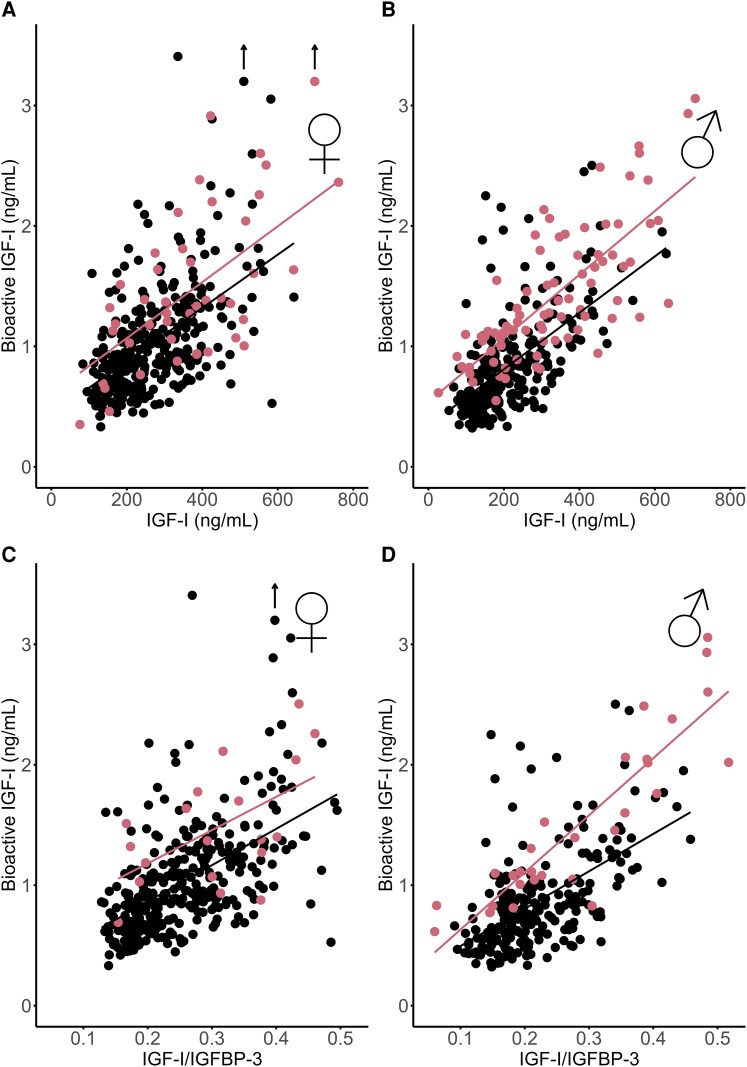 Figure 1
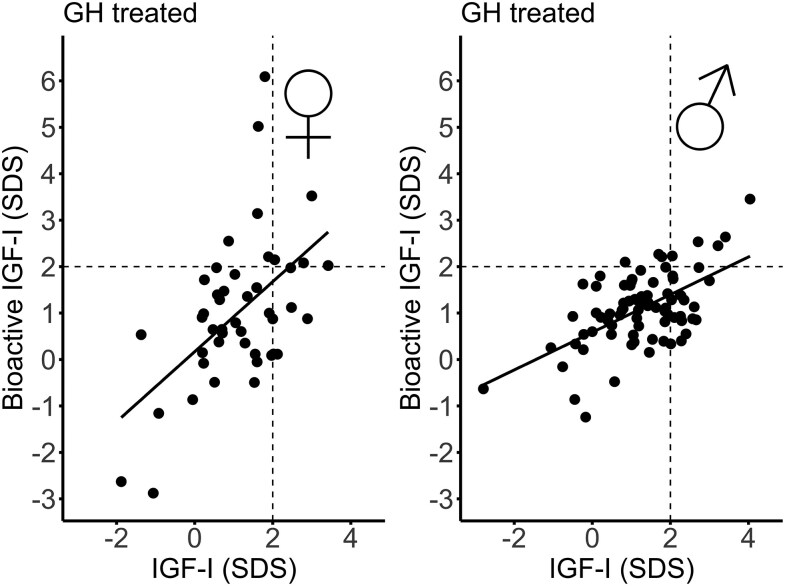 Figure 2
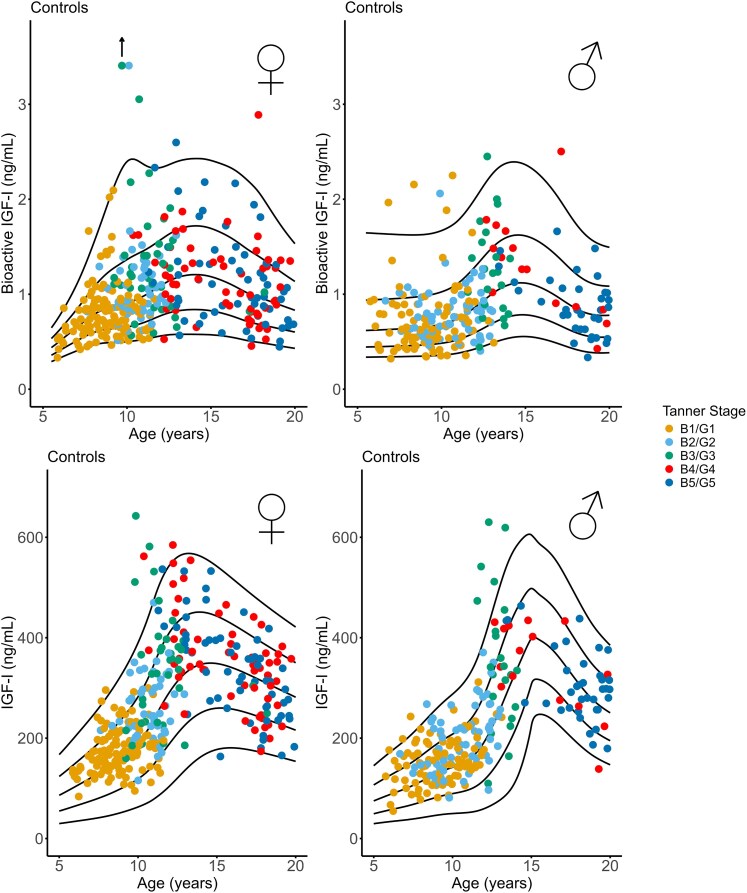 Figure 3
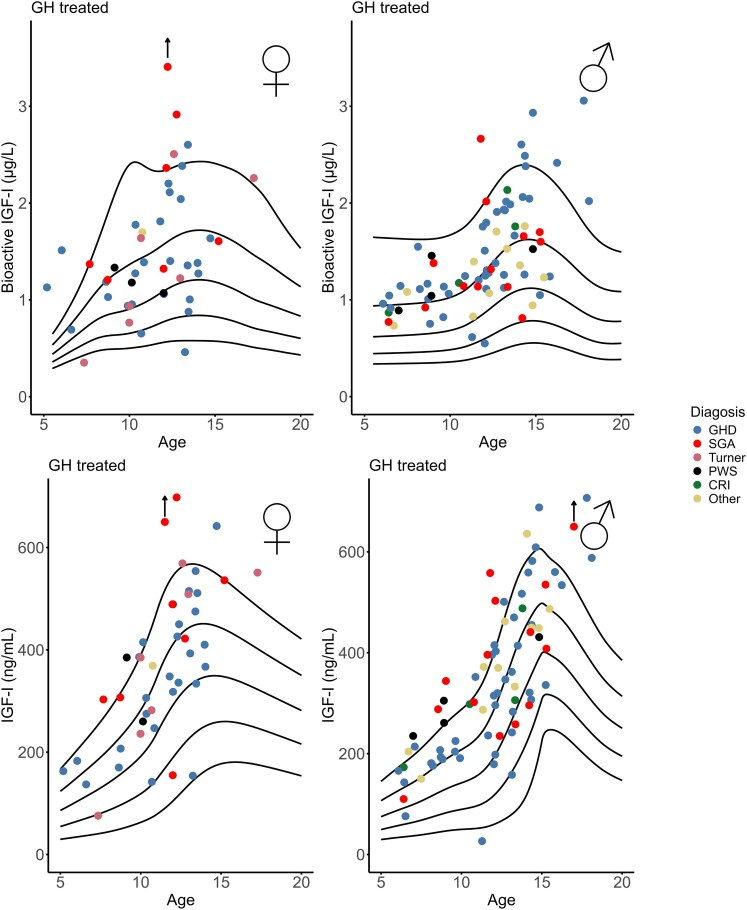 Figure 4
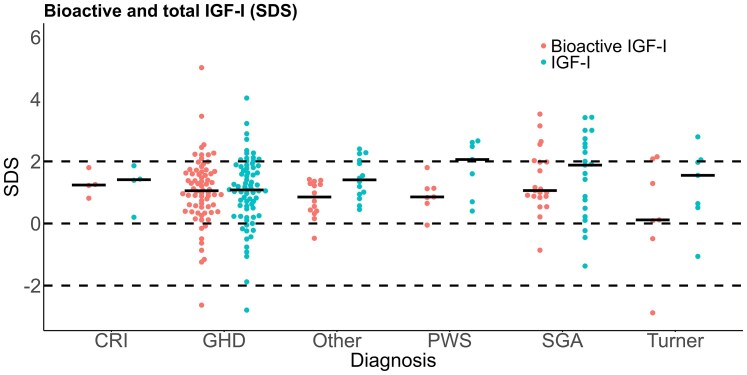 Figure 5
| Healthy controls | n | All children | Female (n = 334) | Male (n = 236) |
|
|---|---|---|---|---|---|
| Age (years) | 570 | 11.2 (9.1-13.7) | 11.1 (9.2-14.4) | 11.2 (9.1-13.3) | .730 |
| Weight (kg) | 570 | 39.4 (29.5-53.8) | 40.1 (29.5-54.3) | 37.8 (29.7-53.6) | |
| Height (cm) | 570 | 150.4 (137.5-164.9) | 151.2 (138.1-164.5) | 149.8 (136.9-168.3) | |
| Bioactive IGF-I (ng/mL) | 570 | 0.87 (0.65-1.16) | 0.93 (0.71-1.25) | 0.78 (0.57-1.01) |
|
| Tanner stage 1 | 0.75 (0.61-0.93) | 0.65 (0.49-0.87) |
| ||
| Tanner stage 2 | 0.99 (0.85-1.27) | 0.76 (0.60-0.93) |
| ||
| Tanner stage 3 | 1.20 (0.98-1.51) | 1.23 (0.84-1.57) | .747 | ||
| Tanner stage 4 | 1.10 (0.84-1.36) | 1.26 (0.85-1.62) | .460 | ||
| Tanner stage 5 | 1.07 (0.79-1.35) | 0.85 (0.64-1.07) | . | ||
| IGF-I (ng/mL) | 570 | 225 (166-325) | 243 (183-346) | 200 (147-279) |
|
| Tanner stage 1 | 172 (143-197) | 152 (121-187) |
| ||
| Tanner stage 2 | 244 (215-304) | 192 (147-237) |
| ||
| Tanner stage 3 | 333 (232-384) | 338 (256-460) | .591 | ||
| Tanner stage 4 | 349 (288-397) | 334 (267-423) | .646 | ||
| Tanner stage 5 | 332 (263-396) | 297 (259-355) | .125 | ||
| IGFBP-3 (ng/mL) | 570 | 3782 (3351-4173) | 3850 (3439-4221) | 3675 (3244-4050) |
|
|
|
|
| |||
| IGF-I (ng/mL) | 440 | 229 (168-315) | 269 (190-362) | 212 (160-260) |
|
| IGF-II (ng/mL) | 440 | 172 (121-225) | 158 (119-206) | 190 (127-245) |
|
| IGFBP-3 (ng/mL) | 362 | 2457 (2457-2825) | 2502 (2185-2978) | 2391 (2090-2761) | . |
| ALS (ng/mL) | 363 | 11 156 (9179-13379) | 12 663 (10313-14782) | 10 072 (8688-11960) |
|
| Subgroups | n | GH dose (mg/kg/d) | Bioactive IGF-I (SDS) | IGF-I (SDS) | Spearman's rho |
|---|---|---|---|---|---|
| GHD | 73 | 0.03 (0.02-0.04) | 1.07 (0.46-1.67) | 1.08 (0.31-1.82) | .442 |
| SGA | 21 | 0.02 (0.02-0.04) | 1.06 (−0.86-2.00) | 1.88 (0.36-2.65) | .641 |
| Turner syndrome | 7 | 0.02 (0.02-0.04) | 0.12 (−0.49-2.08) | 1.55 (0.51-2.05) | .821 |
| PWS | 7 | 0.02 (0.01-0.02) | 0.85 (0.65-1.13) | 2.06 (0.70-2.61) | .536 |
| CRI | 4 | 0.03 (0.03-0.05) | 1.24 (0.92-1.66) | 1.41 (0.50-1.75) | — |
| Other diagnoses | 14 | 0.03 (0.02-0.03) | 0.85 (0.38-1.30) | 1.41 (0.91-2.09) | .196 |
| All diagnoses | 126 | 0.03 (0.02-0.03) | 1.05 (0.53-1.63) | 1.26 (0.54-2.01) | .432 |
| All non-GHD diagnoses | 53 | 0.02 (0.02-0.03) | 1.00 (0.54-1.40) | 1.55 (0.67-2.29) | .468 |
| Bioactive IGF-I (SDS) | IGF-I (SDS) | IGFBP-3 (SDS) | Height (SDS) | Weight (SDS) | HV (SDS) | BMI (SDS) | |
|---|---|---|---|---|---|---|---|
|
| 1 | ||||||
|
| .526** | 1 | |||||
|
| .255 | .465** | 1 | ||||
|
| .028 | .077 | .065 | 1 | |||
|
| .118 | .254** | −.039 | .595** | 1 | ||
|
| .041 | .180* | .023 | .091 | .061 | 1 | |
|
| .119 | .249** | −.095 | .137 | .866** | .026 | 1 |
- —Kirsten and Freddy Johansen Foundation10.13039/501100007505
- —Novo Nordisk A/S10.13039/501100024571
- —Centre on Endocrine Disruptors
- —the Danish Environmental Protection Agency10.13039/501100007036
- —OPEN Lab
- —Department of Endocrinology
- —Odense University Hospital10.13039/501100004196
- —Research Council at Odense University Hospital10.13039/501100020083
Peer Reviews
No public reviews on file for this paper yet. If you reviewed it on a platform where reviews are public (OpenReview, ICLR, NeurIPS, ICML), you can paste yours below so the community can read it here.
Videos
No videos yet. Explain this paper in a talk, walkthrough, or lecture? Add one.
Taxonomy
TopicsGrowth Hormone and Insulin-like Growth Factors · Childhood Cancer Survivors' Quality of Life
In Europe, GH treatment is approved not only for short children with GH deficiency (GHD) but also for certain non-GHD conditions such as children born small for gestational age (SGA) without catch-up growth, Turner syndrome, Prader-Willi syndrome (PWS), Noonan syndrome, or SHOX haploinsufficiency. However, the growth response in these subgroups is very heterogeneous (1). Dosage of recombinant human (rh)GH is weight-based or dosed by body surface area. For decades, GH treatment of children with GHD has been monitored by the growth response and serum total IGF-I levels, which are maintained below the upper limit of the reference range (2). Normalization of growth and IGF-I levels through GH replacement reflects a well-established endocrine principle. However, these principles may not apply during GH therapy in short children with non-GHD conditions. In fact, 1 randomized controlled trial described that the majority of short children born SGA failed to grow when GH doses were titrated by serum total IGF-I (3). Thus, in non-GHD conditions, total IGF-I concentrations may not be an appropriate efficacy marker, but it may serve as a safety parameter to ensure that levels remain within reference range.
Sustained elevations in serum total IGF-I have prompted concerns regarding potential long-term risks, including cancer, but current evidence is predominantly from adult cohorts (4-6) and not from long-term surveillance studies of GH therapy. Although the follow-up period is limited, the Safety and Appropriateness of Growth hormone treatments in Europe (SAGhE) study found no effect of GH treatment on all-cause mortality nor cancer (7-9).
The IGF system controls metabolic and mitogenic responses in cells and thereby regulates embryonic growth and development as well as adult growth. IGF-II is an important regulator of fetal growth and levels are significant during fetal life, whereas postnatally the biological role of IGF-II remains uncertain (10). Levels of IGF-II drops right after birth and then increases until puberty and remains unchanged the remaining life (11). In the circulation, IGF-I and IGF-II compete for binding to IGF-binding proteins (IGFBP-1 to 6), with IGFBP-3 exhibiting the strongest affinity and binding more than 95% of IGF-I. The binary IGF-I/IGFBP-3 complex subsequently forms a ternary complex with the acid labile subunit (ALS) (12), thereby leaving only a small fraction of IGF-I being free and thus biologically available (13). Circulating IGF-I, IGFBP-3, and ALS are secreted by the liver in response to GH stimulation, whereas the regulation of IGF-II is less well understood, but its action is highly regulated by interaction with IGFBPs, in particularly IGFBP-3, which is also the major carrier of IGF-II in serum (10).
One way to estimate the biological activity of the circulating IGF system is by measuring the ability of serum to activate the IGF-I receptor (IGF-IR) in vitro (ie, bioactive IGF-I), as previously described (13). In this bioassay, buffer solutions containing recombinant human (rh)IGF-II is able to cross-react with the IGF-IR with an affinity being 12% of that of rhIGF-I (13). However, to which extent this can be translated to the in vivo situation in humans remains uncertain. For instance, in another study of children, total IGF-I correlated positively with the signal obtained by the bioassay, whereas serum total IGF-II did not correlate (14). For this reason, we often describe results obtained by the bioassay as “bioactive IGF-I.”
In a previous study, we demonstrated that markedly elevated total IGF-I concentrations during high-dose GH therapy in short SGA children were not reflected by supranormal bioactive IGF-I levels as measured by our bioassay (15). However, in children, GH treatment is also used in other indications than SGA, and therefore, the current study was intended to expand our previous findings to include short-stature children treated with GH for other reasons than SGA (ie, GHD, Turner syndrome, PWS, Noonan syndrome, and SHOX haploinsufficiency). We established a pediatric, sex-specific reference range of bioactive IGF-I (using our in-house KIRA) and evaluated bioactive IGF-I in a subgroup of healthy children against total IGF-I, IGF-II, IGFBP-3, and ALS measured by liquid chromatography-tandem mass spectroscopy (LC-MS/MS) and compared this with total IGF-I, and IGFBP-3 as measured by immunoassay (iSYS) in healthy children and patients with GHD and non-GHD disorders.
Methods and Materials
Reference Range for Bioactive IGF-I in a Cohort of Healthy Children
A subpopulation of 570 healthy children and adolescents (59% girls) from the ongoing cross-sectional, population-based Copenhagen Puberty Study III (COPUS III) served as reference population. Median (interquartile range [IQR]) age was for boys: 11.2 (9.1-13-3) and girls: 11.1 (9.2-14.4) years. Participants were evaluated by Tanner stage (16, 17), by either palpation of glandular breast or of testicular volume measured with an orchidometer. A single nonfasting blood sample was drawn from an antecubital vein between 8 Am and 12 Pm. Blood was centrifuged and stored at −80 °C until analyses of bioactive IGF-I and immunoassays for IGF-I, IGFBP-3, and ALS. In addition, a subgroup of samples was analyzed with the newly established LC-MS/MS method for quantifying IGF-I and IGF-II (n = 440), IGFBP-3 (n = 362), and ALS (n = 363).
Children With Short Stature Receiving GH Treatment
In total, 126 patients (36% girls) with short stature were prospectively enrolled from our outpatient clinic at the Department of Growth and Reproduction at Rigshospitalet during 2024. Patients received GH therapy because of the following conditions: GHD (n = 73), SGA (n = 21), Turner syndrome (n = 7), PWS (n = 7), chronic renal insufficiency (n = 4), or other disorders (n = 14); the latter group was a mixed category of Noonan syndrome, SHOX haploinsufficiency, Silver-Russell syndrome, idiopathic short stature, and Charge syndrome. Median (IQR) age was 12.0 (9.0-13.4) years, for boys: 12.1 (8.7-14.1) and girls: 11.9 (9.9-13.0) years. Children received recombinant human GH at a median (IQR) dose of 26 (22-34) µg/kg/day, given as daily subcutaneous injections. As part of standard clinical evaluation, height, and weight were recorded, and a serum sample was drawn and stored at −80 °C until analyses. Bone age was determined from an X-ray of the left hand and calculated by BoneXpert; predicted adult height was calculated according to Bayley-Pinneau (18).
Laboratory Measurements
Total IGF-I (RRID: AB_2861357) and IGFBP-3 (RRID: AB_2895663) concentrations were determined using solid-phase enzyme-labeled chemiluminescence immunoassays (IDS-iSYS IGF-I and IDS-iSYS IGFBP-3; Immunodiagnostic Systems Ltd, Boldon, UK) on the IDS-iSYS Multi-Discipline Automated Analyser (IDS-iSYS, Pouilly-en-Auxois, France) at the Department of Growth and Reproduction, Rigshospitalet. The lower detection limits were 10 ng/mL for IGF-I and 80 ng/mL for IGFBP-3. Inter-assay coefficients of variation (CV) were below 7.2% for both analytes (19, 20).
Bioactive IGF-I (RRID: AB_3716599) was measured by an in-house IGF-I KIRA assay as previously reported (13, 21). In brief, the assays determine the ability of serum IGF-I to activate the IGF-I receptor in cells transfected with the human IGF-IR gene. After incubation of cells with serum at 37 °C, cells are lysed and the amount of phosphorylated (ie, activated) IGF-IRs is determined by specific ELISA. As we compare signals obtained from serum with a serial dilution of rhIGF-I (calibrated against the international World Health Organization standard), we are able to express the signal in serum samples as microgram per liter of IGF-I. The detection limit of the KIRA assay was 0.23 ng/mL, and the intra-assay CV of samples 14.2%. The long-term inter-assay CV of a control sample was 17.7%. As regards specificity, human insulin, insulin lispro, insulin aspart, and porcine proinsulin cross-react with <1%, whereas IGF-II cross reacts with 12%, when tested in buffer solutions containing the antigens without serum (13). However, the biological relevance of IGF-II activated IGF-IR remains uncertain. This is stressed by our previous observations in 342 children: whereas total IGF-I and bioactive IGF-I correlated positively in both prepubertal and pubertal children, as well as in all children, total IGF-II correlated positively with the KIRA assay signal in prepubertal children, but negative in pubertal children and therefore, showed no overall association (14). Therefore, we refer to the signal of the KIRA assay as “bioactive IGF-I.”
IGF-I, IGF-II, IGFBP-3, and ALS were analyzed in randomly selected samples from the healthy cohort based on a newly developed LC-MS/MS technique, at the Department of Growth and Reproduction, Rigshospitalet, as described in detail in Albrethsen et al 2024 (22). In brief, IGF proteins were extracted from serum and digested and selected tryptic peptides were quantitated by targeted proteomics. The long-term CVs for IGF-I, IGF-II, IGFBP3, and ALS were 7%, 25%, 7%, and 12%, respectively. The limit of detection for IGF-I, IGF-II, IGFBP3, and ALS were 6, 2, 90, and 300 ng/mL.
Statistical Analyses
Age- and sex-specific SD scores (SDS) for IGF-I measured by iSYS were calculated from our reference data based on samples from 6459 healthy children, as previously published (23). Age- and sex-specific SDSs for bioactive IGF-I were calculated using our reference population of 570 healthy children. Reference ranges for all analytes were created using the Generalized Additive Model for Location, Scale, and Shape (GAMLSS) based on a Box-Cox distribution with age-varying coefficients. The GAMLSS model estimates a cross-sectional reference range and thus assumes that the data are cross-sectional. The data were summarized by 3 smoothed, age-dependent curves: L (age-dependent skewness), M (age-dependent median), and S (age-dependent coefficient of variation). Thus, age-related SDSs were calculated based on the GAMLSS model using the following equation: SD score = ((X/M)^L-1)/(L × S), where X is the measurement and L ≠ 0.
The IGF1/IGFBP3 molar ratio was calculated according to the formula as previously described by Friedrich et al (20): (IGF-I (ng/mL)×0.1307)/(IGFBP-3 (ng/mL)×0.0348).
As not all data were normally distributed, results are presented as median (IQR) and analyzed using nonparametric tests as shown in Tables 1 and 2. However, when comparing SDSs in a correlation matrix (Table 3), Pearson correlation coefficients were used. Differences between sexes or between bioactive IGF-I SDSs and total IGF-I SDSs within patient groups were analyzed by Mann-Whitney U test. Spearman correlation coefficients were used to assess correlations between bioactive IGF-I and serum levels of IGF-I, IGFBP-3, IGF-I/IGFBP-3 ratio, and anthropometrics within patients. In Figs. 1 and 2, linear regression was applied to assess the relationships between selected variables of interest. P values < .05 were considered significant.
Bioactive IGF-I vs total IGF-I (A and B) and IGF-I/IGFBP-3 molar ratio (C and D) with regression lines in healthy controls (black) and in GH-treated patients (red).
Bioactive and total IGF-I (SDS) with regression line in female and male GH-treated patients. Dashed black lines represents +2SD.
Statistical analyses were performed using R Studio (version 2024.12.1) and SPSS (IBM Statistics, version 28).
Ethics
Research was conducted according to the Helsinki II declaration and approved by the Ethical Committee and by The Danish Protection Agency: H-19087825-96630 and P-2020-322 (COPUS III); H-22058254 and P-2023-14551 (Patients). COPUS III was registered by Clinical Trials: NCT04884620. Written informed consent was obtained from participants older than age 18 years or guardians of each child participating in the studies.
Results
Bioactive IGF-I
Bioactive IGF-I was positively correlated with total IGF-I in healthy males and females: r = 0.61 and r = 0.58 (both P < .001) (Fig. 1A and 1B) as well as with IGF-I/IGFBP-3 molar ratio; males: r = 0.57 and females: r = 0.59 (both P < .001) (Fig. 1C and 1D).
In addition, bioactive IGF-I correlated positively with IGF-I (r = 0.56), IGFBP-3 (r = 0.29), and ALS (r = 0.38; all P < .001) quantified by LC-MS/MS, whereas a negative association was seen between bioactive IGF-I and IGF-II (r = −0.29; P < .001). Figures are available in a digital research material repository (24, 25).
Reference Ranges for Bioactive IGF-I
Bioactive IGF-I increased during childhood and peaked at mid-puberty, Tanner stage B3/B4 in girls: 1.20 (0.98-1.51) (median [IQR]) ng/mL and G3/G4 in boys: 1.26 (0.84-1.62) ng/mL (Fig. 3 and Table 1). In general, levels of bioactive IGF-I were lower in boys as compared to girls (P < .001), also across Tanner stages (Table 1).
Bioactive and total IGF-I in healthy girls and boys according to Tanner stage of puberty. Black lines reflect mean, ±1SD and ±2SD.
Bioactive IGF-I and Total IGF-I in GH-treated Children and Adolescents
Bioactive IGF-I was above +2SD in 13% (17/126) patients, whereas total IGF-I was above +2SD in 25% (32/126) patients (Figs. 2 and 4). In 9 patients, both bioactive IGF-I and total IGF-I were above +2SD. In 8 patients (6 with GHD and 2 born SGA), bioactive IGF-I levels were above +2SD, whereas total IGF-I remained below +2SD. Conversely, in 23 patients (9 with GHD, 6 SGA, 4 PWS, and 4 classified as “other” [including 3 with Silver-Russell syndrome, and 1 with Noonan syndrome]), bioactive IGF-I levels were below +2SD despite total IGF-I being above +2SD. In the non-GHD groups (SGA, Turner syndrome, PWS, chronic renal insufficiency, and “other diagnosis”), bioactive IGF-I SDS were lower than IGF-I SDS (r = 0.47, P < .001) (Fig. 5 and Table 2). There was no sex-specific difference of bioactive IGF-I serum levels in GH-treated patients (P = .36) (Table 1). In the GH-treated children, bioactive IGF-I SDS correlated with IGF-I SDS (r = 0.53, P < .001) (Fig. 2 and Table 3). Divided into subgroups, bioactive IGF-I and total IGF-I correlated positively within all patient groups except in the PWS and “other diagnoses” group (Table 2). Across subgroups, bioactive IGF-I correlated positively with IGF-I/IGFBP-3 molar ratio (r = 0.79, P < .001) (Fig. 1).
Bioactive IGF-I and total IGF-I in children receiving GH treatment by indication. Black lines reflect mean, ±1SD and ±2SD.
Bioactive and total IGF-I (SDS) by diagnosis. Gray horizontal bars represent median SD scores, dashed black lines represents mean and ±2SD.
Bioactive IGF-I SDS correlated positively with total IGF-I SDS and weight SDS but there was no association with IGFBP-3 SDS, height SDS, height velocity SDS, nor body mass index SDS (Table 3). In addition, when repeating the analysis including only patients within ±2SD of body mass index SDS did not change the results.
Discussion
This study compared serum levels of bioactive IGF-I using an in-house, validated (13) cell-based bioassay with measurements of the IGF system based on immunoassays and LC-MS/MS in a healthy population of children and adolescents. We present pediatric reference ranges for bioactive IGF-I for age, sex, and pubertal stage, and evaluated bioactive IGF-I in GH-treated patients with these reference ranges. We found that 13% of GH-treated children had bioactive IGF-I levels above +2SD, compared to 25% of patients who had elevated total IGF-I concentrations during standard GH therapy. This indicates that the qualitative responses of bioactive IGF-I and total IGF-I to GH treatment are different. Future studies are needed to evaluate if bioactive IGF-I can serve as a supplementary biomarker for GH dose titration, especially in non-GHD patients with poor growth response despite elevated total IGF-I concentrations.
Total IGF-I reflects the bound IGF-I as well as the free, bioavailable/bioactive IGF-I. The majority of IGF-I is bound to specific IGFBPs, particularly IGFBP-3, which form ternary complexes with ALS. These complexes prolong the half-life of circulating IGF-I but restricts its ability to activate receptors in target cells. Less than 1% of IGF-I is unbound and thus bioactive. As a result, total IGF-I may not reflect tissue-level activity of IGF-I.
To our knowledge, only 2 other studies have assessed bioactive IGF-I in children undergoing GH treatment; Wegmann et al (15) reported significant increases in bioactive IGF-I SDS after 1 year of GH therapy in children born SGA. Notably, although 68% had total IGF-I levels above +2SD, only 15% exceeded this threshold for bioactive IGF-I. In parallel, Bakker et al (26) found that nearly all patients had total IGF-I levels above +2SD, whereas only 1 of 40 children showed elevated bioactive IGF-I. They further concluded that in children with PWS, total IGF-I did not reliably distinguish between high and low IGF bioactivity.
IGF-I bioactivity has been evaluated in adults with GHD. In 2011 by Varewijck et al (27), bioactive IGF-I (KIRA) better reflected GHD than total IGF-I, thus insinuating the potential of bioactive IGF-I as a diagnostic tool. In 2015, they also demonstrated that during 12 months of GH treatment, changes in bioactive IGF-I did not parallel those in total IGF-I and remained subnormal in 40% of the patients (28).
Supranormal levels of total IGF-I during GH treatment are still a concern because of associations with a higher risk of adverse effects including increased risk of cancer later in life (4-6). However, most of these concerns are based on epidemiological studies of healthy middle-aged and elderly people, and do not necessarily apply to GH therapy during childhood.
In the follow-up SAGhE study, all-cause mortality and cancer risk was associated with the underlying diagnosis, but neither with the mean daily nor cumulative dose of rhGH (7, 9). In Kjaer et al (23), the cumulative lifetime exposure to total IGF-I and IGFBP-3 was examined in 6459 healthy participants and in 9 patients born SGA with 238 serum samples during GH treatment. Surprisingly, the mean lifetime exposure of total IGF-I in the GH-treated children was significantly lower compared to the mean lifetime exposure in the reference population. Although the results from both studies are reassuring, it is important to consider certain limitations, including a relatively short follow-up period and the absence of an untreated control group (the SAGhE study). The National Cooperative Growth Study, established to assess the safety and efficacy of GH treatment in children with growth disorders, evaluated 55 000 patients between December 1985 and January 2006, encompassing 192 354 patient-years of treatment (29). Certain patient groups with predispositions had a higher risk of adverse events and children previously treated with irradiation demonstrated an elevated risk in second neoplasms. Importantly, GH therapy was not associated with an increased risk of de novo leukemia, as confirmed previously (30-32). Overall, the safety profile of rhGH remains favorable with appropriate monitoring during and after therapy. To our knowledge, there are no long-term studies that have examined the lifetime effects of GH treatment during childhood, but the timing of which supranormal levels of total IGF-I are experienced may influence the risk of the development of malignancy. It is not clear whether high levels of total IGF-I should be a concern when bioactive IGF-I is within reference levels. However, the study design in the present study does not allow to evaluate bioactive IGF-I as a diagnostic tool, as well as treatment effect on growth nor the risk of long-term adverse effects.
In the current work, bioactive IGF-I and the IGF-I/IGFBP-3 molar ratio correlated positively but this is not always reproduced in other studies (33, 34). The diagnostic utility of serum IGF-I/IGFBP-3 molar ratio has been evaluated previously to be a useful clinical marker in the diagnosis of GHD (35). It is also considered an indirect biomarker of free/biologically active IGF-I to monitor GH treatment (36). Thus, we find it reassuringly that the IGF-I/IGFBP-3 molar ratio and the KIRA assay results are positively correlated. However, we believe the KIRA assay is a more direct estimate of the biological activity of IGF-I because it reflects real-time receptor activation.
There are limitations in this study. The estimation of bioactive IGF-I using the KIRA assay may overestimate the activity derived from IGF-I, as IGF-II is able to cross-react with 12%. However, as IGF-II is not GH dependent, this may be of less impact in this study. Furthermore, the specific treatment groups had relatively small sample sizes, which limits the statistical power. Another limitation in the present study is that repeated measurements were not included, and therefore we cannot assess whether bioactive IGF-I is a better or more accurate effect marker than total IGF-I during GH treatment. It is also noteworthy that our patients are treated with relatively modest GH doses compared to recommendations.
However, our study has several strengths, including the establishment of a contemporary healthy cohort of children and adolescents that form the foundation of bioactive IGF-I (KIRA) reference levels for future use. Moreover, we provide a large cohort of short stature children with different diagnoses, which has not been done before in relation to bioactive IGF-I. Finally, we present unique measurements from MS of IGF-I and 3 other proteins (IGF-II, IGFBP-3, and ALS) that influence the amount of biologically active IGF-I.
In conclusion, bioactive IGF-I increased throughout childhood and peaked around mid-puberty in both boys and girls. Among GH-treated patients, the prevalence of supranormal levels of bioactive IGF-I and total IGF-I varied across groups. Thus, our findings suggest that bioactive IGF-I may serve as a supplementary marker for GH titration, especially in non-GHD patients who exhibit poor growth response despite elevated total IGF-I.
The reference list from the paper itself. Each links out to its DOI / PubMed record.
- 1Bang P, Bjerknes R, Dahlgren J, et al A comparison of different definitions of growth response in short prepubertal children treated with growth hormone. Horm Res Paediatr. 2011;75(5):335‐345.21228552 10.1159/000322878 · doi ↗ · pubmed ↗
- 2Grimberg A, Di Vall SA, Polychronakos C, et al Guidelines for growth hormone and insulin-like growth factor-I treatment in children and adolescents: growth hormone deficiency, idiopathic short stature, and primary insulin-like growth factor-I deficiency. Horm Res Paediatr. 2017;86(6):361‐397.10.1159/00045215027884013 · doi ↗ · pubmed ↗
- 3Jensen RB, Thankamony A, O’Connell SM, et al A randomised controlled trial evaluating IGF 1 titration in contrast to current GH dosing strategies in children born small for gestational age: the north European small-for-gestational-age study. Eur J Endocrinol. 2014;171(4):509‐518.25080293 10.1530/EJE-14-0419 · doi ↗ · pubmed ↗
- 4Major JM, Laughlin GA, Kritz-Silverstein D, Wingard DL, Barrett-Connor E. Insulin-like growth factor-I and cancer mortality in older men. J Clin Endocrinol Metab. 2010;95(3):1054‐1059.20080855 10.1210/jc.2009-1378 PMC 2841529 · doi ↗ · pubmed ↗
- 5Carlzon D, Svensson J, Petzold M, et al Insulin-like growth factor I and risk of incident cancer in elderly men—results from Mr OS (Osteoporotic Fractures in Men) in Sweden. Clin Endocrinol (Oxf). 2016;84(5):764‐770.26440042 10.1111/cen.12962 · doi ↗ · pubmed ↗
- 6Burgers AMG, Biermasz NR, Schoones JW, et al Meta-analysis and dose-response metaregression: circulating insulin-like growth factor I (IGF-I) and mortality. J Clin Endocrinol Metab. 2011;96(9):2912‐2920.21795450 10.1210/jc.2011-1377 · doi ↗ · pubmed ↗
- 7Sävendahl L, Cooke R, Tidblad A, et al Long-term mortality after childhood growth hormone treatment: the SA Gh E cohort study. Lancet Diabetes Endocrinol. 2020;8(8):683‐692.32707116 10.1016/S 2213-8587(20)30163-7 · doi ↗ · pubmed ↗
- 8Swerdlow AJ, Cooke R, Albertsson-Wikland K, et al Description of the SA Gh E cohort: a large European study of mortality and cancer incidence risks after childhood treatment with recombinant growth hormone. Horm Res Paediatr. 2015;84(3):172‐183.26227295 10.1159/000435856 PMC 4611066 · doi ↗ · pubmed ↗