An explainable imaging-clinical biomarker for non-small cell lung cancer prognostication based on normalised hotspot to centroid distance and [18F]FDG PET/CT radiomics
Mitchell Chen, Susan J. Copley, Yidong Han, Mubarik A. Arshad, Patrizia Viola, Kristofer Linton-Reid, Tina Stoycheva, Gary J. R. Cook, David Landau, Sue Chua, Richard O’Connor, Jeannette Dickson, Danielle Power, Andrea G. Rockall, Tara D. Barwick, Eric O. Aboagye

TL;DR
This study introduces a new non-invasive biomarker for predicting survival in lung cancer patients using PET imaging and radiomics features.
Contribution
The novel contribution is the integration of normalized hotspot-to-centroid distance with radiomics and clinical data to form a prognostic signature called nLCEV.
Findings
NHOC and RPV independently predicted survival with hazard ratios of 2.52 and 2.68, respectively.
nLCEV stratified patients into high- and low-risk groups with significant hazard ratios across multiple validation cohorts.
The nLCEV model achieved an area under the curve of 0.76 for 3-year survival prediction.
Abstract
Accurate prognostication is crucial for guiding personalised treatment strategies in non-small cell lung cancer (NSCLC). While radiomics offers promise, few features are derived from cancer models with causal justification to support their biological validity. This study evaluated the prognostic utility of normalised hotspot-to-centroid distance (NHOC), a recently proposed [18F]FDG PET imaging metric derived from a cancer evolutionary model, and its integration with PET/CT radiomics and clinical features to form a composite signature, non-invasive lung cancer evolution vector (nLCEV). A retrospective, multi-centre study was conducted using pre-treatment [18F]FDG PET/CT scans from 285 NSCLC patients (mean age: 67.7 ± 10.1 years; male:female = 171:114, International Association for the Study of Lung Cancer stage: T1/2/3/4/unknown = 61/118/53/52/1, N0/1/2/3/unknown = 133/46/71/34/1,…
Genes, proteins, chemicals, diseases, species, mutations and cell lines named across the full text — each resolved to its canonical identifier and authoritative record.
Click any figure to enlarge with its caption.
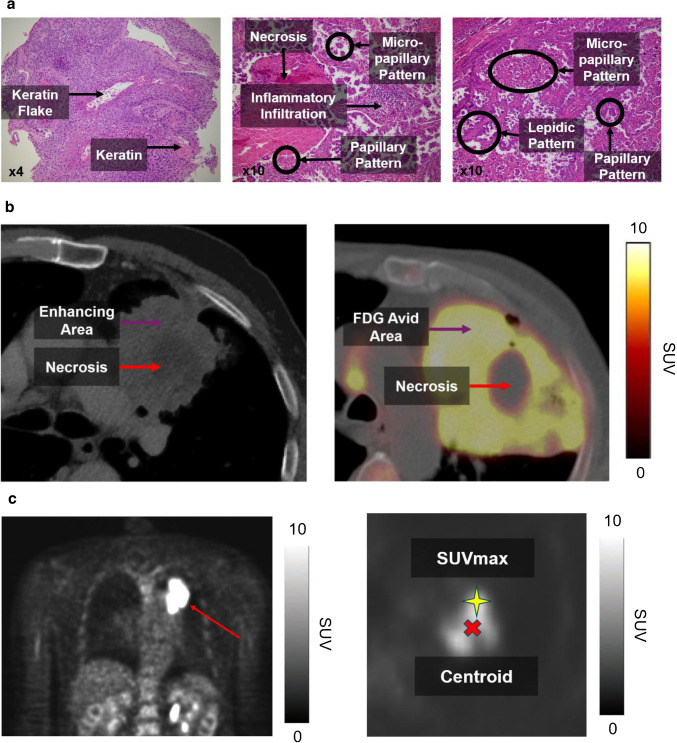 Figure 1
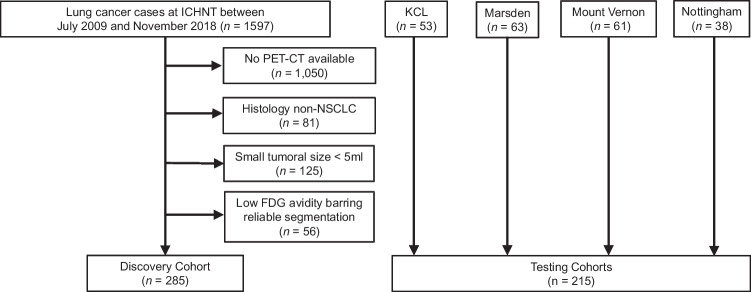 Figure 2
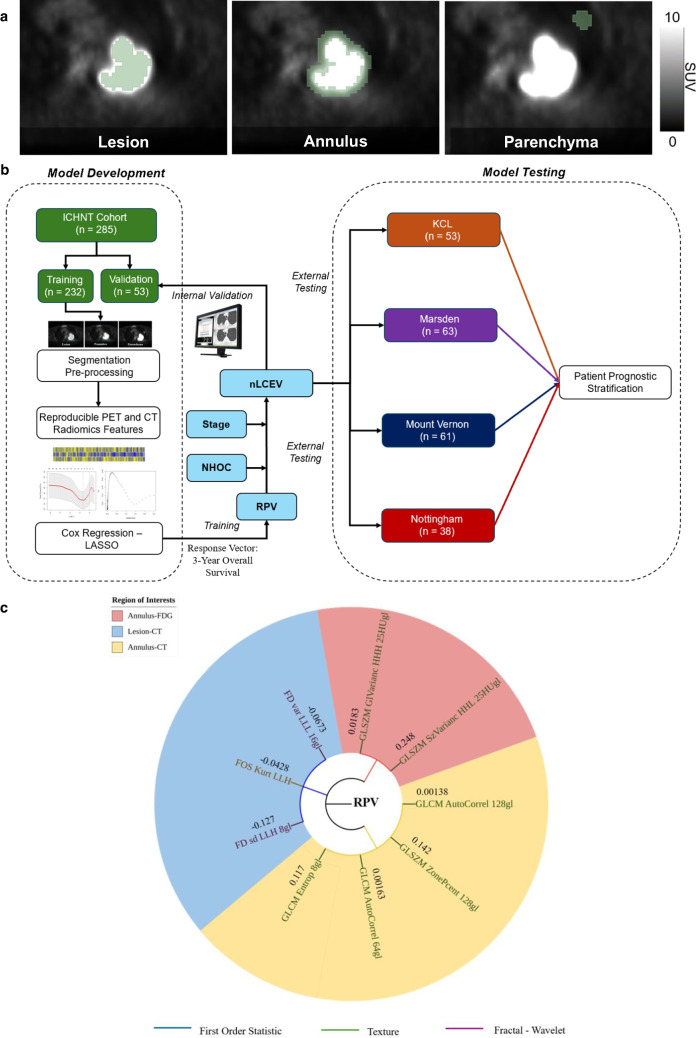 Figure 3
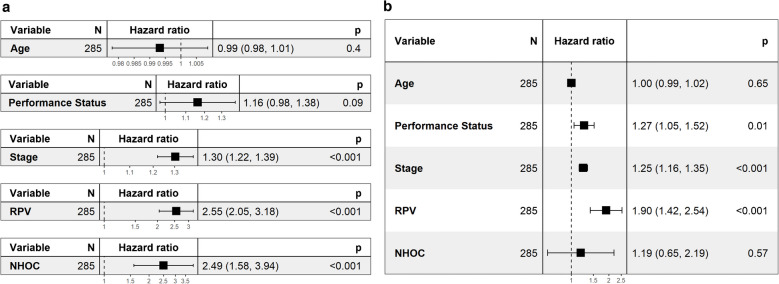 Figure 4
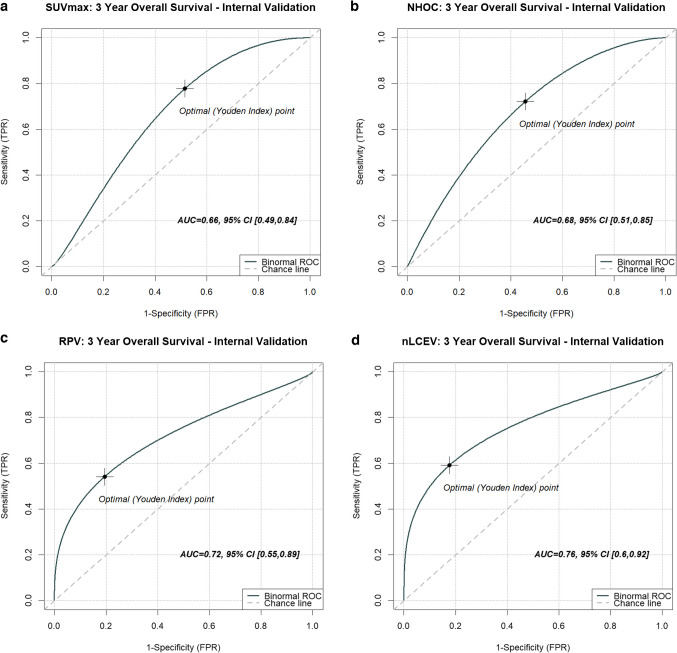 Figure 5
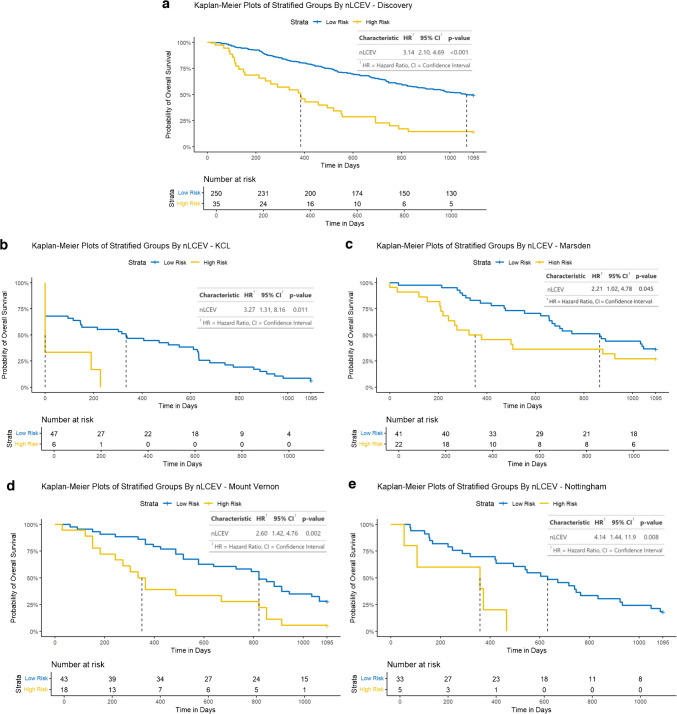 Figure 6
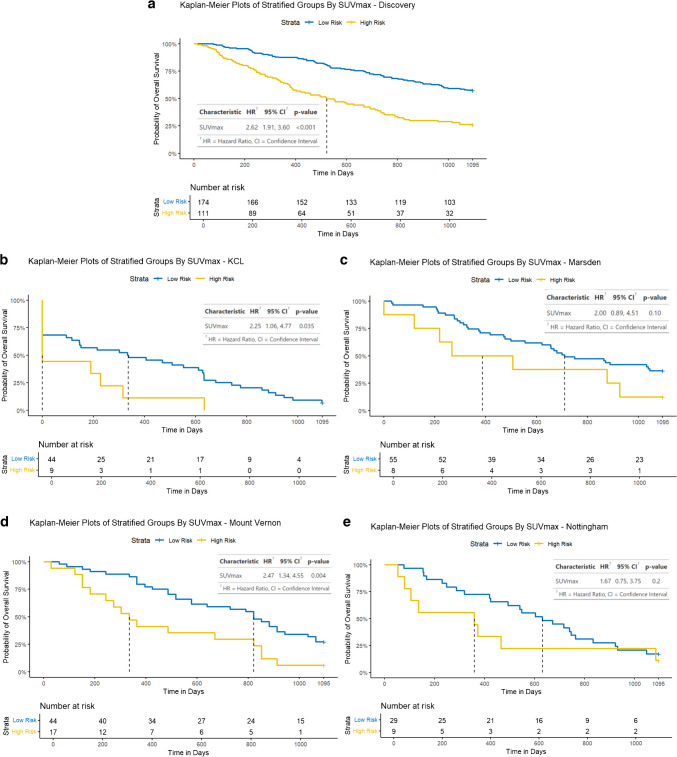 Figure 7
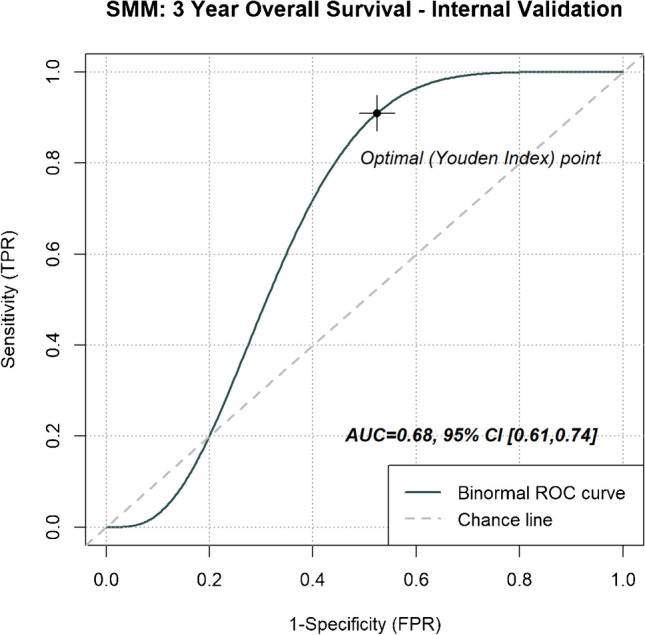 Figure 8
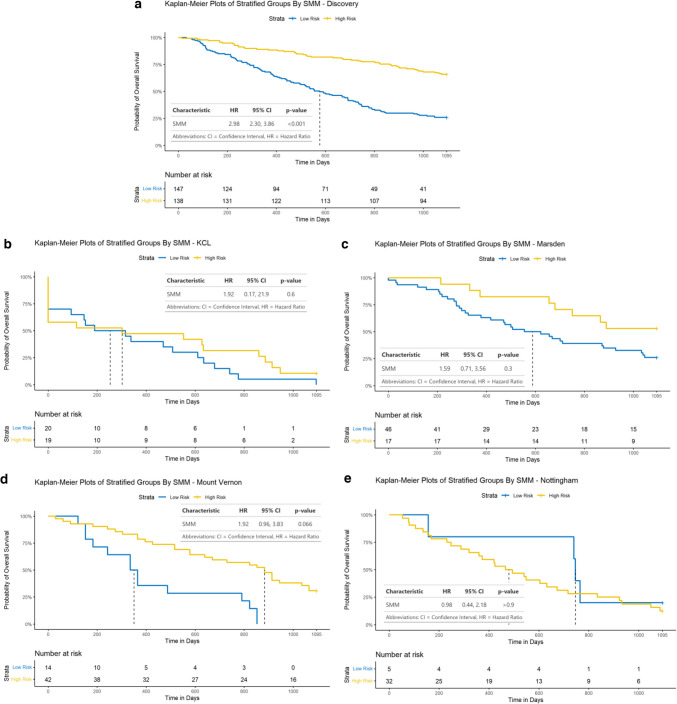 Figure 9
- —http://dx.doi.org/10.13039/501100000265Medical Research Council
- —http://dx.doi.org/10.13039/501100013342NIHR Imperial Biomedical Research Centre
Peer Reviews
No public reviews on file for this paper yet. If you reviewed it on a platform where reviews are public (OpenReview, ICLR, NeurIPS, ICML), you can paste yours below so the community can read it here.
Videos
No videos yet. Explain this paper in a talk, walkthrough, or lecture? Add one.
Taxonomy
TopicsRadiomics and Machine Learning in Medical Imaging · Lung Cancer Diagnosis and Treatment · Medical Imaging Techniques and Applications
Introduction
Lung cancer is the leading cause of cancer-related deaths worldwide, with non-small cell lung cancer (NSCLC) accounting for 80–85% of its cases [1]. Over 70% of NSCLC cases are diagnosed at advanced stages, carrying poor prognoses [2]. Disease prognostication is critically important for guiding personalised treatment decisions, improving clinical outcomes and enhancing patients’ understanding of their disease trajectory.
Radiomic features are quantitative metrics derived from imaging data and can non-invasively capture important disease information [3, 4]. As part of their disease work-up, NSCLC patients routinely receive ^18^F-fluorodeoxyglucose positron emission tomography/computed tomography ([^18^F]FDG PET/CT), which offers a prime window of opportunity to harness the power of radiomics for patient prognostication. Prior studies have demonstrated the utility of [^18^F]FDG PET/CT radiomics to achieve prognostication [5–11], but few have based their approach on a comprehensible biophysical disease model established a priori [12–14]. Cancer biology-derived imaging metrics offer better explainability and causal backing unparalleled by traditional data mining-derived signatures.
NSCLC demonstrates significant intra-tumoural heterogeneity [15]. Tumour-promoting driver cells show non-uniform spatial distribution. On contrast-enhanced CT, they can manifest as areas of increased enhancement or internal vascularity (Fig. 1a), reflecting their high perfusion/vascularity and/or angiogenesis favouring disease progression [16]. On [^18^F]FDG PET, such cells can exhibit higher avidity from their increased metabolic activity (Fig. 1b) due to Warburg effect, or an upregulation of glycolysis and glucose consumption in response to tumour microenvironment, hypoxia, and intrinsic oncogenic signalling [17]. As cancer evolves, areas of high metabolic activity are believed to drift towards the periphery as the tumour becomes more aggressive and are associated with poorer disease prognoses [18]. The normalised hotspot to centroid (NHOC) distance is a novel biomarker postulated to model this relationship, which is defined as the minimum Euclidean distance between the maximum standard uptake value ( \documentclass[12pt]{minimal} \usepackage{amsmath} \usepackage{wasysym} \usepackage{amsfonts} \usepackage{amssymb} \usepackage{amsbsy} \usepackage{mathrsfs} \usepackage{upgreek} \setlength{\oddsidemargin}{-69pt} \begin{document}$$SU{V}_{max}$$\end{document} ) voxel and geometric centroid, normalised by the tumour’s metabolic spherical radius (MSR). It provides a dimensionless measure of the relative peripherality of the metabolic hotspot, such that the further the distance for a given tumour size, the more aggressive the cancer is anticipated to be. The prognostic value of NHOC has been tested in silico and in a small NSCLC dataset but was yet to be validated on at scale [18].Fig. 1a. Intra-tumoural heterogeneity (ITH) appreciated histologically in a case of squamous cell carcinoma at 4 × magnification for (left) and two cases of adenocarcinoma at 10 × magnification (middle and right). b. ITH appreciated radiologically on CT (left) and [^18^F]FDG PET (right). c. Illustration of normalised hotspot to centroid (NHOC) distance, modelling postulated competition between cancer cell subpopulations
In this study, we sought to provide this validation in the context of NSCLC by evaluating its performance in several independent external cohorts and investigate its prognostic utility alongside conventional hand-crafted radiomics extracted from [^18^F]FDG PET and attenuation correction CT, to develop an effective composite non-invasive NSCLC evolutionary vector for patient prognostication.
Material and methods
Data collection
This retrospective study was approved by the institutional review board and Health Research Authority UK (HRA 18HH4616), conducted in accordance with the Declaration of Helsinki, and adhered to the STROBE and REMARK guidelines. The requirement for informed consent was waived due to the study’s retrospective and observational nature and use of de-identified patient data.
The inclusion criteria were patients with histologically confirmed NSCLC, with a target lesions ≥ 5 ml who had a pre-therapy [^18^F]FDG PET/CT scan available and underwent radical radiotherapy with or without chemotherapy. A minimum lesion volume of 5 ml was selected, based on early work [19]. Exclusion criteria were patients undergoing surgery, palliative treatment or disease showing low FDG avidity preventing reliable segmentation on [^18^F]FDG PET.
The discovery cohort consisted of pre-therapy [^18^F]FDG PET/CT scans from 285 NSCLC patients (age: 67.7 ± 10.1, male: female (M: F) = 171:114), acquired between July 2009 and November 2018 at Imperial College Healthcare NHS Trust (ICHNT). Disease staging was based on International Association for the Study of Lung Cancer (IASLC) 7th edition, applicable at the time of disease diagnosis: T1/2/3/4/unknown = 61/118/53/52/1, N0/1/2/3/unknown = 133/46/71/34/1, M0/1/unknown = 222/62/1. All patients were treated in line with the best available standard-of-care at the time of diagnosis, based on prevailing national and institutional guidelines.
The discovery cohort was split into training and internal validation sets of 232:53 (80:20 split), balanced for patient’s age, histology, stage and prognosis; in keeping with previous relevant literature [11, 14]. Independent external [^18^F]FDG PET/CT data were acquired between October 2008 and December 2013 at four other UK centres, also used in previous works [11, 20]: King’s College London & Guy’s and St. Thomas’ PET Centre, London (KCL: n = 53, age: 65.8 ± 9.2, M: F = 31:22, staging: T1/2/3/4/unknown = 6/14/15/17/1, N0/1/2/3/unknown = 10/5/33/4/1, M0/1/unknown = 41/11/1), Mount Vernon Hospital, Northwood (Mount Vernon: n = 61, age: 71.2 ± 9.5, M: F = 32:29, staging: T1/2/3/4/unknown = 22/10/25/1/3, N0/1/2/3/unknown = 22/10/25/1/3, M0/1/unknown = 60/0/1), Royal Marsden Hospital, Sutton (Marsden: n = 63, age: 68.1 ± 14.3, M: F = 43:20, staging: T1/2/3/4 = 11/17/17/18, N0/1/2/3 = 26/12/24/1, M0/1 = 62/1) and Nottingham University Hospital, Nottingham (Nottingham: n = 38, age: 69.7 ± 10.4, M: F = 21:17, staging: T1/2/3/4 = 3/14/19/2, N0/1/2/3 = 17/5/11/5, M0/1 = 37/1).
Clinical and histological data were collected from electronic patient records. Patient overall survival was documented up to 3 years post-diagnosis, in line with prior study [14]. It is defined as the time from the baseline diagnostic CT to 3-year follow-up or patient death of any cause, whichever occurred earlier. We excluded cases with tumour histology other than NSCLC, missing clinical data, or suitable imaging data (small tumour volume (< 5 ml) not suitable for [^18^F]FDG PET assessment, or low FDG avidity (SUV_mean_ of such cases: 0.7–2.3) preventing semi-automated segmentation on [^18^F]FDG PET), given the known negative impact of inaccurate image segmentation on radiomic feature reproducibility [21]. CONSORT diagram of the study cohorts and patient characteristics are presented in Fig. 2 and Table 1, respectively.Fig. 2CONSORT diagram of the study cohorts. The external validation cohorts (KCL, Marsden, Mount Vernon and Nottingham) were kept separate during testing to provide a centre-based testing framework, mirroring real-world evaluation practiceTable 1Characteristics of patients included in the study and p-values showing statistical differences between the discovery and testing cohorts. Notes: Percentage figures are given in brackets, unless otherwise specified. ECOG, Eastern Cooperative Oncology Group; simplified disease stage based on International Association for the Study of Lung Cancer (IASLC) 7th edition; NA: data not available; p-values were calculated using two-sided Wilcoxon signed rank test: denotes statistically significant differenceDiscoveryN* = 285No. (%)KCLN = 53No. (%)p-valueMarsdenN = 63No. (%)p-valueMount VernonN = 61No. (%)p-valueNottinghamN = 38No. (%)p-valueAge (years) Median SD Range67.710.132–8765.89.246–880.1268.114.342–880.2371.29.548–910.02969.710.453–1010.50Sex Female Male114 (40.0)171 (60.0)22 (41.5)31 (58.4)0.8420 (31.7)43 (68.3)0.2229 (47.5)32 (52.5)0.2817 (44.7)21 (55.3)0.58ECOG Performance Status 0 1 2 3 4 Unknown140 (49.1)88 (30.8)39 (13.7)11 (3.9)2 (0.7)5 (1.8)NANANANAT Stage 1 2 3 4 Unknown61 (21.4)118 (41.4)53 (18.5)52 (18.2)1 (0.4)6 (11.3)14 (26.4)15 (28.3)17 (32.0)1 (1.9)0.001311 (17.5)17 (27.0)17 (27.0)18 (28.6)0.0212 (20.7)25 (43.1)11 (19.0)10 (17.2)3 (4.9)0.973 (7.9)14 (36.8)19 (50.0)2 (5.3)0.11N Stage 0 1 2 3 Unknown133 (46.7)46 (16.1)71 (24.9)34 (11.9)1 (0.4)10 (18.9)5 (9.4)33 (62.2)4 (7.5)1 (1.9)0.001826 (41.3)12 (19.0)24 (38.1)1 (1.6)0.8322 (38.6)10 (17.5)25 (43.9)1 (1.6)3 (4.9)0.5817 (44.7)5 (13.2)11 (28.9)5 (13.2)0.63Metastases 0 1 Unknown222 (77.9)62 (21.7)1 (0.4)41 (77.4)11 (22.6)1 (1.9)0.8762 (98.4)1 (1.6)0.0002060 (98.4)0 (0.0)1 (1.6)8e-0537 (97.4)1 (2.6)0.0058Histological type Squamous Cell Adenocarcinoma Non-specific/Mixed95 (33.3)179 (62.8)11 (3.9)21 (39.6)24 (45.3)8 (15.1)0.8525 (39.7)25 (39.7)13 (20.6)0.4632 (52.4)20 (32.8)9 (14.8)0.1224 (63.2)10 (26.3)4 (10.5)0.0053
Image acquisition
All patients had pre-therapy [^18^F]FDG PET with attenuation correction CT. Patients were examined on different PET/CT scanners as per institutional availability: Discovery cohort (ICHNT)—Siemens Biograph 64 (Siemens Healthcare, Erlangen, Germany); KCL—GE Discovery ST (GE Healthcare, Waukesha, Wisconsin, USA), GE Discovery STE; Marsden—Phillips Allegro Body (Phillips Medical Systems, Amsterdam, Netherlands), Phillips Dual GS, Phillips Gemini TF TOF 16, Siemens Biograph 128; Mount Vernon—Siemens Biograph 64, GE Discovery ST, GE Discovery STE; Nottingham – Siemens Biograph 16.
For PET, slice thickness ranged between 2 and 5.15 mm; matrix size ranged between 128 × 128 and 512 × 512. After injection of 350–500 MBq [^18^F]FDG, emission data were acquired (five or six bed positions, 2–4 min per bed position) after a 60–90 min uptake period. In all cases, PET/CT scans were performed from upper thighs to the base of the skull following ≥ 4–6-h fasting and had a measured blood glucose level < 11.0 mmol/l at the time of injection. A non-contrast CT scan (80–140 mA, 100–140 kVp) was conducted for both attenuation correction of PET data and co-registration with PET images. The PET data were reconstructed using Ordered Subset Expectation Maximization (OSEM) iterative reconstruction and were attenuation-corrected using the CT data.
To account for inter-scanner variability, imaging data were harmonised using voxel resampling and intensity normalisation during pre-processing and ComBat post-radiomics feature extraction [22], in keeping with International Biomarker Standardisation Initiative (IBSI) recommendations [23, 24].
Multi-label segmentation
Two expert readers, blinded to clinical and histological data, with 13 and 8 years of professional experience, double reviewed all scans, and performed semi-automated segmentation of the primary tumour using metabolic tumour volume 40% SUV_max_ (MTV40) threshold, in keeping with literature recommendation [25]. Additional volumes of interests (VOI) were acquired from the peri-tumoural penumbra as annular shells of 1 cm in thickness, and from the background lung parenchyma as spheres of 2 cm in diameter (Fig. 3a). The peri-tumoural annular shells were generated automatically using an isocontour expansion from the primary lesional VOI. Specifically, after the tumour VOI was defined, consecutive annuli of 1 cm thickness were created outward from the lesion boundary by applying automated three-dimensional iso-contours using an in-house Python script, thereby avoiding manual drawing and inter-observer variability for better reproducibility. The lung parenchymal VOI were manually placed by the radiologist reader in the normal-appearing parenchyma of the ipsilateral lung, cross-referencing the attenuation correction CT scan, with their centres located 2 cm beyond the outer edge of the annulus. Matching VOIs were acquired from the attenuation correction CTs and aggregated with PET features. Parts included in the penumbra and lung VOIs which are anatomically outside of the lungs were excluded by user editing. We have adopted this multi-regional approach for its superior model feature explainability, provided by post-hoc feature localisation in the context of intra-tumoural heterogeneity and peri-tumour microenvironment, which is contributing to its growing popularity in NSCLC radiomics literature [14, 26].Fig. 3a. Multi-label segmentation for radiomics feature extraction showing the three volumes of interests (VOI). b. RPV and nLCEV development and testing pipeline. c. Constituent radiomic features of RPV: texture features deriving from the annulus VOI on CT followed by first order-wavelet and fractal features from the lesion VOI on CT, and texture-wavelet features from the annulus VOI on [^18^F]FDG PET
All primary tumour delineations were made on 3DSlicer (Slicer Community, Boston, USA) [27], with supplementary VOIs computed using our in-house code implemented in Python 3.7 (Python Software Foundation, Wilmington, USA) and doubly verified by the same two expert readers. To ascertain inter-observer reproducibility, radiomic features was assessed by calculating the intraclass correlation coefficient (ICC), based on a two-way random model and only those with an ICC score ≥ 0.8 were retained, in keeping with literature [21, 23].
Image processing and radiomic features extraction
After segmentation, the imaging data were pre-processed to ensure uniform voxel size of 3 × 3 × 5 mm and analysed for a total of 3,996 radiomic features from each patient case (666 features per VOI per imaging modality), using an in-house software (TexLab 2.0), implemented in Matlab 2020b (MathWorks Inc., Natick, MA), and previously validated in various studies [11, 14, 28, 29]. Anisotropic voxel resampling was employed to preserve the native spatial resolution of the PET/CT images as much as possible, to minimise resampling-related artefacts and maintain anatomical fidelity, particularly in the z-axis where the voxel size was larger. While the IBSI recommends isotropic resampling for feature standardisation [23], we prioritised retention of native imaging characteristics to ensure robustness across clinically acquired, anisotropically reconstructed datasets.
The choice of using our in-house radiomics tool, TexLab 2.0, is to allow for greater flexibility in implementing region-specific discretisation strategies, tailored filtering operations, and spatial feature localisation, which are not natively supported in standard open-source tools such as PyRadiomics. The in-house pipeline also enabled closer integration with our pre-existing imaging workflow and facilitated enhanced traceability of feature calculations, ensuring consistency across diverse imaging modalities and institutional datasets. The computed features included ones pertaining to FDG avidity, radiodensity, shape, texture, and those from wavelet or Laplacian of Gaussian (LoG) transformed images which are IBSI compliant [23, 24]. We have additionally extracted an additional texture descriptor not yet covered by IBSI, fractal dimension (FD), to capture complex spatial patterns not well characterised by traditional metrics, as demonstrated in several NSCLC radiomics applications [30–32]. This was computed using a box-counting algorithm, which involved overlaying grids of varying box sizes over the VOI and computing the number of boxes required \documentclass[12pt]{minimal} \usepackage{amsmath} \usepackage{wasysym} \usepackage{amsfonts} \usepackage{amssymb} \usepackage{amsbsy} \usepackage{mathrsfs} \usepackage{upgreek} \setlength{\oddsidemargin}{-69pt} \begin{document}$$N(\varepsilon )$$\end{document} to cover the object as a function of box size \documentclass[12pt]{minimal} \usepackage{amsmath} \usepackage{wasysym} \usepackage{amsfonts} \usepackage{amssymb} \usepackage{amsbsy} \usepackage{mathrsfs} \usepackage{upgreek} \setlength{\oddsidemargin}{-69pt} \begin{document}$$\varepsilon$$\end{document} . FD was then estimated as the negative slope of the linear regression line fitted to the log–log plot of \documentclass[12pt]{minimal} \usepackage{amsmath} \usepackage{wasysym} \usepackage{amsfonts} \usepackage{amssymb} \usepackage{amsbsy} \usepackage{mathrsfs} \usepackage{upgreek} \setlength{\oddsidemargin}{-69pt} \begin{document}$$\mathrm{log}(N\left(\varepsilon \right))$$\end{document} versus \documentclass[12pt]{minimal} \usepackage{amsmath} \usepackage{wasysym} \usepackage{amsfonts} \usepackage{amssymb} \usepackage{amsbsy} \usepackage{mathrsfs} \usepackage{upgreek} \setlength{\oddsidemargin}{-69pt} \begin{document}$$\mathrm{log}(1/\varepsilon )$$\end{document} .
Following their extraction, the computed radiomic features were standardised to a mean of zero and standard deviation (SD) of one. There were 2,178 features found to have an ICC score ≥ 0.8, thus deemed reproducible and passed onto subsequent model development steps including full dimensionality reduction and regression.
To address collinearity among extracted radiomic features, we computed pairwise Pearson correlation coefficients across all features within the training set. Features exhibiting high linear correlation (|r|> 0.9) were considered redundant; in such cases, one feature from each highly correlated pair was removed based on domain relevance and variance. We then performed univariable Cox regression on each retained radiomic feature, eliminating features with a false detection rate (FDR) of greater than 1%. These filtering steps were performed prior to any model training, to reduce multicollinearity, minimise overfitting, and enhance model interpretability [33]. The resulting subset of 87 filtered features was then standardised (z-score normalised) and used for subsequent predictive modelling.
Model development and validation
The biomarker development pipeline is presented in Fig. 3b., where we used elastic net regularisation and regression to develop a radiomics predictive vector (RPV) with patient overall survival as the response vector. Using multivariable Cox modelling, this was combined with NHOC and clinical features which were deemed statistically significant on Cox analyses, to develop a composite non-invasive lung cancer evolution vector (nLCEV) for patient prognostication. Biomarker performance was tested by stratifying the patients into a high- and low-risk group using k-means clustering based on nLCEV. Performance was assessed in both the internal and external validation cohorts.
Normalised hotspot to centroid distance (NHOC)
The Hotspot to Centroid (HOC) distance is calculated as [18]:
\documentclass[12pt]{minimal} \usepackage{amsmath} \usepackage{wasysym} \usepackage{amsfonts} \usepackage{amssymb} \usepackage{amsbsy} \usepackage{mathrsfs} \usepackage{upgreek} \setlength{\oddsidemargin}{-69pt} \begin{document}$$HOC=\sqrt{{\left({x}_{sm}-{x}_{c}\right)}^{2}+{\left({y}_{sm}-{y}_{c}\right)}^{2}+{\left({z}_{sm}-{z}_{c}\right)}^{2}}$$\end{document}where \documentclass[12pt]{minimal} \usepackage{amsmath} \usepackage{wasysym} \usepackage{amsfonts} \usepackage{amssymb} \usepackage{amsbsy} \usepackage{mathrsfs} \usepackage{upgreek} \setlength{\oddsidemargin}{-69pt} \begin{document}$${x}_{sm}$$\end{document} , \documentclass[12pt]{minimal} \usepackage{amsmath} \usepackage{wasysym} \usepackage{amsfonts} \usepackage{amssymb} \usepackage{amsbsy} \usepackage{mathrsfs} \usepackage{upgreek} \setlength{\oddsidemargin}{-69pt} \begin{document}$${y}_{sm}$$\end{document} , \documentclass[12pt]{minimal} \usepackage{amsmath} \usepackage{wasysym} \usepackage{amsfonts} \usepackage{amssymb} \usepackage{amsbsy} \usepackage{mathrsfs} \usepackage{upgreek} \setlength{\oddsidemargin}{-69pt} \begin{document}$${z}_{sm}$$\end{document} are the spatial coordinates of the voxel with \documentclass[12pt]{minimal} \usepackage{amsmath} \usepackage{wasysym} \usepackage{amsfonts} \usepackage{amssymb} \usepackage{amsbsy} \usepackage{mathrsfs} \usepackage{upgreek} \setlength{\oddsidemargin}{-69pt} \begin{document}$$SU{V}_{max}$$\end{document} ; and \documentclass[12pt]{minimal} \usepackage{amsmath} \usepackage{wasysym} \usepackage{amsfonts} \usepackage{amssymb} \usepackage{amsbsy} \usepackage{mathrsfs} \usepackage{upgreek} \setlength{\oddsidemargin}{-69pt} \begin{document}$${x}_{c}$$\end{document} , \documentclass[12pt]{minimal} \usepackage{amsmath} \usepackage{wasysym} \usepackage{amsfonts} \usepackage{amssymb} \usepackage{amsbsy} \usepackage{mathrsfs} \usepackage{upgreek} \setlength{\oddsidemargin}{-69pt} \begin{document}$${y}_{c}$$\end{document} , \documentclass[12pt]{minimal} \usepackage{amsmath} \usepackage{wasysym} \usepackage{amsfonts} \usepackage{amssymb} \usepackage{amsbsy} \usepackage{mathrsfs} \usepackage{upgreek} \setlength{\oddsidemargin}{-69pt} \begin{document}$${z}_{c}$$\end{document} are those of the geometric centroid of the tumour.
To account for the difference in tumour size, HOC is normalised to MSR, giving normalised HOC (NHOC):
\documentclass[12pt]{minimal} \usepackage{amsmath} \usepackage{wasysym} \usepackage{amsfonts} \usepackage{amssymb} \usepackage{amsbsy} \usepackage{mathrsfs} \usepackage{upgreek} \setlength{\oddsidemargin}{-69pt} \begin{document}$$NHOC=\frac{HOC}{MSR}$$\end{document}where \documentclass[12pt]{minimal} \usepackage{amsmath} \usepackage{wasysym} \usepackage{amsfonts} \usepackage{amssymb} \usepackage{amsbsy} \usepackage{mathrsfs} \usepackage{upgreek} \setlength{\oddsidemargin}{-69pt} \begin{document}$$MSR={\left(\frac{3}{4\pi }MV\right)}^\frac{1}{3}$$\end{document} for a spherical tumour shape approximation such that metabolic volume (MV): \documentclass[12pt]{minimal} \usepackage{amsmath} \usepackage{wasysym} \usepackage{amsfonts} \usepackage{amssymb} \usepackage{amsbsy} \usepackage{mathrsfs} \usepackage{upgreek} \setlength{\oddsidemargin}{-69pt} \begin{document}$$MV=N\times {V}_{v}$$\end{document} , where \documentclass[12pt]{minimal} \usepackage{amsmath} \usepackage{wasysym} \usepackage{amsfonts} \usepackage{amssymb} \usepackage{amsbsy} \usepackage{mathrsfs} \usepackage{upgreek} \setlength{\oddsidemargin}{-69pt} \begin{document}$$N$$\end{document} and \documentclass[12pt]{minimal} \usepackage{amsmath} \usepackage{wasysym} \usepackage{amsfonts} \usepackage{amssymb} \usepackage{amsbsy} \usepackage{mathrsfs} \usepackage{upgreek} \setlength{\oddsidemargin}{-69pt} \begin{document}$${V}_{v}$$\end{document} are the number of FDG avid voxels and voxel size, respectively.
Biomarker benchmarking
SUV_max_, MTV, total lesion glycolysis (TLG). and disease stage are known prognostic predictors for NSCLC [34–36]. To establish the novelty of our proposed biomarkers, we investigated how they performed compared to these more conventional prognostic metrics. This includes SUV_max_ and a composite disease stage-metabolic model (SMM), which was imputed based on tumour stage, SUV_max_, MTV, and TLG, using multivariable Cox regression based on the training set.
Statistical analysis
All statistical analyses were performed using R version 4.3.0 (R Project for Statistical Computing, http://www.r-project.org/). Univariable and multivariable Cox regression models were used to evaluate RPV, NHOC and various clinical features (age, performance status and disease stage) in terms of their relevance to patient survival. Kaplan–Meier plots were used to evaluate the models’ utility for patient prognostication, and log-rank test was used to assess the survival curve differences. Receiver operating characteristics (ROC) analysis was used to assess the predictive performance of RPV and nLCEV and quantified as area under the curve (AUC). A statistical significance threshold of 5% was adopted throughout.
Results
Comparing to discovery, the testing cohorts were statistically different in at least one element of disease stage; Mount Vernon and Nottingham were additionally statistically different in patient age and NSCLC histological subtype, respectively.
nLCEV is based on NHOC, clinical features and RPV, which is a 9-feature radiomics vector (Fig. 3c), consists of features derived from the three VOIs, including texture features deriving from the annulus VOI on CT, first order-wavelet and fractal features from the lesion VOI on CT, and texture-wavelet features from the annulus VOI on [^18^F]FDG PET.
Univariable and multivariable Cox regression analyses identified clinical features with statistical significance (Fig. 4): tumour staging and RPV were deemed significant (p < 0.05) in both univariable and multivariable regressions and NHOC in univariable regression. Disease staging was therefore used in the development of nLCEV.Fig. 4a. Univariable and b. multivariable Cox regression of key clinical features, RPV and NHOC, showing the statistical significance of tumour stage, RPV and NHOC in univariable Cox and tumour stage and RPV in multivariable Cox models
NHOC and RPV both demonstrated statistically significant Cox hazard ratios (HR): HR [95% confidence interval] 2.52 [1.60, 3.98] and 2.68 [2.13, 3.38], respectively. Neither NHOC nor RPV were strongly correlated with lesional VOI volume to suggest intermetric surrogacy, with a Pearson’s correlation coefficient (PCC) of 0.404 and 0.583, respectively. NHOC produced an area under the receiver operating characteristic curve (AUC) [95% confidence interval] of 0.68 [0.51, 0.85] for predicting patients’ overall survival at 3 years, RPV 0.72 [0.55, 0.89] and nLCEV the highest AUC at 0.76 [0.60, 0.92], compared to that of SUV_max_ 0.66 [0.49, 0.84] (Fig. 5). Statistically significant stratification of the patients into high and low risk groups was achieved using nLCEV in the discovery and all external testing cohorts (p-value < 0.05, Fig. 6), with reasonable Cox hazard ratios (HR): discovery 3.14 [2.10, 4.69], KCL 3.27 [1.31, 8.16], Marsden 2.21 [1.02, 4.78], Mount Vernon 2.60 [1.42, 4.76], and Nottingham 4.14 [1.44, 11.90], which are consistently higher than the corresponding HRs achieved using SUV_max_ (Fig. 7). Additionally, SUV_max_ has not achieved statistically significant prognostic stratification in the Marsden and Nottingham cohorts (Fig. 7c and e).Fig. 5. Receiver operating characteristics (ROC) analysis for evaluating the predictive performance for patients’ 3-year overall survival in the internal validation cohort by a. SUV_max_, b. NHOC, c. RPV and d. nLCEV; with nLCEV achieving the highest area under the curve (AUC) at 0.76 [0.60, 0.92]Fig. 6. Performance of nLCEV for patient prognostication in the discovery and external validation cohorts: a. discovery, b. KCL, c. Marsden, d. Mount Vernon, and e. Nottingham. nLCEV achieved patient stratification into high and low risk groups with statistical significance (p < 0.05) in all cohortsFig. 7Performance of SUV_max_ for patient prognostication in the discovery and external validation cohorts: a. discovery, b. KCL, c. Marsden, d. Mount Vernon, and e. Nottingham. In addition to having HRs lower than that of nLCEV, SUV_max_ has not achieved statistically significant prognostic stratification (p < 0.05) in the Marsden and Nottingham cohorts
Whilst SMM has achieved an AUC of 0.68 (95% CI [0.61, 0.74]) (Fig. 8), it remains inferior to nLCEV’s 0.76 (95%CI [0.60, 0.92]). More notably, similar to what we had observed with SUV_max_, SMM demonstrated inferior robustness compared to nLCEV, as it failed to achieve effective prognostic stratification in the external validation cohorts (KCL: p = 0.6, Marsden: p = 0.3, Mount Vernon: p = 0.066, Nottingham: p > 0.9; Fig. 9).Fig. 8. Receiver operating characteristics (ROC) analysis for evaluating the predictive performance for patients’ 3-year overall survival in the internal validation cohort by SMM. With an area under the curve (AUC) of 0.68 (95% CI [0.61, 0.74]); SMM was inferior to nLCEV’s AUC of 0.76 (95%CI [0.60, 0.92])Fig. 9. Performance of disease stage-metabolic model (SMM) for patient prognostication in the discovery and external validation cohorts: a. discovery, b. KCL, c. Marsden, d. Mount Vernon, and e. Nottingham. Whilst achieving effective prognostic stratification in discovery, it has failed to achieve similar performance in the external validation cohorts
Discussion
Most known prognostic radiomic features are not derived from comprehensible cancer phenotypes and thus carry limited causal justification to support their biological validity, which has been highlighted as a key burden to their clinical adoption [37–39]. In this study, we have demonstrated in NSCLC the prognostic utility of NHOC, a cancer biology–inspired metric of spatial differences in tumour architecture. Building on this concept, we developed a composite non-invasive lung cancer prognostic vector, nLCEV, by aggregating the prognostic power of NHOC with that of [^18^F]FDG PET and CT radiomics, and tumour staging. Specifically, fractal and wavelet [^18^F]FDG PET features from the perilesional annulus, CT texture features from the lesion and perilesional annulus were retained in the radiomics prognostic signature. NHOC and RPV were both significant in Cox regression models, alongside tumour stage; these were integrated in nLCEV, which outperforms both RPV and NHOC and achieved effective patient prognostication in all four independent external testing sets. The external testing sets have various statistically significant different patient and disease characteristics to those of the discovery cohort; the successful validation of the biomarkers in these cohorts therefore supports their overall robustness. The observed distributional differences between discovery and testing cohorts provide a more rigorous assessment of model generalisability across diverse clinical settings. Evaluating performance on cohorts that differ from the training set in clinically relevant variables helps to identify potential overfitting and ensures the robustness of predictive features beyond the original dataset. This approach also mirrors real-world deployment scenarios, where patient populations, imaging protocols, and disease characteristics often vary across institutions. Through this work, we have additionally developed a software for computer-assisted multi-label VOI segmentation and feature extraction on PET-CT, to aid in the clinical deployment of the innovations this paper presents.
The differences observed between the survival characteristics of the Marsden and Nottingham cohorts (Figs. 6, 7 and 9) might be attributable to their variations in tumour stage and histological composition. The Marsden cohort included more patients with both early (T1: 17.5% vs. 7.9%) and advanced (T4: 28.6% vs. 5.3%) disease compared to Nottingham. Additionally, there were differences in histological subtype distribution, with fewer squamous cell carcinomas (39.7% vs. 63.2%) and more adenocarcinomas (39.7% vs. 26.3%) in the Marsden cohort. These differences in case mix likely contributed to the varied results observed in these cohorts.
Prior studies have proposed MTV-derived tumour volume and SUV_max_ as prognostic predictors in NSCLC [40–43]. In our work, we found no strong correlation between our evaluated prognostic metrics (NHOC, RPV) and tumour volume by MTV40 to suggest inter-metric surrogacy. Additionally, these imaging metrics demonstrated better prognostic prediction of patient survival than that by SUV_max_ (Fig. 5), and higher HR in the prognostic stratification of patient risk groups (Figs. 6 and 7). The best performing biomarker, nLCEV, incorporates disease stage, itself a well-established prognostic factor [36]. The demonstrated superiority of nLCEV over SMM (Figs. 8 and 9), a multivariable signature derived from stage, SUV_max_, MTV, and TLG, shows that nLCEV provides added prognostic value beyond what can be achieved by conventional clinical and imaging metrics alone.
Previously, [^18^F]FDG PET metrics found to be the most prognostic significance included \documentclass[12pt]{minimal} \usepackage{amsmath} \usepackage{wasysym} \usepackage{amsfonts} \usepackage{amssymb} \usepackage{amsbsy} \usepackage{mathrsfs} \usepackage{upgreek} \setlength{\oddsidemargin}{-69pt} \begin{document}$${\mathrm{SUV}}_{max}$$\end{document} and TLG, which were associated with shorter progression-free survival (PFS) and OS [44]; texture-entropy, which was associated with poorer response to treatment [45], and MTV, which correlated with worse patient prognosis and was thought to suggest higher tumour burden [46]. In our study, we found two enriched [^18^F]FDG PET radiomic features, both are wavelet-transformed texture features extracted from the peri-lesional annulus VOI, one of which, GLSZM SzVarianc HHL, carries the highest weight of all constituent features in RPV. These observations are concordant with the underlying hypothesis behind NHOC, such that the clonal drift of cancer cells towards the tumour periphery is associated with a worse patient prognosis [47]. Additionally, the greatest number of the retained features (n = 4) belonged to the texture feature class from the peri-lesional annulus VOI on CT, which would support a hypothesised peripheral distribution of the most prognostic cancer cells. This is further reinforced by the observation that all enriched features derived from the peri-lesional VOI on [^18^F]FDG PET and CT carried positive weights whereas the three features derived from the lesion VOI on CT carried negative weights, which proposes a positive dependency of patient mortality on the former and a negative one on the latter.
Literature on using [^18^F]FDG PET/CT radiomics for NSCLC prognostication has expanded rapidly in recent years [38, 48]. For surgical cases, pre-operative PET/CT radiomics have predicted disease-free survival to an AUC of 0.68 [0.58, 0.74] [49]. Pre-therapy PET radiomics predicted the survival of metastatic NSCLC to an AUC of 0.70 [50]. Despite the relative abundance of radiomics literature, few studies have presented models validated on independent test data, and even rarer are those validated on data drawn from multiple sources [11], a key strength of nLCEV. Comparing to an earlier work drawn from similar data [11], our proposed composite biomarker, nLCEV, was developed without training–testing data mixing, demonstrated site-specific robustness, with effective prognostication in multiple external validation datasets individually, as well as offering better biological explainability.
Imaging-based metrics such as radiomics offer a non-invasive way of assessing neoplasms at the time of diagnosis. This can aid in clinical decision making, particularly in cases where tissue sampling is challenging or yields equivocal findings. The information presented by these measurements can additionally give insight into tumour composition and metabolism, thereby advancing an understanding of cancer biology that is not otherwise achievable in vivo. Compared to conventional radiomics practice dominated by data mining of a high-order data space constructed from multi-class multi-label radiomic features, which can be burdened by feature redundancy, the curse of dimensionality and risk of overfitting [4], our method of incorporating NHOC, a novel mathematical descriptor of intratumoural spatial organisation motivated by cancer biology, introduces an element of causal reasoning [51], which helps to avoid spurious conclusions arising out of confounding or less biologically meaningful statistical associations. Before undertaking their testing in prospective randomised interventional trials, this approach can also enable the prediction of outcomes to hypothetical interventions or counterfactuals, such as by predicting the efficacy of imaging/machine learning-supported treatment decisions.
In contrast to conventional, or hand-crafted, radiomics, deep learning-derived features are gaining prominence in recent literature due to their ability to automatically learn complex, high-dimensional representations from imaging data without the need for manual feature engineering [52–54]. However, they lack the interpretability of their hand-crafted counterparts [52]. To mitigate this limitation, post-hoc methods such as saliency maps, SHapley Additive exPlanations (SHAP), Local Interpretable Model-agnostic Explanations (LIME), and Gradient-weighted Class Activation Mapping (Grad-CAM) can be employed [55], some of which can also be applied to less interpretable models involving hand-crafted radiomics features [56, 57]. While these techniques can highlight associations between input features and model predictions, they do not necessarily provide mechanistic insight or causal linkage to disease processes [58]. Departing from purely data-driven strategies, our approach incorporates a biologically grounded imaging metric, NHOC, shifting the emphasis from correlation-based interpretation to hypothesis-driven feature design, a distinction that is critical for enhancing model transparency and trustworthiness [59]. Our method notably delivers explainability by embedding biological justification at the feature construction stage, rather than relying solely on retrospective model interrogation.
Although NHOC was originally postulated to reflect clonal competition between neoplastic subpopulations, it does not allow their direct visualisation, which would likely require additional imaging tracers. While motivated by concepts of cancer biology, NHOC should not yet be regarded as a validated biology-derived metric, but rather as an imaging-based surrogate of spatial heterogeneity holding prognostic relevance. Additional limitations of this study include its retrospective nature and the relatively small size of the external testing sets, warranting wider scale external validation. The study is also limited by the exclusion of cases with low [^18^F]FDG avidity barring reliable segmentation on PET. This latter group represented adenocarcinoma cases with generally longer observed survival than the rest [60]. On this note, we acknowledge the marked clinical and histological heterogeneity of adenocarcinoma-spectrum disease, not all of which can be reliably and prognostically assessed on [^18^F]FDG PET, a notable limitation of the modality in this clinical context [61]. Radiomic features can be affected by the type of CT scanner and scanning protocol used [62]. However, we have previously shown an [^18^F]FDG PET/CT derived radiomics feature vector to be invariant to PET/CT scanner type and slice thickness [11]. We have further ascertained feature reproducibility in this study by including only features meeting an ICC score threshold. To verify its generalisability and robustness, the biomarker was validated on external testing data acquired in four independent institutions with different scanners and scanning protocols, and varied patient and disease characteristics.
Future works include testing the biomarkers prospectively and evaluating its utility in clinical practice, integration with other validated imaging prognostic metrics in cancer such as sarcopenia [63], delta radiomics [64], and cancer biology correlates through spatial and transcriptomics mapping [65]. Additionally, intra-tumoural biological heterogeneity is becoming increasingly recognised for its key role in determining therapeutic response and resistance in NSCLC [66, 67]. We have conducted in an internally validated pilot study demonstrating the potential utility of integrating histological tumour features to enhance the performance of nLCEV (see Supplementary materials). Future work could therefore also include collecting and integrating biological measures of intra-tumoural heterogeneity, from histological and molecular domains, to deliver better prognostic biomarkers with enhanced biological explainability.
A limitation of this study is that the imaging metrics examined, including NHOC, SUVmax, MTV, and TLG, were derived solely from the primary tumour. This approach does not account for metastatic disease burden or inter-lesional heterogeneity, both of which are becoming increasingly recognised as important prognostic factors in NSCLC [68]. Recent advances in AI-based PET/CT analysis allow for automated, whole-body quantification of MTV and TLG across all metastatic sites [69, 70]. Incorporating such whole-body metrics may provide a more complete representation of tumour biology and patient prognosis. Our proposed framework could, in principle, be extended to include all metastatic lesions, and future work could focus on evaluating its utility in this broader context.
In conclusion, NHOC enhances NSCLC patient survival prediction, and when integrated with PET-CT radiomics and disease stage, offers a robust, non-invasive approach to disease prognostication, with consistent performance demonstrated across multiple independent external cohorts.
Supplementary Information
Below is the link to the electronic supplementary material.Supplementary file1 (DOCX 1.09 MB)
The reference list from the paper itself. Each links out to its DOI / PubMed record.
- 1Cancer Research UK. Types of lung cancer [Internet]. 2019. [cited 2021 Aug 23]. https://www.cancerresearchuk.org/about-cancer/lung-cancer/stages-types-grades/types. Accessed 23 Aug 2021.
- 2Polanco D, Pinilla L, Gracia-Lavedan E, Mas A, Bertran S, Fierro G, et al. Prognostic value of symptoms at lung cancer diagnosis: a three-year observational study. J Thorac Dis [Internet]. AME Publications; 2021 [cited 2024 Sep 24];13:1485. 10.21037/JTD-20-3075.10.21037/jtd-20-3075 PMC 802480433841941 · doi ↗ · pubmed ↗
- 3Cho H ho, Lee HY, Kim E, Lee G, Kim J, Kwon J, et al. Radiomics-guided deep neural networks stratify lung adenocarcinoma prognosis from CT scans. Commun Biol [Internet]. Nature Publishing Group; 2021 [cited 2023 Apr 12];4:1–12. 10.1038/s 42003-021-02814-7.10.1038/s 42003-021-02814-7PMC 859000234773070 · doi ↗ · pubmed ↗
- 4Kang W, Qiu X, Luo Y, Luo J, Liu Y, Xi J, et al. Application of radiomics-based multiomics combinations in the tumor microenvironment and cancer prognosis. J Transl Med [Internet]. Bio Med Central Ltd; 2023 [cited 2024 Feb 4];21:1–20. 10.1186/S 12967-023-04437-4/FIGURES/3.10.1186/s 12967-023-04437-4PMC 1048157937674169 · doi ↗ · pubmed ↗
- 5Hannequin P, Decroisette C, Kermanach P, Berardi G, Bourbonne V. FDG PET and CT radiomics in diagnosis and prognosis of non-small-cell lung cancer. Transl Lung Cancer Res [Internet]. AME Publishing Company; 2022 [cited 2023 Nov 5];11:2051–63. 10.21037/TLCR-22-158/COIF.10.21037/tlcr-22-158PMC 964104536386457 · doi ↗ · pubmed ↗
- 6Al Doori L, Evanson D, Revheim M-E, Saboury B, Alavi A, Torigian D. Advancements in [18F]FDG-PET/CT radiomics and machine learning for non-small cell lung cancer. J Nucl Med [Internet]. Society of Nuclear Medicine; 2024 [cited 2025 Jan 13];65:241765–241765. https://jnm.snmjournals.org/content/65/supplement_2/241765. Accessed 13 Jan 2025.
- 7Boubnovski Martell M, Linton-Reid K, Hindocha S, Chen M, Moreno P, Álvarez‐Benito M, et al. Deep representation learning of tissue metabolome and computed tomography annotates NSCLC classification and prognosis. NPJ Precis Oncol [Internet]. Nature Publishing Group; 2024 [cited 2024 Feb 4];8:1–14. 10.1038/s 41698-024-00502-3.10.1038/s 41698-024-00502-3PMC 1083828238310164 · doi ↗ · pubmed ↗
- 8Lu H, Lou H, Wengert G, Paudel R, Patel N, Desai S, et al. Tumor and local lymphoid tissue interaction determines prognosis in high-grade serous ovarian cancer. Cell Rep Med. Cell Press; 2023;4:101092. 10.1016/J.XCRM.2023.101092.10.1016/j.xcrm.2023.101092 PMC 1039417337348499 · doi ↗ · pubmed ↗