Association of small intestinal bacterial overgrowth with portal hypertension in HCV-related cirrhosis: a cross-sectional study
Tary Salman, Gasser El-Azab, Fatma Khalil, Reham Elkazaz, Abdelaleem Helal

TL;DR
This study shows that small intestinal bacterial overgrowth is more common in HCV-related cirrhosis patients with portal hypertension and highlights key predictors like age and disease severity.
Contribution
The study identifies a strong link between SIBO and portal hypertension in HCV-related cirrhosis and provides independent predictors for SIBO in this population.
Findings
SIBO was detected in 63% of cirrhotic patients with portal hypertension, compared to 41.7% without and 6.7% in controls.
Age, FIB-4, MELD score, and portal hypertension were independent predictors of SIBO.
HCV RNA presence was significantly associated with higher SIBO prevalence and bacterial counts.
Abstract
Small intestinal bacterial overgrowth (SIBO) is a frequent and clinically significant complication in patients with liver cirrhosis. However, its association with portal hypertension (PH) in HCV-related cirrhosis remains underexplored. To determine the prevalence, predictors, and clinical associations of SIBO in patients with HCV-related cirrhosis, with particular emphasis on its relationship to portal hypertension. In this cross-sectional study, we evaluated 90 patients with HCV-related cirrhosis and 30 control subjects without liver disease. SIBO was diagnosed using quantitative duodenal aspirate cultures. Clinical, laboratory, and endoscopic data were collected. Multivariate logistic regression was performed to identify independent predictors of SIBO. SIBO was detected in 63% of cirrhotic patients with portal hypertension, 41.7% of those without portal hypertension, and 6.7% of…
Genes, proteins, chemicals, diseases, species, mutations and cell lines named across the full text — each resolved to its canonical identifier and authoritative record.
Click any figure to enlarge with its caption.
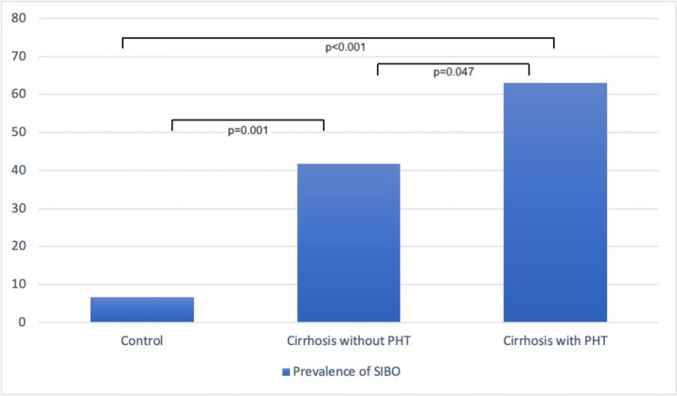 Figure 1
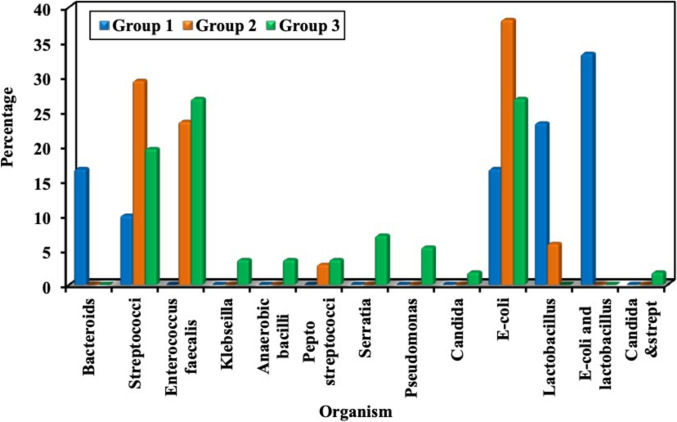 Figure 2
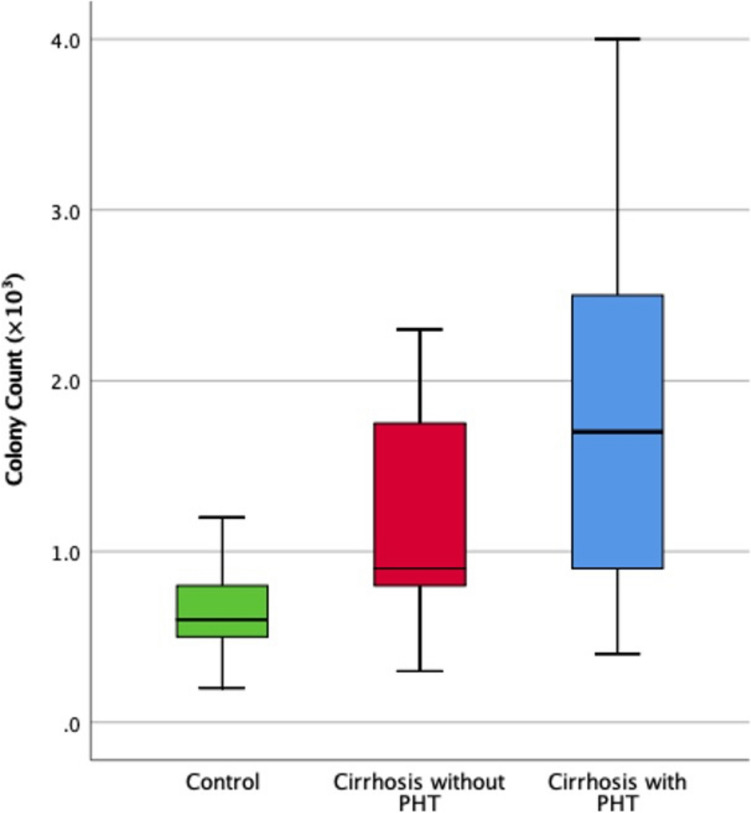 Figure 3
Peer Reviews
No public reviews on file for this paper yet. If you reviewed it on a platform where reviews are public (OpenReview, ICLR, NeurIPS, ICML), you can paste yours below so the community can read it here.
Videos
No videos yet. Explain this paper in a talk, walkthrough, or lecture? Add one.
Taxonomy
TopicsLiver Disease and Transplantation · Liver Disease Diagnosis and Treatment · Clinical Nutrition and Gastroenterology
Introduction
Small Intestinal Bacterial Overgrowth (SIBO) is increasingly recognized as a significant contributor to the pathophysiology of chronic liver disease (CLD), particularly in patients with cirrhosis and portal hypertension. SIBO refers to an abnormal increase in the microbial population within the small intestine, which disrupts gut homeostasis and contributes to systemic complications through bacterial translocation and inflammatory pathways [1]. The prevalence of SIBO in patients with CLD is notably high, with a pooled analysis estimating an eightfold increase compared to healthy controls [2].
In cirrhosis, progressive liver dysfunction leads to alterations in the gut-liver axis, including intestinal dysbiosis, increased gut permeability, and impaired immune defenses. These changes facilitate bacterial translocation from the gut lumen into systemic circulation, exacerbating complications such as portal hypertension, hepatic encephalopathy (HE), and spontaneous bacterial peritonitis (SBP) [3]. A systematic review demonstrated that SIBO prevalence was significantly higher in patients with decompensated cirrhosis compared to those with compensated cirrhosis (odds ratio (OR) = 2.6; 95% CI 1.5–4.5), underscoring its association with disease progression.
Portal hypertension itself has been implicated as a key driver of gut dysbiosis in cirrhosis. A study analyzing gut microbiota composition revealed significant differences between patients with portal hypertension and healthy controls, highlighting an increase in pathogenic bacteria such as Streptococcus and Enterococcus and a reduction in beneficial commensals like Faecalibacterium and Roseburia [4]. In another study, SIBO was found to be more prevalent in patients with portal hypertension (OR = 2.1; 95% CI 1.4–3.1), suggesting that portal hypertension may exacerbate intestinal dysbiosis or vice versa. Among complications of portal hypertension, SBP had the highest prevalence of SIBO at 57.7%, followed by HE at 41.0% and variceal bleeding at 39.5% [2].
Despite these insights, the interplay between SIBO and portal hypertension remains incompletely understood. While portal hypertension appears to drive gut dysbiosis through mechanisms such as intestinal congestion and impaired motility [4], it is also plausible that SIBO exacerbates portal hypertension by contributing to systemic inflammation and endothelial dysfunction [5]. This bidirectional relationship warrants further investigation using robust diagnostic methods such as duodenal aspirate cultures, which provide definitive evidence of bacterial overgrowth compared to less specific tests like breath analysis [6].
This study aims to explore the association between SIBO and portal hypertension in hepatitis C virus (HCV)-related cirrhosis using duodenal aspirate cultures for SIBO diagnosis.
Patients and methods
Study type
This was a cross-sectional observational study. Participants with HCV-related cirrhosis were divided into groups based on their portal hypertension status, in addition to a control group undergoing endoscopy for non-liver disease indications.
Study population
The study population included adults (≥ 18 years old) and comprised three groups.
Group 1: non-liver disease controls
This group included adults undergoing upper GI endoscopy for reasons other than known or suspected liver disease or portal hypertension.
Group 2: HCV-related cirrhosis without portal hypertension
This group included patients with a confirmed diagnosis of HCV-related cirrhosis who exhibited no clinical, laboratory, or imaging evidence of portal hypertension.
Group 3: HCV-related cirrhosis with portal hypertension
HCV-related liver cirrhosis was diagnosed based on histological evidence from liver biopsy (if available), clinical signs of cirrhosis, and/or FibroScan with a liver stiffness measurement (LSM) > 12.5 kPa [7, 8]. Patients were also positive for HCV antibody and had detectable HCV RNA (or had a history of successful treatment for HCV).
Portal hypertension was defined by at least one of the following criteria: esophageal or gastric varices identified on endoscopy, history of variceal bleeding, ascites (current or past history), LSM ≥ 20 kPa, splenomegaly (spleen size > 13 cm by ultrasound), or platelet count < 150,000/μL [9, 10].
All groups shared the following exclusion criteria: history of other chronic liver diseases (e.g., autoimmune hepatitis, primary biliary cholangitis, hemochromatosis), co-infection with hepatitis B virus (HBV) or human immunodeficiency virus (HIV), history of gastrointestinal surgery (e.g., gastric resection, bariatric surgery, small bowel resection), active malignancy, inflammatory bowel disease, use of antibiotics, probiotics, prebiotics, or intestinal motility agents within 3 months before enrollment, recent gastrointestinal bleeding, use of proton pump inhibitors (PPIs) or H2-receptor antagonists within 1 month before enrollment, pregnancy or breastfeeding, diabetes mellitus, and significant recent alcohol intake (defined as > 20 g/day for females and > 30 g/day for males within the past 6 months) or active drug abuse.
Recruitment and enrollment
Participants were recruited from the endoscopy unit, Gastroenterology and Hepatology Department, National Liver Institute, Menoufia University, Egypt. Potential participants were screened for eligibility based on inclusion/exclusion criteria, and eligible patients were invited to participate in the study and provided written informed consent.
Demographic and clinical data
Data collected included age, sex, medical history, medications, alcohol and tobacco use, and history of liver disease complications (e.g., ascites, variceal bleeding, hepatic encephalopathy) for cirrhosis groups. Information on prior HCV antiviral therapy and sustained virological response (SVR) status was also obtained. The physical examination included the assessment of ascites, splenomegaly, and other signs of liver disease for the cirrhosis groups. Body mass index (BMI) was calculated as weight (in kilograms) divided by height (in meters) squared. In patients with ascites, BMI was adjusted using estimated dry weight, obtained by subtracting 5%, 10%, or 15% of body weight for mild, moderate, or severe ascites, respectively, with an additional 5% deducted if bilateral pedal edema was present [11, 12].
Laboratory data
The laboratory data included Complete blood count (CBC) with differential, FBS and Hba1c, Comprehensive metabolic panel (CMP), including liver function tests (ALT, AST, alkaline phosphatase, bilirubin, albumin), INR, alpha-fetoprotein (AFP), Renal function tests (creatinine, BUN) and Viral markers (HCV Ab/PCR, HBsAg), C-reactive protein (CRP).
Abdominal ultrasound and liver stiffness measurement
All patients underwent abdominal ultrasonography using a GE LOGIQ 9 machine. Liver stiffness measurement was performed using FibroScan with the FibroScan Medium (M +) probe and 5.02 Touch operating software (Echosens, France). The procedure followed established guidelines, ensuring at least 10 valid measurements per patient. Liver stiffness values were expressed in kilopascals (kPa), and the controlled attenuation parameter (CAP) values were recorded to assess hepatic steatosis.
Assessment of portal hypertension and severity of liver disease
Portal hypertension was assessed clinically based on ascites and laboratory parameters, including platelet count. Imaging assessments included measurement of splenic size, Doppler ultrasound to evaluate portal vein diameter and assess for portosystemic shunts [13], and FibroScan to measure liver stiffness [8]. Esophagogastroduodenoscopy (EGD) was performed to detect esophageal and gastric varices [14]. Additionally, the Child–Pugh and Model for End-Stage Liver Disease (MELD) scores were computed to assess liver disease severity [15, 16]. Non-invasive fibrosis scores, including the APRI (AST to Platelet Ratio Index) and FIB-4 scores, were also calculated [17].
Upper endoscopy and duodenal aspiration
EGD was performed to assess for esophageal and gastric varices (for cirrhosis groups), with varices graded according to Paquet classification [18]. Endoscopic procedures were conducted by experienced operators who were not involved in outcome assessment or data analysis. During EGD, a duodenal aspirate was collected using a sterile technique to minimize contamination. Before the EGD procedure, patients were required to perform their usual oral hygiene, including cleaning the mouth, tongue, and teeth, rinsing their mouth, and gargling their throat with a hexedine solution. Esophagogastroduodenoscopy (PENTAX EG29-i10) was performed with the patient in the left lateral position under light sedation with midazolam. A gastroscope fitted with a double-lumen catheter was used to collect luminal fluid samples from the duodenum. The catheter assembly consisted of two tubes, with the inner tube being 3 cm longer than the outer tube, whose mouth was sealed by an obturator. The endoscopist advanced the scope to the second portion of the duodenum and introduced the catheter through the biopsy channel. The inner catheter was then used to aspirate 1–2 mL of duodenal fluid. The aspirated fluid was collected through the inner tube using a sterile syringe and was transported to the microbiology laboratory for culture and sensitivity testing.
Microbiology analysis
Samples were transported at room temperature and delivered to the microbiology laboratory within three hours of collection. Upon arrival, they were immediately processed for quantitative culture, including aerobic and anaerobic bacterial counts, yeast cultures, and antibiotic sensitivity testing. For anaerobic cultures, samples were plated on kanamycin-vancomycin (KV) blood agar and incubated at 37 °C in a GasPak 100 anaerobic system. Colonies were counted after 48 h. Aerobic cultures were plated on Levine eosin-methylene blue agar (Becton Dickinson) and incubated at 37 °C for 24 h before colony counting. Total bacterial colony counts from all culture conditions were summed and normalized to the volume of undiluted luminal fluid to calculate total colony-forming units per milliliter (CFU/mL) [19, 20]. The microbiologist analyzing duodenal aspirate cultures was blinded to patients' group assignments to minimize observer bias.
SIBO was defined as a total bacterial count of ≥ 10^3^ CFU/mL in the duodenal aspirate [21, 22]. Identified bacterial species were recorded.
Outcome measures
The primary outcome of this study was to compare the prevalence of SIBO in patients with HCV-related cirrhosis, stratified by the presence or absence of portal hypertension.
Secondary outcomes included: identifying specific bacterial species in duodenal aspirates associated with portal hypertension, examining the association between the presence and bacterial load of SIBO (CFU/mL) and history of HE, and exploring potential risk factors for SIBO in patients with HCV-related cirrhosis.
Statistical analysis
Data were analyzed using IBM SPSS Statistics, version 25.0 (IBM Corp., 2017). Normality of data distribution was assessed using the Shapiro–Wilk and Kolmogorov–Smirnov tests. A two-tailed p value < 0.05 was considered statistically significant.
Continuous variables were summarized as means ± standard deviations for normally distributed data, or medians with ranges or interquartile ranges (IQRs) for non-normally distributed data. Categorical variables were presented as frequencies and percentages. The chi-square test was used for group comparisons, while Fisher’s exact test was applied to tables with small expected counts. The Monte Carlo simulation method was applied to contingency tables with sparse data to approximate exact p-values. Continuous variables were compared across groups using one-way ANOVA for normally distributed data, followed by Tukey’s post hoc test for pairwise comparisons. For non-normally distributed data, the Kruskal–Wallis test was used, with Dunn’s post hoc test for pairwise comparisons. Comparisons between patients with and without SIBO were conducted using the independent-samples t-test or the Mann–Whitney U test for continuous variables, and the chi-square test or Fisher’s exact test for categorical variables.
To identify independent predictors of SIBO among cirrhotic patients, binary logistic regression analysis was performed using the backward stepwise (conditional) method. Variables with statistically significant associations in univariate analysis were entered into the multivariate model.
Sample size calculation
A sample size calculation was performed to determine the required number of participants in each group based on the expected prevalence of SIBO and the desired statistical power. The study aimed for 80% power (β = 0.20) with a 5% significance level (α = 0.05). A minimum of 30 participants per group was required to ensure sufficient statistical power.
Ethical considerations
The study protocol was reviewed and approved by the Institutional Review Board (IRB) at the National Liver Institute, Menoufia University, Egypt (approval number: 00587/2024). Informed consent was obtained from all participants before enrollment. Patient confidentiality was maintained throughout the study. Participants were informed of their right to withdraw from the study at any time without penalty. Any serious adverse events were reported to the IRB and the appropriate regulatory authorities.
Results
Demographic and clinical characteristics
Baseline demographic and clinical characteristics of the study groups are presented in Table 1. There were no statistically significant differences in age, sex distribution, or BMI among the groups. However, liver stiffness differed significantly (p < 0.001). Patients with cirrhosis and portal hypertension (Group 3) exhibited the highest liver stiffness (24.0 ± 3.12 kPa), reflecting more advanced liver disease. Clinical complications, including ascites, varices, and a history of hepatic encephalopathy, were significantly more frequent in Group 3 compared to Group 2 (p < 0.01).Table 1. Demographic and clinical characteristics of the studied groupsVariableNon-Liver Disease Controls (n = 30) Group 1Cirrhosis without PH (n = 36) Group 2Cirrhosis with PH (n = 54) Group 3Test of sigp valueAge (years), mean ± SD48.57 ± 13.03250.17 ± 12.24654.65 ± 10.974F = 2.99P_0_ = 0.055Male sex, n (%)15 (50.0%)14 (38.9%)24 (44.4%)χ^2^ = 0.822P_0_ = 0.663BMI*, mean ± SD27.6 ± 5.0426.33 ± 4.5125.76 ± 4.72F = 1.453P_0_ = 0.238Ascites, n (%)N/A0 (0.0%)18 (33.3%)χ^2^ = 15P_0_ < 0.001Varices, n (%)N/A0 (0.0%)28 (51.8%)χ^2^ = 22.474P_0_ < 0.001H/O HE, n (%)N/A6 (16.7%)24 (44.4%)χ^2^ = 7.5P_0_ = 0.006Liver stiffness (kPa), mean ± SD4.75 ± 1.2816.71 ± 1.5624 ± 3.12H = 98.012P_0_ < 0.001p_1_ < 0.001p_2_ < 0.001p_3_ < 0.001F: One-way ANOVA test, H: Kruskal–Wallis test, χ^2^: Chi-square test, SD: Standard deviationBMI: Body mass index, *: BMI was calculated using estimated dry weight in ascitic patients. H/O HE: history of hepatic encephalopathyP_0_: p value for comparing the studied groupsp_1_: p value for comparing Group 1 and Group 2p_2_: p value for comparing Group 1 and Group 3p_3_: p value for comparing Group 2 and Group 3
Laboratory results
Laboratory parameters demonstrated significant differences across the three study groups (Table 2). Patients with cirrhosis and portal hypertension (Group 3) showed the most severe derangements: marked thrombocytopenia (114.13 ± 28.32 × 10⁹/L vs. 165.3 ± 28.58 in Group 2 and 238.7 ± 57.34 in controls; p < 0.001), hypoalbuminemia (3.05 ± 0.37 g/dL vs. 4.04 ± 0.60 and 4.49 ± 0.48; p < 0.001), and elevated total bilirubin (2.36 ± 1.04 mg/dL vs. 1.16 ± 0.40 and 0.90 ± 0.20; p < 0.001). Group 3 also demonstrated higher AST (64.65 ± 27.86 U/L), INR (1.58 ± 0.33), and creatinine (1.37 ± 0.63 mg/dL) versus other groups (p ≤ 0.001). Hemoglobin reduction was significant in both cirrhosis groups versus controls (p < 0.001), while detectable HCV RNA prevalence did not differ between Group 2 (72.2%) and Group 3 (74.1%, p = 0.845).Table 2. Laboratory results of the studied groupsVariableNon-Liver Disease Controls (n = 30) Group 1Cirrhosis without PH (n = 36) Group 2Cirrhosis with PH (n = 54) Group 3Test of sigp value*HB (g/dl)Min.–Max9.10–15.07.30–13.206.80–14.40F = 13.420P0 > 0.001p1 > 0.001p2 > 0.001p3 = 0.920Mean ± SD12.21 ± 1.3410.28 ± 1.6010.42 ± 1.92Median (IQR)12.30(11.0–13.20)10.0 (9.0–11.80)10.60(8.90–11.70)WBC (× 10^3^/μl)Min.–Max3.60–7.902.50–12.02.50–7.30F = 11.396P0 > 0.001p1 = 0.401p2 = 0.011p3 > 0.001Mean ± SD6.03 ± 1.176.48 ± 1.825.11 ± 1.12Median (IQR)6.15 (5.20–6.80)6.20 (5.30–7.55)5.10 (4.40–6.0)Platelet count (× 10^9^/L)*Min.–Max165.0–350.0113.0–221.050.0–198.0F = 105.549P0 > 0.001p1 > 0.001p2 > 0.001p3 > 0.001Mean ± SD238.7 ± 57.34165.3 ± 28.58114.1 ± 28.32Median (IQR)219.5(195.0–290.0)165.5(145.0–185.5)118.5(98.0–132.0)*Total Bilirubin (mg/dL)*Min.–Max0.50–1.200.60–2.400.60–5.80H = 64.441P0 > 0.001p1 = 0.037p2 > 0.001p3 > 0.001Mean ± SD0.90 ± 0.201.16 ± 0.402.36 ± 1.04Median (IQR)0.90 (0.70–1.10)1.10 (0.90–1.20)2.30 (1.50–3.0)*Direct bilirubin (mg/dL)*Min.–Max0.30–0.900.16–1.800.10–4.70H = 46.522P0 > 0.001p1 = 0.090p2 > 0.001p3 > 0.001Mean ± SD0.51 ± 0.150.66 ± 0.331.52 ± 0.87Median (IQR)0.46 (0.40–0.59)0.60 (0.45–0.75)1.50 (0.90–1.90)*Albumin (gm/dL)*Min.–Max3.90–5.503.10–5.302.10–3.70F = 100.816P0 > 0.001p1 = 0.001p2 > 0.001p3 > 0.001Mean ± SD4.49 ± 0.484.04 ± 0.603.05 ± 0.37Median (IQR)4.45 (4.10–4.80)3.95 (3.60–4.55)3.10 (2.90–3.30)*AST (U/L)*Min.–Max11.0–32.015.0–103.017.0–146.0H = 67.330P0 > 0.001p1 = 0.007p2 > 0.001p3 > 0.001Mean ± SD20.83 ± 5.0731.69 ± 19.0464.65 ± 27.86Median (IQR)21.0(17.0–24.0)27.0(22.0–30.50)61.50(47.0–78.0)ALT (U/L)Min.–Max11.0–30.011.0–170.011.0–126.0H = 30.648P0 > 0.001p1 = 0.020p2 > 0.001p3 = 0.002Mean ± SD20.77 ± 5.0830.86 ± 26.0447.69 ± 25.88Median (IQR)21.0(18.0–24.0)26.0(21.0–30.0)45.0(26.0–67.0)INRMin.–Max0.80–1.200.80–2.101.0–2.50H = 62.971P0 > 0.001p1 = 0.075p2 > 0.001p3 > 0.001Mean ± SD0.99 ± 0.141.14 ± 0.311.58 ± 0.33Median (IQR)1.0 (0.90–1.10)1.10(0.90–1.20)1.50(1.37–1.72)*Creatinine (mg/dL)*Min.–Max0.60–1.200.70–1.300.60–3.20H = 14.022P0 = 0.001p1 = 0.720p2 = 0.001p3 = 0.003Mean ± SD0.96 ± 0.190.99 ± 0.181.37 ± 0.63Median (IQR)1.0 (0.80–1.10)1.0 (0.85–1.10)1.20(0.90–1.60)Detectable HCV RNA by PCR, n (%)N/A26 (72.2%)40 (74.1%)χ^2^ = 0.038P_0_ = 0.845F: One-way ANOVA test, H: Kruskal–Wallis test, χ^2^: Chi-square test, SD: Standard deviationH/O HE: history of hepatic encephalopathyP_0_: p value for comparing the studied groupsp_1_: p value for comparing Group 1 and Group 2p_2_: p value for comparing Group 1 and Group 3p_3_: p value for comparing Group 2 and Group 3
Prevalence of small intestinal bacterial overgrowth (SIBO)
As shown in Table 3 and Fig. 1, the prevalence of SIBO increased significantly across the study groups: 6.7% in Group 1, 41.7% in Group 2, and 63% in Group 3 (χ^2^ = 25.026, p < 0.001). Post-hoc analysis confirmed significant differences between Group 1 and both cirrhosis groups (p = 0.001 and p < 0.001, respectively), as well as between Groups 2 and 3 (p = 0.047).Table 3. Comparison between the studied groups regarding small intestinal bacterial overgrowth (SIBO) and small intestinal microbiota colony countsNon-Liver Disease Controls (n = 30) Group 1Cirrhosis without PH (n = 36) Group 2Cirrhosis with PH (n = 54) Group 3Statistical testSIBOχ^2^pNo, n (%)28 (93.3)21 (58.3)20 (37)25.026P_0_ < 0.001p_1_ = 0.001p_2_ < 0.001p_3_ = 0.047Yes, n (%)2 (6.7)15 (41.7)34 (63)Colony count (× 10^3^* CFU/mL)Hp*Min.–Max0.2–1.20.3–2.30.4–438.84P0 < 0.001p1 = 0.001p2 < 0.001p3 = 0.009Mean ± SD0.62 ± 0.231.15 ± 0.591.82 ± 1.08Median (IQR)0.6 (0.5–0.8)0.9 (0.8–1.75)1.7 (0.9–2.5)IQR: Interquartile range, SD: Standard deviation, χ^2^: Chi-square test, H: Kruskal–Wallis testP_0_: p value for comparing the studied groupsp_1_: p value for comparing Group 1 and Group 2p_2_: p value for comparing Group 1 and Group 3p_3_: p value for comparing Group 2 and Group 3Fig. 1Comparison of small intestinal bacterial overgrowth among the different studied groups
Bacterial species identified in duodenal aspirates
Table 4 and Fig. 2 summarize the microbial species identified in duodenal aspirates. Bacteroides and co-isolation of Escherichia coli and Lactobacillus were observed exclusively in Group 1. Lactobacilli were significantly more prevalent in Group 1 (p < 0.001). Enterococcus faecalis was significantly more common in Groups 2 and 3 (p = 0.009), while Streptococci predominated in Group 2 (p = 0.013). Other organisms, including Klebsiella, Pseudomonas, Serratia, and Candida, were detected only in Group 3, though these differences did not reach statistical significance.Table 4. Comparison between the studied groups regarding bacterial species identified in duodenal aspiratesOrganismGroupsGroup 1 (n = 30)Group 2 (n = 36)Group 3 (n = 54)χ^2^pNo%No%No%Bacteroides516.700.000.010.976^MC^p = 0.001Streptococci310.01336.1814.88.6230.013Enterococcus faecalis00.0925.01425.99.4960.009Klebsiella00.000.023.71.575^MC^p = 0.492Anaerobic bacilli00.000.023.71.575^MC^p = 0.492Pepto streptococci00.000.035.62.420^MC^p = 0.335Serratia00.000.047.43.522^MC^p = 0.154Pseudomonas00.000.035.62.420^MC^p = 0.335Candida00.000.011.91.327^MC^p = 1.000E-coli516.71233.31629.62.5030.286Lactobacillus723.325.600.013.487^MC^p < 0.001E-coli and lactobacillus1033.300.000.025.616^MC^p < 0.001Candida and streptococci00.000.011.91.327^MC^p = 1.000χ^2^: Chi square test, MC: Monte Carlo testFig. 2Bacterial species identified in duodenal aspirates from the studied groups
Bacterial colony count
As illustrated in Table 3 and Fig. 3, there were significant differences in bacterial colony counts among the groups (p < 0.001). The mean colony count was lowest in Group 1 (0.62 ± 0.23 × 10^3^ CFU/mL), intermediate in Group 2 (1.15 ± 0.59 × 10^3^ CFU/mL), and highest in Group 3 (1.82 ± 1.08 × 10^3^ CFU/mL). All pairwise comparisons were statistically significant.Fig. 3. Comparison between the different studied groups according to the colony count of small intestinal microbiota
Association of SIBO with detectable HCV RNA, SVR status, and hepatic encephalopathy
Among cirrhotic patients, those with detectable HCV RNA had a significantly higher prevalence of SIBO compared to those without detectable HCV RNA (p < 0.001). Additionally, the median bacterial colony count was significantly greater in patients with detectable HCV RNA (p < 0.001). These findings indicate that ongoing HCV replication is associated with both increased SIBO prevalence and higher duodenal bacterial load (Table 5). All 24 patients with undetectable HCV RNA had achieved SVR after direct-acting antiviral agents (DAAs) therapy, whereas only 3 of 66 patients with detectable HCV RNA received DAAs but did not achieve SVR. Patients with SVR had a lower SIBO prevalence (20.8%) than DAA non-responders (66.7%), though this difference was not statistically significant (p = 0.16), likely due to limited sample size.Table 5. Relation between detectable HCV RNA with SIBO & colony count in patients with cirrhosisDetectable HCV PCRTest of sigpNo (n = 24)Yes (n = 66)SIBONo19 (97.2%)22 (33.3%)χ^2^ = 14.907 < 0.001Yes5 (20.8%)44 (66.7%)Colony count (× 10^3^* CFU/mL)*Min.–Max0.4–30.3–4U = 392.0 < 0.001Mean ± SD0.98 ± 0.611.74 ± 0.9Median (IQR)0.8 (0.65–0.9)1.9 (0.9–2.3)χ^2^: Chi-square test, IQR: Interquartile range, SD: Standard deviation, U: Mann–Whitney test
On the other hand, as shown in Table 6, no significant associations were found between the history of hepatic encephalopathy and either SIBO prevalence (p = 0.1) or bacterial colony count (p = 0.167).Table 6. Relation between history of hepatic encephalopathy with SIBO & Colony countHistory of hepatic encephalopathyTest of sigpNo (n = 60)Yes (n = 30)SIBONo31 (51.7%)10 (33.3%)χ^2^ = 2.710.1Yes29 (48.3%)20 (66.7%)Colony count (× 10^3^* CFU/mL.)*Min.–Max0.3–40.4–4U = 7390.167Mean ± SD1.43 ± 0.861.74 ± 0.94Median (IQR)1 (0.8–2.1)1.9 (0.7–2.4)χ^2^: Chi-square test, IQR: Interquartile range, SD: Standard deviation, U: Mann–Whitney test
Predictors of small intestinal bacterial overgrowth among cirrhotic patients
In univariate analysis, patients with SIBO were significantly older (mean age 56.8 vs. 50.6 years, p = 0.014) and had lower platelet counts (p = 0.002), higher bilirubin (p = 0.034), lower albumin (p = 0.004), higher Child–Pugh scores (p = 0.011), higher FIB-4 scores (p < 0.001), and higher MELD scores (p = 0.044) compared to those without SIBO. The presence of clinically evident portal hypertension was also significantly associated with SIBO (69.4% vs. 48.8%, p = 0.047). No significant differences were found in terms of gender, BMI, or liver stiffness measurements between the groups (Table 7).Table 7. Baseline characteristics and liver disease severity stratified by SIBO status in patients with HCV-related cirrhosisVariableSIBOTest of sigpNo (n = 41)Yes (n = 49)GenderMale23 (56.1%)29 (59.2%)χ^2^ = 0.0870.768Female18 (43.9%)20 (40.8%)AgeMean ± SD50.59 ± 11.4556.78 ± 11.84t = 2.5070.014Median (Min.–Max.)53.0(29.0–75.0)59.0(22.0–76.0)*BMI**Mean ± SD24.99 ± 3.726.82 ± 5.16t = 1.9420.055Median (Min.–Max.)25.54 (17.9–34.64)27.3 (18.9–36.2)Platelets (× 10^9^/L)Mean ± SD147.78 ± 37.71123.59 ± 34.69t = 3.1660.002Median (Min.–Max.)145.0 (84.0–221.0)126.0 (50.0–198.0)*Total Bilirubin (mg/dL)*Mean ± SD1.73 ± 1.102.01 ± 0.95U = 743.500.034Median (Min.–Max.)1.20 (0.60–5.80)2.0 (0.60–4.80)*Direct bilirubin (mg/dL)*Mean ± SD1.01 ± 0.741.31 ± 0.86U = 777.500.066Median (Min.–Max.)0.76 (0.10–3.50)1.20 (0.16–4.70)*Albumin (gm/dL)*Mean ± SD3.67 ± 0.673.26 ± 0.63t = 2.9880.004Median (Min.–Max.)3.60 (2.50–5.10)3.10 (2.10–5.30)*AST (U/L)*Mean ± SD45.05 ± 28.0956.84 ± 29.80U = 749.00.038Median (Min.–Max.)31.0 (15.0–123.0)51.0 (16.0–146.0)*ALT (U/L)*Mean ± SD37.12 ± 20.5444.16 ± 31.42U = 937.00.584Median (Min.–Max.)30.0 (11.0–87.0)34.0 (11.0–170.0)INRMean ± SD1.32 ± 0.371.47 ± 0.39U = 780.00.068Median (Min.–Max.)1.20 (0.80–2.17)1.48 (0.80–2.50)*Creatinine (mg/dL)*Mean ± SD1.15 ± 0.491.27 ± 0.56U = 895.00.373Median (Min.–Max.)1.10 (0.60–3.20)1.10 (0.60–2.90)Child- Pugh scoreMean ± SD6.66 ± 1.877.69 ± 1.78U = 6980.011Median (Min.–Max.)6.0 (5.0–10.0)8.0 (5.0–11.0)Child- PughA22 (53.7%)12 (24.5%)χ^2^ = 8.0820.018B15 (36.6%)29 (59.2%)C4 (9.8%)8 (16.3%)FIB4Mean ± SD3.27 ± 1.934.92 ± 2.65U = 569 < 0.001Median (Min.–Max.)2.50 (0.90–9.70)4.40 (1.70–11.70)MELDMean ± SD12.56 ± 5.4915.04 ± 5.47U = 756.50.044Median (Min.–Max.)11.0 (6.0–26.0)15.0 (6.0–27.0)*Liver stiffness (Kpa)*Mean ± SD20.21 ± 4.9521.45 ± 3.84U = 688.00.114Median (Min.–Max.)19.0 (14.0–33.0)22.0 (15.0–33.0)Portal hypertensionNo21 (51.2%)15 (30.6%)χ^2^ = 3.950.047Yes20 (48.8%)34 (69.4%)SD: Standard deviation, t: Student t-test, U: Mann–Whitney test, χ^2^: Chi-square testBMI: Body mass index, *: BMI was calculated using estimated dry weight in ascitic patients, FIB-4: Fibrosis-4 index, MELD: Model for End-stage Liver Disease
In multivariate logistic regression analysis using a backward stepwise method, four independent predictors of SIBO emerged: age, FIB-4 score, MELD score, and the presence of portal hypertension. Age was significantly associated with higher odds of SIBO (OR = 1.091, 95% CI: 1.032–1.153, p = 0.002). Higher FIB-4 scores were significantly associated with increased SIBO risk (OR = 1.609, 95% CI 1.222–2.118, p = 0.001), as were higher MELD scores (OR = 1.145, 95% CI: 1.042–1.259, p = 0.005). Importantly, the presence of portal hypertension independently predicted the occurrence of SIBO (OR = 2.89, 95% CI 1.023–8.284, p = 0.048), indicating that patients with portal hypertension were nearly three times more likely to have SIBO compared to those without (Table 8). Child–Pugh score and platelet count were excluded from the final model due to a lack of statistical significance. The final model demonstrated good discriminative performance, with a classification accuracy of 77.8%. Table 8. Multivariate logistic regression analysis of independent predictors of SIBO in cirrhotic patientsVariableBSEWaldp-valueOR (Exp(B))95% CI for OR (approx.)Age (years)0.0870.0299.1540.0021.0911.031–1.155FIB-40.4760.14710.5310.0011.6091.207–2.145MELD Score0.1360.0497.7810.0051.1451.041–1.26Portal Hypertension1.0610.5423.8280.0482.8901.023–8.284Constant − 9.0002.27815.602 < 0.001––B: regression coefficient, SE: standard error, Wald: Wald chi-square test statistic, OR: odds ratio, CI: confidence interval, FIB-4: Fibrosis-4 index, MELD: Model for End-stage Liver Disease
Discussion
This study provides robust evidence for the high prevalence of SIBO among patients with HCV-related cirrhosis, particularly those with portal hypertension. Using duodenal aspirate cultures, the gold standard for SIBO diagnosis, we found SIBO in 63% of cirrhotic patients with portal hypertension, significantly higher than in cirrhotic patients without portal hypertension (41.7%) and non-liver disease controls (6.7%).
These findings are consistent with previous research showing high SIBO prevalence in patients with CLD and cirrhosis [23]. The overall prevalence in our cirrhotic cohort (54.4%) aligns with recent meta-analyses reporting pooled SIBO rates of 42.9% in cirrhosis [2]. This meta-analysis also estimated an eightfold increase in SIBO prevalence among CLD patients compared to healthy controls and showed significantly higher rates in decompensated compared to compensated cirrhosis (OR = 2.6; 95% CI 1.5–4.5), reinforcing the link between disease severity and gut dysbiosis [2].
The higher prevalence of SIBO observed in the portal hypertension group in our study supports the findings of Gulyaeva et al., who demonstrated that portal hypertension, independent of cirrhosis, plays a key role in driving significant gut microbial alterations [4].
The interplay between SIBO and portal hypertension is multifactorial. Portal hypertension promotes intestinal congestion, impaired motility, and mucosal edema, all of which disrupt the gut barrier and facilitate bacterial overgrowth and translocation [24, 25]. These changes exacerbate systemic inflammation and may further worsen portal hypertension, creating a vicious cycle [26, 27]. Our findings, showing that SIBO prevalence and bacterial colony counts were highest in patients with portal hypertension, support this pathophysiological model.
Multivariate logistic regression analysis identified age, FIB-4 score, MELD score, and the presence of portal hypertension as independent predictors of SIBO in cirrhotic patients. Each one-year increase in age was associated with 9.1% higher odds of SIBO (OR = 1.091, 95% CI 1.032–1.153, p = 0.002). This suggests that older age is a significant risk factor for SIBO in this population, possibly due to age-related changes in gut motility and immune function. The FIB-4 score (OR = 1.609, 95% CI 1.207–2.145, p = 0.001) and MELD score (OR = 1.145, 95% CI 1.041–1.26, p = 0.005) are established indicators of liver fibrosis and disease severity, respectively. Their independent association with SIBO further strengthens the link between advanced liver disease and bacterial overgrowth. This is in line with previous studies demonstrating that positive non-invasive fibrosis markers and elevated liver disease severity scores are significantly associated with an increased risk of SIBO [28–30].
Notably, portal hypertension was associated with nearly threefold increased odds of SIBO (OR = 2.89, 95% CI 1.02–8.28, p = 0.048), even after adjusting for liver disease severity and other confounders. This aligns with prior research suggesting a strong link between portal hypertension and intestinal dysbiosis [4, 31]. The borderline statistical significance of this association may reflect the sample size and inherent variability in clinical presentations, but the effect size underscores its clinical relevance. The identification of these predictors can aid in the early identification of cirrhotic patients at high risk for SIBO, allowing for timely interventions.
The analysis of bacterial species in duodenal aspirates revealed distinct microbial profiles across the study groups. Bacteroides and co-isolation of Escherichia coli and Lactobacillus were exclusively observed in the control group. Lactobacilli were significantly more prevalent in Group 1 (p < 0.001), suggesting their role as beneficial commensals in a healthy gut environment. Conversely, Enterococcus faecalis was significantly more common in cirrhotic patients, particularly in Groups 2 and 3 (p = 0.009), while Streptococci predominated in Group 2 (p = 0.013). The presence of other organisms such as Klebsiella, Pseudomonas, Serratia, and Candida exclusively in Group 3 (cirrhosis with portal hypertension) further indicates a shift towards a more pathogenic and diverse microbial community in advanced liver disease. This dysbiosis, characterized by an increase in potentially harmful bacteria and a reduction in beneficial ones, aligns with existing literature on gut microbiota alterations in cirrhosis [32]. The increased presence of Enterococcus and Streptococcus species, as well as Gram-negative bacteria like Klebsiella and Pseudomonas, is particularly concerning given their association with bacterial translocation and systemic inflammation, which can exacerbate portal hypertension and its complications [33].
This shift toward a more pathogenic microbiome in portal hypertension mirrors observations by Bajaj et al. in hepatic encephalopathy [34], suggesting a shared dysbiotic pathway exacerbated by portal hypertension. This dysbiotic profile is consistent with previous microbiome studies in CLD and may contribute to the pathogenesis of liver-related complications [35–37].
Our study found significant differences in bacterial colony counts among the groups (p < 0.001), with the lowest mean count in Group 1 (0.62 ± 0.23 × 10^3^ CFU/mL), intermediate in Group 2 (1.15 ± 0.59 × 10^3^ CFU/mL), and highest in Group 3 (1.82 ± 1.08 × 10^3^ CFU/mL). This clear gradient in bacterial load, directly correlating with the presence of portal hypertension and severity of liver disease, underscores the pathological significance of SIBO in cirrhotic patients. Higher bacterial loads contribute to increased intestinal permeability and bacterial translocation, leading to systemic inflammation and endothelial dysfunction, which can further aggravate portal hypertension [32]. The use of duodenal aspirate cultures allowed for a precise quantification of bacterial load, providing a more accurate assessment compared to less specific diagnostic methods. These findings emphasize the importance of not only identifying the presence of SIBO but also quantifying the bacterial burden to better understand its impact on disease progression [19, 38, 39].
Our findings demonstrate that detectable HCV RNA is significantly associated with both the presence of SIBO and increased duodenal bacterial colony counts in cirrhotic patients. This suggests that ongoing viral replication may contribute to gut dysbiosis, potentially through mechanisms such as immune activation, mucosal barrier dysfunction, or altered bile acid metabolism, all of which can favor bacterial overgrowth [40, 41]. These results are in line with previous studies indicating that active HCV infection exacerbates intestinal permeability and microbial translocation, thereby increasing the risk of SIBO and its complications [42–45].
Eradication of HCV has been reported to improve portal pressure, systemic inflammation, and gut barrier function, factors that may reduce susceptibility to SIBO [46–48]. Our data suggest a trend towards lower SIBO prevalence among patients with SVR, highlighting a potential modifying effect of viral clearance on intestinal bacterial overgrowth. Larger studies are warranted to confirm these findings and to evaluate SIBO as a modifiable target in patients successfully treated for HCV.
Interestingly, a history of hepatic encephalopathy was not associated with SIBO in our cohort. Although previous studies have reported a positive association between SIBO and hepatic encephalopathy [3, 49–51], our negative finding may be attributed to the modest sample size or the multifactorial etiology of encephalopathy in patients with cirrhosis.
These results have important clinical implications. First, they underscore the potential value of routine SIBO screening in cirrhotic patients, particularly those with portal hypertension or elevated non-invasive fibrosis scores. Early detection and treatment may help reduce complications such as hepatic encephalopathy and spontaneous bacterial peritonitis, which are driven by bacterial translocation and gut-derived inflammation [52]. Second, our findings support the use of non-invasive markers (FIB-4, MELD) for risk stratification and guiding targeted interventions. Third, from a translational perspective, the identification of SIBO as a significant factor in HCV-related cirrhosis, especially in the presence of portal hypertension, highlights the potential for microbiome-targeted therapeutic strategies. Non-absorbable antibiotics (e.g., rifaximin), specific probiotics, and dietary modulation have shown promise in improving gut barrier function, restoring microbial balance, and reducing bacterial translocation in patients with cirrhosis [53–55]. While our study did not assess the efficacy of such interventions, our findings provide a strong rationale for integrating SIBO evaluation and management into comprehensive care pathways for this patient population.
A major strength of this study is the use of duodenal aspirate culture, a more accurate diagnostic method than breath tests. The inclusion of well-defined patient groups and comprehensive clinical and microbiological assessments enhances the validity of our findings.
Limitations
Several limitations should be acknowledged. The most important is the cross-sectional design, which precludes establishing causality and assessing long-term clinical outcomes. We were unable to determine whether SIBO predicts important clinical events such as hepatic decompensation, infections, hospitalizations, or transplant-free survival. The relatively small sample size, although adequate to detect significant associations, may limit generalizability. Our study also did not evaluate gastrointestinal symptoms associated with SIBO, limiting symptom–microbiology correlations. Additionally, dietary data were not collected, representing a missed opportunity to assess an important modulator of gut microbiota. The borderline significance of portal hypertension as a predictor of SIBO requires confirmation in larger, multicenter cohorts. Exclusion of patients with diabetes, recent antibiotic use, active alcohol intake, or other confounding factors, while methodologically necessary, may limit applicability to broader cirrhotic populations. Finally, as the study was restricted to HCV-related cirrhosis, findings may not apply to other etiologies.
Future directions
Future research should focus on conducting large, multicenter longitudinal studies to clarify the temporal relationship between SIBO and liver disease progression. Interventional trials are needed to determine whether targeted SIBO screening and treatment can improve outcomes in advanced liver disease. Given that duodenal aspiration is invasive and often impractical in routine settings, efforts should be directed toward developing and validating less invasive yet accurate diagnostic alternatives. Further studies should also explore the contribution of specific bacterial species to the pathophysiology of portal hypertension and expand investigations to other cirrhosis etiologies. Incorporating validated symptom assessment tools will help strengthen correlations between microbiological findings and clinical presentation.
Conclusion
In conclusion, our study demonstrates a high prevalence of SIBO in HCV-related cirrhosis, especially among patients with portal hypertension. Age, FIB-4 score, MELD score, and portal hypertension were independent predictors of SIBO. The observed microbial shifts and increased bacterial load highlight the role of gut dysbiosis in liver disease progression. These findings underscore the need to consider SIBO in the clinical management of cirrhotic patients with portal hypertension and support the use of non-invasive liver disease markers for SIBO risk stratification. Given the cross-sectional nature and other limitations noted, further longitudinal studies are needed to elucidate causality and clinical implications, including the potential benefits of therapeutic interventions targeting SIBO in this population.
The reference list from the paper itself. Each links out to its DOI / PubMed record.
- 1European Association for the Study of the L. EASL Clinical Practice Guidelines on nutrition in chronic liver disease. J Hepatol. 2019;70:172–93. 10.1016/j.jhep.2018.06.024.10.1016/j.jhep.2018.06.024PMC 665701930144956 · doi ↗ · pubmed ↗
- 2European Association for the Study of the L. EASL Clinical Practice Guidelines for the management of patients with decompensated cirrhosis. J Hepatol. 2018;69:406–60. 10.1016/j.jhep.2018.03.024.10.1016/j.jhep.2018.03.02429653741 · doi ↗ · pubmed ↗