Joint nausea and fatigue profiles during chemotherapy identify patients with a higher symptom burden
Komal P. Singh, Bruce A. Cooper, Kathryn Ruddy, Keenan Pituch, Felipe Batalini, Steven M. Paul, Marilyn Hammer, Yvette P. Conley, Jon D. Levine, Christine Miaskowski

TL;DR
The study identifies patient subgroups with distinct patterns of nausea and fatigue during chemotherapy, which may help in understanding and managing treatment side effects.
Contribution
The novel contribution is the identification of subgroups with distinct joint profiles of chemotherapy-induced nausea and fatigue, along with associated risk factors.
Findings
Five subgroups with distinct joint chemotherapy-induced nausea and morning fatigue profiles were identified.
Risk factors for worse profiles include younger age, lower income, high comorbidity, and depression.
Chemotherapy-induced nausea co-occurs with both morning and evening fatigue, suggesting shared biological mechanisms.
Abstract
Identify subgroups of oncology patients with distinct joint chemotherapy-induced nausea (CIN) AND morning fatigue profiles and distinct joint CIN AND evening fatigue profiles, as well as modifiable and non-modifiable risk factors. Oncology patients receiving chemotherapy completed self-report questionnaires that provided information on demographic and clinical characteristics, as well as on CIN and morning and evening fatigue. The three symptoms were assessed six times over two cycles of chemotherapy. Joint latent class profile analyses (LCPA) were performed to identify subgroups of patients with distinct joint symptom profiles. Parametric and non-parametric tests were used to evaluate for differences in modifiable and non-modifiable risk factors among the profiles. Five and four subgroups were identified with distinct joint CIN and morning fatigue and distinct joint CIN and evening…
Genes, proteins, chemicals, diseases, species, mutations and cell lines named across the full text — each resolved to its canonical identifier and authoritative record.
Click any figure to enlarge with its caption.
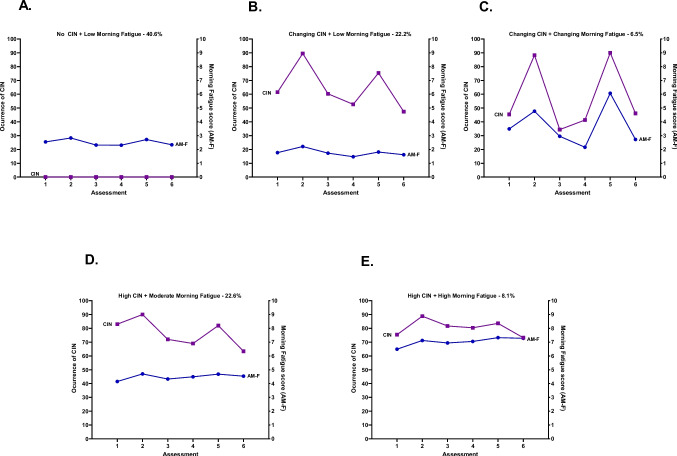 Figure 1
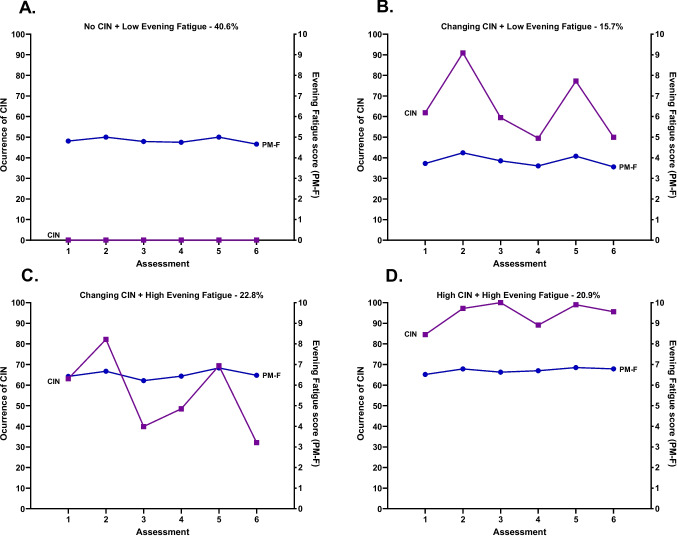 Figure 2
- —https://doi.org/10.13039/100000054National Cancer Institute
Peer Reviews
No public reviews on file for this paper yet. If you reviewed it on a platform where reviews are public (OpenReview, ICLR, NeurIPS, ICML), you can paste yours below so the community can read it here.
Videos
No videos yet. Explain this paper in a talk, walkthrough, or lecture? Add one.
Taxonomy
TopicsNausea and vomiting management · Oral health in cancer treatment · Chemotherapy-related skin toxicity
Introduction
Patients receiving cancer chemotherapy experience an average of 10 to 12 co-occurring symptoms [1]. Two of the most common symptoms reported by these patients are chemotherapy-induced nausea (CIN) and fatigue. Despite advances in antiemetic regimens, occurrence rates for CIN range between 30% and 60% [2]. Similarly, occurrence rates for fatigue range from 52% [3] to 85% [4]. These wide ranges in prevalence rates demonstrate that a large amount of inter-individual variability exists in both symptoms.
While often studied as single symptoms, emerging evidence suggests that variations in fatigue severity are associated with the occurrence of CIN. For example, in a cross-sectional study that used latent class analysis (LCA) [5], three classes of breast cancer patients with distinct symptom profiles were identified (i.e., tired; disrupted sleep and tired; and pain, disrupted sleep, and tired). Except for the tired class, nausea was a highly prevalent symptom in the other two classes. In a longitudinal study of patients with breast cancer [6], higher levels of pre-treatment nausea were a significant risk factor for more severe fatigue following one cycle of chemotherapy. In another study that used latent growth modeling to evaluate for associations between fatigue and other symptoms over two cycles of chemotherapy [7], breast cancer patients in the higher fatigue severity class reported more days with moderate-to-severe nausea. While associations between diurnal variations in fatigue severity and CIN were not evaluated, these findings suggest that the co-occurrence of these two symptoms may have additive or synergistic effects. Of note, risk factors associated with inter-individual variability in the co-occurrence of CIN and fatigue were not reported.
Inter-individual variability and common and distinct risk factors for CIN and fatigue
Recent work by our research team using hierarchical linear modeling and latent variable modeling characterized inter-individual variability in and risk factors associated with the occurrence of CIN [8–11] and the severity of morning [12, 13] and evening [14, 15] fatigue in oncology patients receiving chemotherapy. For these three symptoms, a comprehensive list of demographic and clinical characteristics, as well as neuropsychological symptoms, was evaluated as potential risk factors for more severe symptoms. In brief, in the LCA for CIN [8], four distinct profiles were identified based on occurrence rates (i.e., None (41%), Increasing–Decreasing (21%), Decreasing (9%), High (29%)).
In terms of fatigue, previous work demonstrated that morning and evening fatigue are distinct symptoms [16] that share common and distinct risk factors [17, 18] and biological mechanisms [19, 20]. For example, using latent profile analysis (LPA), four distinct profiles were identified for morning (i.e., Very Low, Low, High, Very High) [12] and for evening (i.e., Low, Moderate, High, Very High) [15] fatigue. As shown in Table 1, the most common risk factors associated with a higher burden for all three symptoms were younger age, having childcare responsibilities, having a lower functional status and a higher comorbidity burden, as well as a self-reported diagnosis of depression. Equally important, the worst CIN, morning, and evening fatigue profiles were associated with higher severity scores for the majority of the psychoneurological symptoms that were evaluated. Table 1. Summary of common and distinct risk factors and mechanisms for chemotherapy-induced nausea, morning fatigue, and evening fatigueRisk factorsChemotherapy-induced nauseaMorning fatigueEvening fatigueHLM studies^1, 2^LCA studies^3, 4^HLM study^5^LPA study^6^HLM study^7^LPA study^8^Demographic characteristicsYounger age■■■■Being female■■Higher level of education■■Self-reported being white■■Not married or partnered■Living alone■Not employed■Lower annual household income■Higher annual household income■■Having child care responsibilities■■■■Clinical characteristicsHigher body mass index■■Lack of regular exercise■■Lower Karnofsky Performance Status score■■■■■Higher number of comorbid conditions■■Higher SCQ score■■■■Diagnosis of anemia or blood disease■■■Diagnosis of ulcer or stomach disease■Diagnosis of lung disease■Diagnosis of depression■■■Having a diagnosis of breast cancer■Having breast, GI, or GYN cancer■Received only chemotherapy■Did not receive targeted therapy■14-day chemotherapy cycle■Received highly emetogenic chemotherapy■■Neuropsychological symptomsHigher depression scores■■■■■■Higher state anxiety scores■■■■Higher trait anxiety scores■■■■Higher sleep disturbance scores■■■■■■Higher morning fatigue scores■■■■Higher evening fatigue scores■■■Higher worst pain intensity scores■Higher pain interference scores■Lower attentional function scores■■■Lower morning energy scores■■■■Lower evening energy scores■■■More likely to have cancer and non-cancer pain■■Additional gastrointestinal symptoms (higher occurrence rates)Dry mouth■Feeling bloated■■Vomiting■■Diarrhea■Lack of appetite■■Increased appetite■Abdominal cramps■Difficulty swallowing■■Mouth sores■■Weight loss■Weight gain■Constipation■■Change in way food tastes■Perturbed KEGG pathwaysPathway nameChemotherapy-induced nausea^9, 10^Morning fatigue^11^Evening fatigue^11^Cytokine-cytokine receptor interaction■■■Mitogen-activated protein kinase signaling■Nuclear factor κ-B signaling■■Chemokine signaling■■■Intestinal immune network for IgA production■■■Peroxisome proliferator-activated receptor■Interleukin 17 producing helper T cell differentiation■Tight junction■Antigen processing and presentation■■■Endocytosis■■■Regulation of the actin cytoskeleton■Apoptosis■■Phosphatidylinositol kinase-protein kinase■■Phagosome■■Neutrophil extracellular trap formation■■T-helper cell 17 differentiationNucleotide-binding and oligomerization domainNecroptosis■C-type lectin receptor signaling■Mitogen-activated protein kinase■Natural killer cell-mediated toxicity■■Complement and coagulation cascades■Platelet activation■B-cell receptor signalingAdditional gastrointestinal symptoms were not evaluated in the fatigue studies■ Indicates the presence of the risk factor
While our previous studies demonstrated positive associations between the occurrence of CIN and morning and evening fatigue severity [10, 11], the reciprocal relationship was not evaluated in the LPAs of morning [12] and evening [15] fatigue. However, in unpublished analyses, significant differences were found among the morning fatigue profiles in the occurrence rates for CIN (i.e., Very Low (30.3%), and Low (37.5%) versus High (58.8%), and Very High (66.9%), p < 0.001). In terms of the evening fatigue profiles, significant differences were found in the occurrence rates for CIN (i.e., Low (27.4%) versus Moderate (49.8%), High (48.6%) and Very High (53.6%) classes, p < 0.001; unpublished data). Given the deleterious effects of both CIN and fatigue, these analyses suggest that additional research is warranted on the co-occurrence of these two symptoms and associated risk factors in patients receiving chemotherapy.
Theoretical rationale for the co-occurrence of CIN and fatigue
As noted in several reviews, the mechanisms that underlie CIN [21, 22] and fatigue [23–27] are complex. In terms of CIN, early work focused on variations in genes involved in the serotonin receptor, drug metabolism, and/or drug transport pathways. However, none of the candidate genes evaluated were associated with the occurrence and/or severity of CIN [24]. Early mechanistic studies of fatigue evaluated a variety of biomarkers of inflammation and neuroinflammation [23]. For both symptoms, recent work focused on an evaluation of alterations in pathways involved in inflammation [21, 22] and the gut-brain axis [25, 26]. Additional evidence to support the hypothesis that common and distinct mechanisms underlie CIN and fatigue comes from our gene expression studies [20, 28, 29]. As shown in Table 1, several common pathways involved in inflammation (e.g., cytokine-cytokine receptor interaction, chemokine signaling) and alterations in the gut-brain axis (e.g., intestinal immune network for IgA) were perturbed for CIN, as well as for morning and evening fatigue.
Although previous studies provide valuable information on risk factors for CIN and for diurnal variations in fatigue as single symptoms, none of them evaluated for inter-individual variability in and risk factors for CIN AND fatigue in the same latent variable model. Therefore, the purposes of this study, using latent class profile analyses (LCPA), were to identify subgroups of oncology patients with distinct joint CIN AND morning fatigue profiles as well as distinct joint CIN AND evening fatigue profiles. Once the profiles were identified, for each LCPA, differences among the profiles in demographic and clinical characteristics, severity scores for neuropsychological symptoms, and occurrence rates for additional gastrointestinal symptoms were evaluated. The identification of modifiable risk factors for the co-occurrence of CIN AND fatigue will inform tailored interventions, as well as future mechanistic studies.
Methods
Patients and settings
As previously described [8], eligible patients were ≥ 18 years; had a diagnosis of breast, gastrointestinal, gynecological, or lung cancer; had received chemotherapy within the preceding four weeks; were scheduled to receive at least two additional cycles of chemotherapy; were able to read, write, and understand English; and gave written informed consent. Patients were recruited from two Comprehensive Cancer Centers, one Veteran’s Affairs hospital, and four community-based oncology programs.
Study procedures
The study was approved by the Institutional Review Board at each of the study sites. Of the 2234 patients approached, 1338 consented to participate and provided evaluable data on the occurrence of CIN and the severity of morning and evening fatigue for this analysis. Patients’ refusal to participate was related to being overwhelmed with their cancer treatment.
Eligible patients were approached in the infusion unit during their first or second cycle of chemotherapy to discuss participation in the study. After obtaining written informed consent, patients completed measures of CIN and morning and evening fatigue in their homes a total of six times over two cycles of chemotherapy (i.e., prior to chemotherapy administration (Assessments 1 and 4), approximately 1 week after chemotherapy administration (Assessments 2 and 5), and approximately 2 weeks after chemotherapy administration (Assessments 3 and 6)). Additional information used in this analysis were obtained at enrollment (i.e., prior to the second or third cycle of chemotherapy).
Instruments
Demographic and clinical characteristics
Patients completed a demographic questionnaire, Karnofsky Performance Status (KPS) scale [30], Self-Administered Comorbidity Questionnaire (SCQ) [31], Alcohol Use Disorders Identification Test [32], and smoking history questionnaire. Medical records were reviewed for disease and treatment information.
Assessment of CIN occurrence
The nausea item from the Memorial Symptom Assessment Scale (MSAS) was used to assess for the occurrence of CIN at each of the six assessments. The MSAS is a valid and reliable measure that evaluates the occurrence, severity, frequency, and distress of 32 common symptoms [33].
Assessment of morning and evening fatigue
The 18-item Lee Fatigue Scale (LFS) was designed to assess physical fatigue and energy [34]. Each item was rated on a 0 to 10 numeric rating scale. Mean scores were calculated for the 13 fatigue items and 5 energy items, respectively. Higher scores indicate greater fatigue severity and higher levels of energy. Patients rated each item based on how they felt within 30 min of awakening (i.e., morning fatigue) and prior to going to bed (i.e., evening fatigue). The LFS has an established cutoff score for clinically meaningful levels of fatigue (i.e., ≥3.2 for morning fatigue, ≥5.6 for evening fatigue) [35].
Assessment of neuropsychological symptoms
An evaluation of other common symptoms was done using valid and reliable instruments. These symptoms and their respective measures were depressive symptoms (Center for Epidemiological Studies-Depression Scale (CES-D) [36]); trait and state anxiety (Spielberger State-Trait Anxiety Inventories (STAI-S and STAI-T) [37]); cognitive function (Attentional Function Index (AFI) [38]); sleep disturbance (General Sleep Disturbance Scale (GSDS) [35]); morning and evening energy (Lee Fatigue Scale (LFS) [34]); and pain (Brief Pain Inventory (BPI) [39]).
Assessment of additional gastrointestinal symptoms
A modified version of the MSAS was used to evaluate the occurrence of 13 common gastrointestinal symptoms associated with chemotherapy or the cancer itself: dry mouth, feeling bloated, vomiting, diarrhea, lack of appetite, increased appetite, abdominal cramps, difficulty swallowing, mouth sores, weight loss, weight gain, constipation, and change in the way food tastes [33].
Data analyses
Separate joint LCPAs were done for CIN and morning fatigue and CIN and evening fatigue [40, 41]. These joint LCPAs were done using CIN occurrence rates (yes/no) and fatigue severity scores. Prior to performing the LCPAs, patients who responded “no” to the nausea item on the MSAS for 5 or 6 assessments (i.e., these patients did not experience nausea over the two cycles of chemotherapy; n = 543) were identified and their morning and evening fatigue scores were calculated. Then, using Mplus version 8.5 [42], for the remaining patients (n = 795), the LCPAs were performed with the combined CIN occurrence rates and fatigue severity scores over the six assessments. This approach provided a profile of these two symptoms.
Estimation was carried out with full information maximum likelihood (FIML) with standard errors and a chi-squared test that are robust to non-normality and non-independence of observations (MLR). Model fit was evaluated to identify the solution that characterized the observed latent class structure with the Bayesian Information Criterion (BIC), entropy, and latent class percents that were large enough to be reliable (i.e., likely to replicate in new samples) [43, 44]. Missing data were accommodated with the use of the Expectation–Maximization (EM) algorithm [45]. This method provides unbiased estimates as long as the missing data process is ignorable (missing at random, missing completely at random, or covariate-dependent missingness). Mixture models such as latent profile (or latent class) analysis are known to produce solutions at local maxima. Therefore, our models were fit from 1000 to 4000 random starts. This approach ensured that the estimated model was replicated many times and not due to a local maximum.
Additional data were analyzed using IBM SPSS Statistics version 29 (IBM Corporation, Armonk, NY). Parametric and nonparametric tests were performed to evaluate for differences among the joint latent classes in demographic and clinical characteristics, neuropsychological symptom scores, and gastrointestinal symptom occurrence rates at enrollment. A p-value of <0.05 was considered statistically significant. Post hoc contrasts were done using the Bonferroni procedure.
Results
CIN and morning fatigue
Latent class analysis
The 543 patients who had ≤ 1 occurrence of CIN over the six assessments had low morning fatigue scores and were labeled No CIN and Low Morning Fatigue (Both Low-AMF). For the joint CIN and morning fatigue LCPA, a 4-class solution was selected (see details in Table 2). As shown in Fig. 1, 40.6% of the patients were in the No CIN and Low Morning Fatigue class (i.e., Both Low-AMF); 22.2% were in the Changing CIN and Low Morning Fatigue class (i.e., Changing CIN-Low AMF); 6.5% were in the Changing CIN and Changing Morning Fatigue class (i.e., Both Changing-AMF); 22.6% were in the High CIN and Moderate Morning Fatigue class (i.e., High CIN-Moderate AMF); and 8.1% were in the High CIN and High Morning Fatigue class (i.e., Both High-AMF). For the Both Changing-AMF class, the occurrence of CIN and severity of morning fatigue scores increased at assessments 2 and 5 (i.e., the week following the administration of chemotherapy). For the Both Low-AMF and Both High-AMF classes, CIN occurrence and morning fatigue severity scores remained relatively stable over time. Table 2. Latent Profile Solutions and Fit Indices for Nausea Occurrence and Morning and Evening FatigueChemotherapy-induced Nausea and Morning FatigueModelLLAICBICEntropyVLMR1 Class–11134.5122323.0322449.34n/an/a2 Class–10826.9021733.8021920.930.77615.23 ^‡^3 Class–10686.9921479.9921727.940.82279.81 ^+^4 Class^a^–10586.0921304.1821612.950.8163.45 ^^5 Class–10516.2821190.5721560.160.78nsChemotherapy-induced Nausea and Evening FatigueModelLLAICBICEntropyVLMR1 Class–10445.7220945.4421071.75n/an/a2 Class–10232.6120545.2320732.360.70426.21 +3 Class ^b^–10114.8220335.6420583.590.69235.59 4 Class–10026.4420184.8820493.650.76nsBaseline entropy and VLMR are not applicable for the one-class solutionp < .05; ^**^p = .001; ^+^p = .0001; ^‡^p < .00005 ^a^The 4-class solution was selected for CIN and morning fatigue because the BIC for that solution was lower than the BIC for the 3-class solution. In addition, the VLMR was significant for the 4-class solution, indicating that four classes fit the data better than three classes. Although the BIC for the 5-class was lower than the BIC for the 4-class solution, the VLMR was not significant for the 5-class solution, indicating that too many classes had been extracted
^b^The 3-class solution was selected for CIN and evening fatigue because the BIC for that solution was lower than the BIC for the 2-class solution. In addition, the VLMR was significant for the 3-class solution, indicating that three classes fit the data better than two classes. Although the BIC for the 4-class was lower than the BIC for the 3-class solution, the VLMR was not significant for the 4-class solution, indicating that too many classes had been extracted
AIC Akaike’s Information Criterion; BIC Bayesian Information Criterion; CIN chemotherapy-induced nausea; LL log-likelihood; n/a not applicable; ns not significant; VLMR Vuong-Lo-Mendell-Rubin likelihood ratio test for the K vs. K-1 model Fig. 1. Occurrence of chemotherapy-induced nausea (CIN, left y-axis; percentage of patients reporting CIN occurrence) and morning fatigue (AM-F, right y-axis; higher scores indicate higher levels of fatigue) scores over two cycles of chemotherapy for subgroups of oncology patients with No CIN and Low Morning Fatigue class (A), Changing CIN and Low Morning Fatigue class (B), Changing CIN and Changing Morning Fatigue class (C), High CIN and Moderate Morning Fatigue class (D), and High CIN and High Morning Fatigue class (E)
Demographic and clinical characteristics
Differences among the five classes are listed in Table 3. In brief, compared to the Both Low-AMF class, the other four classes were younger. Compared to the Both Low-AMF and Changing CIN-Low AMF classes, the other three classes had lower KPS scores, were more likely to self-report a diagnosis of depression, and had received a neurokinin-1 receptor antagonist and two other antiemetics. Compared to the other four classes, the Both High-AMF class had a lower annual income, was less likely to exercise on a regular basis, and had higher SCQ scores. Table 3. Differences in Demographic and Clinical Characteristics Among the CIN and Morning Fatigue Latent Profiles at EnrollmentCharacteristicNo CIN and Low Morning Fatigue (0)Changing CIN and Low Morning Fatigue (1)Changing CIN and Changing Morning Fatigue (2)High CIN and Moderate Morning Fatigue (3)High CIN and High Morning Fatigue (4)Statistics40.6% (n=543)22.2% (n=297)6.5% (n=87)22.6% (n=302)8.1% (n=109)Mean (SD)Mean (SD)Mean (SD)Mean (SD)Mean (SD)Age (years)60.0 (12.1)57.0 (12.1)52.7 (13.7)54.7 (11.8)54.0 (11.5)F = 15.19, p <.0010 > 1, 2, 3, and 41 > 2Education (years)16.3 (3.1)16.4 (3.1)16.2 (3.0)16.0 (2.9)15.7 (2.9)F = 1.45, p = .215Body mass index (kg/m^2^)26.2 (5.4)25.6 (5.1)26.7 (5.4)26.1 (5.9)27.7 (7.2)F = 3.14, p = .0141 < 4Alcohol Use Disorders Identification Test score3.1 (2.3)2.9 (2.3)2.9 (2.5)2.8 (2.8)3.0 (2.8)F = 0.34, p = .855Karnofsky Performance Status score (KPS)83.1 (11.8)82.8 (11.8)78.3 (13.0)75.4 (11.3)70.7 (12.0)F = 40.39, p <.0010 and 1 > 2, 3 and 4;2 and 3 > 4Number of comorbid conditions2.4 (1.4)2.2 (1.3)2.3 (1.3)2.5 (1.5)3.1 (1.8)F = 8.55, p <.0011 < 3 and 42 < 4; 0 < 4Self-administered Comorbidity Questionnaire score5.2 (3.0)4.9 (2.7)5.4 (2.9)5.8 (3.2)7.5 (4.5)F = 16.14, p <.0010, 1, 2 and 3 < 4;1 < 3Time since diagnosis (years)2.2 (4.3)1.8 (3.7)1.5 (2.9)2.0 (3.9)1.4 (2.7)KW = 5.50, p = .240Time since diagnosis (years, median)0.440.410.370.420.42Number of prior cancer treatments1.7 (1.6)1.5 (1.4)1.3 (1.3)1.7 (1.5)1.8 (1.5)F = 2.55, p = .037No significant pw contrastsNumber of metastatic sites including lymph node involvement^a^1.3 (1.3)1.2 (1.1)1.1 (1.2)1.2 (1.3)1.2 (1.2)F = 1.29, p = .274Number of metastatic sites excluding lymph node involvement0.9 (1.1)0.7 (1.0)0.6 (1.0)0.8 (1.1)0.8 (1.0)F = 2.52, p = .040No significant pw contrastsMAX2 score0.16 (0.09)0.17 (0.07)0.21 (0.08)0.18 (0.08)0.19 (0.08)F = 5.99, p <.0010, 1 and 3 < 2;% (n)% (n)% (n)% (n)% (n)Gender (% female)72.9 (395)73.7 (219)88.5 (77)84.8 (256)85.3 (93)Χ^2^ = 28.26, p <.0010 and 1 < 2 and 3Self-reported ethnicityΧ^2^ = 19.26, p = .083 White70.5 (378)70.7 (208)67.4 (58)69.5 (207)64.5 (69) Asian or Pacific Islander11.9 (64)13.3 (39)14.0 (12)13.8 (41)8.4 (9) Black8.4 (45)7.8 (23)7.0 (6)4.4 (13)7.5 (8) Hispanic, Mixed, or Other9.1 (49)8.2 (24)11.6 (10)12.4 (37)19.6 (21)Married or partnered (% yes)67.2 (359)68.7 (202)66.3 (57)59.1 (176)52.3 (56)Χ^2^ = 14.88, p = .0050 and 1 > 4Lives alone (% yes)19.5 (104)17.7 (52)17.6 (15)24.7 (74)36.1 (39)Χ^2^ = 20.10, p <.0010, 1, and 2 < 4Currently employed (% yes)36.4 (196)39.7 (116)32.6 (28)33.1 (99)23.9 (26)Χ^2^ = 9.98, p = .0411 > 4Annual household incomeKW = 36.15, p <.0010, 1, 2 and 3 > 40 and 1 > 3 Less than 30,000^+^13.8 (66)13.8 (36)16.7 (14)23.1 (63)40.6 (41) 30,000 to 70,000 to 100,00046.3 (222)50.2 (131)41.7 (35)38.8 (106)28.7 (29)Child care responsibilities (% yes)18.0 (96)18.8 (54)26.7 (23)29.4 (87)28.3 (30)Χ^2^ =19.60, p <.0010 and 1 < 3Elder care responsibilities (% yes)7.5 (37)7.5 (20)2.5 (2)9.8 (27)10.1 (10)Χ^2^ = 5.48, p = .242Past or current history of smoking (% yes)37.6 (200)30.8 (91)34.5 (29)33.3 (99)42.6 (46)Χ^2^ = 6.82, p = .146Exercise on a regular basis (% yes)70.5 (378)78.5 (227)72.9 (62)69.4 (206)52.5 (53)Χ^2^ = 25.30, p <.0010, 1, 2 and 3 > 4Specific comorbid conditions (% yes) Heart disease7.0 (38)3.4 (10)3.4 (3)6.0 (18)7.3 (8)Χ^2^ = 6.05, p = .195 High blood pressure32.8 (178)29.6 (88)31.0 (27)27.8 (84)25.7 (28)Χ^2^ = 3.65, p = .455 Lung disease12.9 (70)9.8 (29)6.9 (6)8.9 (27)17.4 (19)Χ^2^ = 9.53, p = .049No significant pw contrasts Diabetes7.9 (43)8.1 (24)8.0 (7)11.3 (34)11.9 (13)Χ^2^ = 4.18, p = .383 Ulcer or stomach disease3.5 (19)4.4 (13)5.7 (5)6.6 (20)7.3 (8)Χ^2^ = 5.95, p = .203 Kidney disease0.6 (3)1.3 (4)4.6 (4)1.3 (4)3.7 (4)Χ^2^ = 13.17, p = .0100 < 2 and 4 Liver disease6.6 (36)7.1 (21)4.6 (4)6.3 (19)5.5 (6)Χ^2^ = 0.89, p = .926 Anemia or blood disease9.2 (50)12.5 (37)17.2 (15)13.2 (40)20.2 (22)Χ^2^ = 13.36, p = .0100 < 4 Depression14.2 (77)8.1 (24)27.6 (24)26.5 (80)47.7 (52)Χ^2^ = 103.84, p <.0010 and 1 < 2, 3 and 42 and 3 < 4 Osteoarthritis13.8 (75)10.4 (31)6.9 (6)11.6 (35)14.7 (16)Χ^2^ = 5.20, p = .267 Back pain23.6 (128)21.2 (63)19.5 (17)30.1 (91)45 (41.3)Χ^2^ = 23.11, p <.0010, 1 and 2 < 4 Rheumatoid arthritis4.2 (23)1.7 (5)0.0 (0)2.3 (7)7.3 (8)Χ^2^ = 13.69, p = .0081 < 4Cancer diagnosisΧ^2^ = 25.74, p = .012 Breast cancer39.4 (214)36.4 (108)52.9 (46)42.7 (129)38.5 (42)NS Gastrointestinal cancer30.9 (168)37.4 (111)14.9 (13)29.1 (88)26.6 (29)0 and 1 > 2 Gynecological cancer16.9 (92)14.1 (42)24.1 (21)18.5 (56)22 (20.2)NS Lung cancer12.7 (69)12.1 (36)8.0 (7)9.6 (29)14.7 (16)NSPrior cancer treatmentΧ^2^ = 15.98, p = .192 No prior treatment24.4 (128)28.6 (82)31.4 (27)22.1 (66)21.0 (22) Only surgery, CTX, or RT41.3 (217)39.7 (114)46.5 (40)44.3 (132)41.9 (44) Surgery and CTX, or surgery and RT, or CTX and RT21.1 (111)20.9 (60)15.1 (13)18.8 (56)17.1 (18)Surgery and CTX and RT13.1 (69)10.8 (31)7.0 (6)14.8 (44)20.0 (21)Metastatic sitesΧ^2^ = 20.84, p = .053 No metastasis31.7 (169)29.9 (87)40.2 (35)34.3 (103)30.3 (33) Only lymph node metastasis17.8 (95)26.5 (77)23.0 (20)22.0 (66)30.3 (33) Only metastatic disease in other sites23.3 (124)21.6 (63)12.6 (11)20.7 (62)17.4 (19) Metastatic disease in lymph nodes and other sites27.2 (145)22.0 (64)24.1 (21)23.0 (69)22.0 (24) Receipt of targeted therapy (%yes)34.6 (182)29.3 (85)28.7 (25)23.7 (71)26.6 (29)Χ^2^ = 11.62, p = .0200 > 3CTX regimenΧ^2^ = 21.09, p = .007 Only CTX65.4 (344)70.7 (205)71.3 (62)76.3 (228)73.4 (80)0 < 3 Only targeted therapy4.9 (26)1.0 (3)1.1 (1)2.3 (7)1.8 (2)0 > 1 Both CTX and targeted therapy29.7 (156)28.3 (82)27.6 (24)21.4 (64)24.8 (27)NSCycle lengthKW = 11.15, p = .025No significant pw contrasts 14 day cycle37.8 (204)48.1 (142)35.6 (31)47.1 (140)38.3 (41) 21 day cycle53.5 (289)44.4 (131)62.1 (54)45.8 (136)57.0 (61) 28 day cycle8.7 (47)7.5 (22)2.3 (2)7.1 (21)4.7 (5)Emetogenicity of the CTX regimenKW = 24.00, p <.0010 < 1, 2 and 3 Minimal/low24.4 (132)14.2 (42)12.6 (11)19.5 (58)15.0 (16) Moderate61.0 (330)66.4 (196)59.8 (52)55.6 (165)62.6 (67) High14.6 (79)19.3 (57)27.6 (24)24.9 (74)22.4 (24)Antiemetic regimenΧ^2^ = 56.50, p <.001 None10.1 (53)4.1 (12)1.1 (1)8.0 (23)2.9 (3)0 > 1 Steroid alone or serotonin receptor antagonist alone23.4 (123)18.5 (54)23.0 (20)18.5 (53)14.4 (15)NS Serotonin receptor antagonist and steroid46.8 (246)57.5 (168)40.2 (35)43.2 (124)43.3 (45)1 > 0, 2 and 3 NK-1 receptor antagonist and two other antiemetics19.8 (104)19.9 (58)35.6 (31)30.3 (87)39.4 (41)0 and 1 < 2, 3 and 4^a^Total number of metastatic sites evaluated was 9^+^Reference groupCIN Chemotherapy-induced nausea; CTX chemotherapy; kg kilograms; KW Kruskal Wallis; m^2^ meters squared; pw pairwise; NK-1 neurokinin-1; NS not significant; RT radiation therapy; SD standard deviation
Neuropsychological symptom scores
Compared to the Both Low-AMF and the Changing CIN-Low AMF classes, the other three classes had higher levels of depression, sleep disturbance, and morning and evening fatigue (Table 4). Compared to the Both Low-AMF, the Changing CIN-Low AMF and the Both Changing-AMF classes, the other two classes reported higher levels of trait and state anxiety and lower levels of attentional function. Compared to the Both Low-AMF and the Changing CIN-Low AMF classes, the High CIN-Moderate AMF and the Both High-AMF classes reported higher occurrence rates for both cancer and non-cancer pain. Compared to the other four classes, the Both High-AMF had higher worst pain intensity scores. Table 4. Differences in Neuropsychological Symptom Severity Scores Among the CIN and Morning Fatigue Latent Profiles at EnrollmentNeuropsychological Symptom ScoresNo CIN and Low Morning FatigueChanging CIN and Low Morning FatigueChanging CIN and Changing Morning FatigueHigh CIN and Moderate Morning FatigueHigh CIN and High Morning FatigueStatistics(0)(1)(2)(3)(4)40.6% (n=543)22.2% (n=297)6.5% (n=87)22.6% (n=302)8.1% (n=109)Mean (SD)Mean (SD)Mean (SD)Mean (SD)Mean (SD)Center for Epidemiological Studies Depression Scale (≥16.0)10.3 (8.5)8.8 (6.1)14.7 (9.5)16.7 (9.2)24.6 (11.7)F = 92.27, p <.0010 and 1 < 2, 3 and 4;2 and 3 < 4Trait Anxiety Inventory (≥32.2)32.9 (9.7)31.3 (7.8)35.7 (9.8)39.2 (10.3)45.6 (11.2)F = 62.69, p < .0010, 1 and 2 < 3 and 4;1 < 2; 3 < 4State Anxiety Inventory (≥ 31.8)31.2 (11.2)30.2 (10.2)33.3 (11.1)37.8 (11.8)47.3 (14.2)F = 60.73, p < .0010, 1 and 2 < 3 and 4; 3 < 4Attentional Function Index(≤ 5 low, 5–7.5 moderate, > 7.5 high)6.8 (1.7)7.1 (1.6)6.3 (1.8)5.6 (1.4)4.6 (1.9)F = 65.71, p < .0010, 1 and 2 > 3 and 4; 0 < 1; 1 > 2; 3 > 4General Sleep Disturbance Scale (≥ 43.0)46.7 (19.5)43.9 (15.7)56.0 (18.3)62.3 (16.8)74.9 (16.70)F = 94.58, p <.0010 and 1 < 2, 3 and 4;2 < 3 and 4;3 < 4Morning fatigue (≥ 3.2)2.5 (2.1)1.8 (1.4)3.6 (2.3)4.2 (1.6)6.6 (1.8)F = 170.82, p < .0010 and 1 < 2, 3 and 40 > 1; 2 and 3 < 4Evening fatigue (≥ 5.6)4.8 (2.2)4.8 (2.1)5.8 (2.3)5.9 (1.6)7.6 (1.5)F = 54.30, p <.0010 and 1 < 2 ,3, and 4;2 and 3 < 4Morning energy (≤ 6.2)4.6 (2.3)4.7 (2.4)4.2 (2.1)4.1 (1.7)3.1 (2.3)F = 13.45, p <.0010 and 1 > 3 and 4;2 and 3 > 4Evening energy (≤ 3.5)3.8 (2.0)3.5 (2.0)3.4 (2.2)3.6 (1.9)2.3 (1.8)F = 11.87, p < .0010,1, 2 and 3 > 4Type of pain (% (n))Χ^2^ = 82.95, p < .001 No pain33.8 (181)30.1 (88)21.2 (18)20.4 (60)11.3 (12)0 > 3 and 4, 1 > 4; Only non-cancer pain18.1 (97)18.8 (55)5.9 (5)13.6 (40)11.3 (12)0 and 1 > 2 Only cancer pain22.0 (118)29.5 (86)40.0 (34)28.2 (83)23.6 (25)0 < 2 Both cancer and non-cancer pain26.1 (140)21.6 (63)32.9 (28)37.8 (111)53.8 (57)0 and 1 < 3 < 4Worst pain intensity5.8 (2.5)5.3 (2.4)6.5 (2.4)6.2 (2.5)7.8 (2.3)F = 15.81, p <.0010, 1, 2, and 3 < 4;1 < 2 and 3Number of pain locations (out of 45)26.6 (22.1)29.2 (21.5)32.1 (20.5)33.4 (19.7)35.9 (18.1)F = 7.91 p <.0010 < 3 and 4; 1 < 4Pain interference2.6 (2.4)2.3 (2.0)3.2 (2.5)3.8 (2.4)5.2 (2.7)F = 31.92, p <.0010 and 1 < 3 and 4;2 and 3 < 4Numbers in parentheses represent clinically meaningful cutpoint scores for the symptom measures CIN chemotherapy-induced nausea; SD standard deviation
Gastrointestinal symptom occurrence rates
Compared to the Both Low-AMF and the Changing CIN-Low AMF classes, the High CIN-Moderate AMF and the Both High-AMF classes reported higher occurrence rates for dry mouth, feeling bloated, difficulty swallowing, and change in the way food tastes (Table 5). Compared to the Both Low-AMF class, the other four classes reported higher occurrence rates for vomiting. Compared to the Both Low-AMF class, the Changing CIN-Low AMF, High CIN-Moderate AMF, and the Both High-AMF classes reported higher occurrence rates for diarrhea and constipation. Table 5. Differences in the occurrence of gastrointestinal symptoms among the CIN and morning fatigue latent profiles at enrollmentOccurrence of symptomsNo CIN and Low Morning Fatigue (0)40.6% (n = 543)Changing CIN and Low Morning Fatigue (1)22.2% (n = 297)Changing CIN and Changing Morning Fatigue (2)6.5% (n = 87)High CIN and Moderate Morning Fatigue (3)22.6% (n = 302)High CIN and High Morning Fatigue(4)8.1% (n = 109)Statistics% (n)% (n)% (n)% (n)% (n)Dry mouth38.6 (209)42.2 (125)44.8 (39)55.6 (165)60.7 (65)Χ^2^ = 33.97, p <.0010 and 1 < 3 and 4Feeling bloated23.8 (129)29.4 (87)33.3 (29)45.8 (136)55.1 (59)Χ^2^ = 68.07, p <.0010 and 1 < 3 and 4;2 < 4Vomiting3.5 (19)13.2 (39)18.4 (16)22.2 (66)22.4 (24)Χ^2^ = 79.33, p <.0010 < 1, 2, 3 and 4;1 < 3Diarrhea21.4 (116)32.1 (95)34.5 (30)36 (107)42.1 (45)Χ^2^ = 33.23, p <.0010 < 1, 3 and 4Lack of appetite28.8 (156)39.5 (117)34.5 (30)60.6 (180)61.7 (66)Χ^2^ = 101.07, p <.0010, 1 and 2 < 3 and 4;0 < 1Increased appetite22.1 (120)24.0 (71)34.5 (30)30.3 (90)30.8 (33)Χ^2^ = 12.26, p =.016No significant pw contrastsAbdominal cramps15.9 (86)20.3 (60)19.5 (17)30.6 (91)42.1 (45)Χ^2^ = 49.71, p <.0010, 1 and 2 < 4;0 and 1 < 3Difficulty swallowing8.3 (45)11.5 (34)9.2 (8)20.2 (60)33.6 (36)Χ^2^ = 62.42, p <.0010 and 1 < 3 and 4;2 < 4Mouth sores17.0 (92)17.6 (52)19.5 (17)30.0 (89)26.2 (28)Χ^2^ = 23.69, p <.0010 and 1 < 3Weight loss20.1 (109)26.0 (77)17.2 (15)31.3 (93)38.3 (41)Χ^2^ = 26.13, p <.0010 and 2 < 4;0 < 3Weight gain24.0 (130)22.3 (66)32.2 (28)25.9 (77)33.6 (36)Χ^2^ = 8.08, p =.089Constipation33.8 (183)44.3 (131)41.4 (36)55.9 (166)57.9 (62)Χ^2^ = 48.78, p <.0010 < 1, 3 and 4;1 < 3 and 4Change in way food tastes39.5 (214)48.3 (143)52.9 (46)61.6 (183)65.4 (70)Χ^2^ = 50.60, p <.0010 and 1 < 3 and 4CIN chemotherapy-induced nausea, pw pairwise
CIN and evening fatigue
Latent class analysis
The 543 patients who had ≤ 1 occurrence of CIN over the six assessments had low evening fatigue scores and were labeled No CIN and Low Evening Fatigue (Both Low-PMF). For the joint CIN-evening fatigue LCPA, a 3-class solution was selected (see details on Table 2). As shown in Fig. 2, 40.6% of the patients were in the No CIN and Low Evening Fatigue class (i.e., Both Low-PMF); 15.7% were in the Changing CIN and Low Evening Fatigue class (i.e., Changing CIN-Low PMF); 22.8% were in the Changing CIN and High Evening Fatigue class (i.e., Changing CIN-High PMF); and 20.9% were in the High CIN and High Evening Fatigue class (i.e., Both High-PMF). For the Changing CIN-Low PMF class and Changing CIN-High PMF class, the occurrence of CIN increased at assessments 2 and 5, while severity of evening fatigue scores remained stable over time. For the Both Low-PMF and Both High-PMF classes, CIN occurrence rates and evening fatigue severity scores remained relatively stable over time.Fig. 2. Occurrence of chemotherapy-induced nausea (CIN, left y-axis; percentage of patients reporting CIN occurrence) and evening fatigue (PM-F, right y-axis; higher scores indicate higher levels of fatigue) scores over two cycles of chemotherapy for subgroups of oncology patients with No CIN and Low Evening Fatigue class (A), Changing CIN and Low Evening Fatigue class (B), Changing CIN and High Evening Fatigue class (C), and High CIN and High Evening Fatigue class (D)
Demographic and clinical characteristics
Compared to the Both Low-PMF class, the other three classes were younger and were more likely to receive highly emetogenic chemotherapy (Table 6). Compared to the Both Low-PMF and Changing CIN-Low PMF classes, the other two classes were more likely to have childcare responsibilities and lower KPS scores. Compared to the Both Low-PMF and the Changing CIN-Low PMF classes, the Both High-PMF class was more likely to have a higher number of comorbid conditions and a higher SCQ score. Compared to the Both Low-PMF class, the Changing CIN-Low PMF and Both High-PMF classes were likely to have a lower annual household income and receive only chemotherapy. Table 6. Differences in Demographic and Clinical Characteristics among the CIN and Evening Fatigue Latent Profiles at EnrollmentCharacteristicNo CIN and Low Evening FatigueChanging CIN and Low Evening FatigueChanging CIN and High Evening FatigueHigh CIN and High Evening FatigueStatistics(0)(1)(2)(3)40.6% (n=543)15.7% (n=210)22.9% (n=306)20.9% (n=279)Mean (SD)Mean (SD)Mean (SD)Mean (SD)Age (years)60.0 (12.1)57.0 (12.8)54.8 (12.0)54.5 (11.8)F = 18.22, p < .0010 > 1, 2 and 3Education (years)16.3 (3.1)16.0 (3.0)16.3 (2.8)16.1 (3.1)F = 0.54, p = .655Body mass index (kg/m^2^)26.2 (5.4)26.0 (5.3)26.1 (5.8)26.5 (6.2)F = 0.38, p = .769Alcohol Use Disorders Identification Test score3.1 (2.3)2.8 (2.4)3.0 (2.7)2.8 (2.6)F = 0.70, p = .553Karnofsky Performance Status score (KPS)83.1 (11.8)81.3 (12.9)78.3 (11.9)74.8 (12.1)F = 31.06, p < .0010 and 1 > 2 and 3;2 > 3Number of comorbid conditions2.3 (1.4)2.3 (1.4)2.4 (1.4)2.6 (1.5)F = 3.35, p = .0180 and 1 < 3Self-administered Comorbidity Questionnaire score5.2 (3.0)5.1 (3.0)5.6 (3.2)6.1 (3.6)F = 6.13, p < v.0010 and 1 < 3Time since diagnosis (years)2.2 (4.3)1.8 (3.9)1.8 (3.2)1.8 (3.7)KW = 2.52, p = .472Time since diagnosis (years, median)0.440.430.420.39Number of prior cancer treatments1.7 (1.6)1.5 (1.4)1.6 (1.5)1.6 (1.5)F = 0.95, p = .416Number of metastatic sites including lymph node involvement^a^1.3 (1.3)1.2 (1.1)1.2 (1.2)1.2 (1.3)F = 1.41, p = .239Number of metastatic sites excluding lymph node involvement0.9 (1.1)0.7 (1.0)0.7 (1.0)0.7 (1.0)F = 2.88, p = .035No significant pairwise contrastsMAX2 score0.16 (0.09)0.18 (0.08)0.19 (0.08)0.17 (0.07)F = 6.38, p < .0010 < 2; 2 > 3% (n)% (n)% (n)% (n)Gender (% female)72.9 (395)77.1 (162)85.0 (260)79.9 (223)Χ^2^ = 17.48, p < .0010 < 2Self-reported ethnicityΧ^2^ = 19.47, p = .021 White70.5 (378)61.1 (127)75.4 (227)68.1 (188)1 < 2 Asian or Pacific Islander11.9 (64)17.8 (37)10.3 (31)12.0 (33)NS Black8.4 (45)8.7 (18)5.3 (16)5.8 (16)NS Hispanic, Mixed, or Other9.1 (49)12.5 (26)9.0 (27)14.1 (39)NSMarried or partnered (% yes)67.2 (359)63.1 (130)64.7 (196)59.8 (165)Χ^2^ = 4.59, p = .204Lives alone (% yes)19.5 (104)20.4 (42)22.0 (67)25.7 (71)Χ^2^ = 4.42, p = .220Currently employed (% yes)36.4 (196)32.5 (67)37.7 (114)31.7 (88)Χ^2^ = 3.40, p = .335Annual household incomeKW = 13.41, p = .0040 > 1 and 3 Less than 30,000^+^13.8 (66)20.9 (38)17.2 (48)26.4 (68) 30,000 to 70,000 to 100,00046.3 (222)35.2 (64)45.5 (127)42.6 (110)Child care responsibilities (% yes)18.0 (96)15.8 (32)27.4 (82)29.2 (80)Χ^2^ = 22.81, p <.0010 and 1 < 2 and 3Elder care responsibilities (% yes)7.5 (37)8.9 (17)5.7 (16)10.4 (26)Χ^2^ = 4.33, p = .228Past or current history of smoking (% yes)37.6 (200)26.7 (55)33.8 (102)39.1 (108)Χ^2^ = 9.97, p = .0190 and 3 > 1Exercise on a regular basis (% yes)70.5 (378)73.9 (150)75.5 (225)63.8 (173)Χ^2^ = 10.50, p = .0152 > 3 Heart disease7.0 (38)11.0 (5.2)3.3 (10)6.5 (18)Χ^2^ = 5.39, p = .145 High blood pressure32.8 (178)30.5 (64)27.1 (83)28.7 (80)Χ^2^ = 3.40, p = .334 Lung disease12.9 (70)7.6 (16)9.8 (30)12.5 (35)Χ^2^ = 5.33, p = .149 Diabetes7.9 (43)10.0 (21)8.5 (26)11.1 (31)Χ^2^ = 2.63, p = .452 Ulcer or stomach disease3.5 (19)5.7 (12)4.9 (15)6.8 (19)Χ^2^ = 4.80, p = .187 Kidney disease0.6 (3)1.4 (3)2.3 (7)2.2 (6)Χ^2^ = 5.63, p = .131 Liver disease6.6 (36)5.7 (12)5.2 (16)7.9 (22)Χ^2^ = 1.93, p = .587 Anemia or blood disease9.2 (50)11.9 (25)15.4 (47)15.1 (42)Χ^2^ = 9.49, p = .0230 < 2 Depression14.2 (77)16.2 (34)22.5 (69)27.6 (77)Χ^2^ = 24.94, p < .0010 < 2 and 3;1 < 3 Osteoarthritis13.8 (75)10.5 (22)11.1 (34)11.5 (32)Χ^2^ = 2.38, p = .497 Back pain23.6 (128)22.9 (48)25.8 (79)31.9 (89)Χ^2^ = 7.79, p = .051 Rheumatoid arthritis4.2 (23)1.9 (4)2.0 (6)3.6 (10)Χ^2^ = 4.65, p = .199Cancer diagnosisΧ^2^ = 20.01, p = .018 Breast cancer39.4 (214)34.3 (72)45.8 (140)40.5 (113)NS Gastrointestinal cancer30.9 (168)38.1 (80)22.5 (69)33.0 (92)1 and 3 > 2 Gynecological cancer16.9 (92)18.1 (38)20.6 (63)14.3 (40)NS Lung cancer12.7 (69)9.5 (20)11.1 (34)12.2 (34)NSPrior cancer treatmentΧ^2^ =14.48, p = .106 No prior treatment24.4 (128)27.8 (57)22.2 (66)27.0 (74) Only surgery, CTX, or RT41.3 (217)39.5 (81)45.1 (134)42.0 (115) Surgery and CTX, or surgery and21.1 (111)23.4 (48)20.2 (60)14.2 (39) RT, or CTX and RT Surgery and CTX and RT13.1 (69)9.3 (19)12.5 (37)16.8 (46)Metastatic sitesΧ^2^ = 16.36, p = .060 No metastasis31.7 (169)29.0 (60)32.9 (100)35.5 (98) Only lymph node metastasis17.8 (95)27.1 (56)25.3 (77)22.8 (63) Only metastatic disease in other sites23.3 (124)22.2 (46)20.1 (61)17.4 (48) Metastatic disease in lymph nodes and other sites27.2 (145)21.7 (45)21.7 (66)24.3 (67)Receipt of targeted therapy (% yes)34.6 (182)24.4 (50)29.7 (90)25.3 (70)Χ^2^ = 11.35, p = .0100 > 1 and 4CTX regimenΧ^2^ = 19.95, p = .003 Only CTX65.4 (344)75.6 (155)70.3 (213)74.7 (207)0 < 1 and 3 Only targeted therapy4.9 (26)0.5 (1)2.6 (8)1.4 (4)0 > 1 Both CTX and targeted therapy29.7 (156)23.9 (49)27.1 (82)66 (23.8)NSCycle lengthKW = 19.54, p < .001 14 day cycle37.8 (204)48.8 (101)36.5 (111)51.6 (142)0 and 2 > 3; 21 day cycle53.5 (289)45.4 (94)57.2 (174)41.5 (114)0 > 1 28 day cycle8.7 (47)5.8 (12)6.3 (19)6.9 (19)Emetogenicity of the CTX regimenKW = 22.89, p < .0010 < 1, 2 and 3 Minimal/low24.4 (132)12.6 (26)16.8 (51)18.2 (50) Moderate61.0 (330)68.6 (142)61.8 (188)54.5 (150) High14.6 (79)18.8 (39)21.4 (65)27.3 (75)Antiemetic regimenΧ^2^ = 34.49, p < .001 None10.1 (53)3.0 (6)5.3 (16)6.4 (17)0 > 1 Steroid alone or serotonin receptor antagonist alone23.4 (123)22.2 (45)18.3 (55)15.8 (42)NS Serotonin receptor antagonist and steroid46.8 (246)51.2 (104)49.8 (150)44.4 (118)NS NK-1 receptor antagonist and two other antiemetics19.8 (104)23.6 (48)26.6 (80)33.5 (89)0 < 3^a^Total number of metastatic sites evaluated was 9^+^Reference groupCIN chemotherapy-induced nausea; CTX chemotherapy; kg kilograms; KW Kruskal Wallis; m^2^ meters squared; pw = pairwise; NK-1 neurokinin-1; NS not significant, RT radiation therapy, SD standard deviation
Neuropsychological symptom scores
Compared to the Both Low-PMF and Changing CIN-Low PMF classes, the other two classes reported higher levels of depression, trait anxiety, sleep disturbance, morning and evening fatigue, and pain interference, as well as lower levels of cognitive function and evening energy (Table 7). Compared to the Both Low-PMF class, the Changing CIN-High PMF and Both High-PMF classes reported lower levels of morning energy, were more likely to report cancer and/or non-cancer pain, and a higher number of pain locations. Compared to the other three classes, the Both High-PMF class had higher state anxiety scores. Table 7. Differences in Neuropsychological Symptom Severity Scores among the CIN and Evening Fatigue Latent Profiles at EnrollmentNeuropsychological Symptom ScoresNo CIN and Low Evening FatigueChanging CIN and Low Evening FatigueChanging CIN and High Evening FatigueHigh CIN and High Evening FatigueStatistics(0)(1)(2)(3)40.6% (n=543)15.7% (n=210)22.9% (n=306)20.9% (n=279)Mean (SD)Mean (SD)Mean (SD)Mean (SD)Center for Epidemiological Studies Depression Scale (≥ 16.0)10.3 (8.5)10.9 (7.9)14.8 (10.4)17.1 (10.4)F = 38.96, p < .0010 and 1 < 2 and 3;2 < 3Trait Anxiety Inventory (≥ 32.2)32.9 (9.7)33.6 (10.0)36.9 (10.8)38.7 (10.7)F = 23.14, p < .0010 and 1 < 2 and 3State Anxiety Inventory ≥ 31.8)31.2 (11.2)32.5 (11.5)35.4 (13.2)38.4 (12.8)F = 24.16, p < .0010, 1 and 2 < 3;0 < 2Attentional Function Index(< 5 low, 5–7.5 moderate, > 7.5 high)6.8 (1.7)6.9 (1.8)6.0 (1.7)5.7 (1.8)F = 31.66, p < .0010 and 1 > 2 and 3General Sleep Disturbance Scale (≥ 43.0)46.7 (19.5)46.5 (18.1)56.8 (18.3)63.3 (19.6)F = 56.44, p < .0010 and 1 < 2 and 3;2 < 3Morning fatigue (≥ 3.2)2.5 (2.1)2.2 (1.9)3.8 (2.2)4.2 (2.3)F = 59.21, p < .0010 and 1 < 2 and 3Evening fatigue (≥ 5.6)4.8 (2.2)3.5 (1.7)6.4 (1.6)6.5 (1.6)F = 147.26, p < .0010 and 1 < 2 and 3;0 > 1Morning energy (≤ 6.2)4.6 (2.3)4.5 (2.4)4.2 (2.1)4.1 (2.1)F = 5.24, p = .0010 > 2 and 3Evening energy (≤ 3.5)3.8 (2.0)3.9 (2.0)3.2 (2.0)3.2 (1.9)F = 10.50, p < .0010 and 1 > 2 and 3Type of pain (% (n))Χ^2^ = 46.54, p < .001 No pain33.8 (181)28.3 (58)19.9 (59)22.2 (61)0 > 2 and 3 Only non-cancer pain18.1 (97)17.6 (36)13.1 (39)13.5 (37)NS Only cancer pain22.0 (118)25.4 (52)36.0 (107)25.1 (69)0 and 3 < 2 Both cancer and non-cancer pain26.1 (140)28.8 (59)31.0 (92)39.3 (108)0 < 3Worst pain intensity5.8 (2.5)5.4 (2.7)6.1 (2.4)6.8 (2.4)F = 8.27, p < .0010, 1 and 2 < 3Number of pain locations (out of 45)26.6 (22.1)29.4 (21.5)33.5 (19.6)32.4 (20.2)F = 8.81, p < .0010 < 2 and 3Pain interference2.6 (2.4)2.4 (2.1)3.2 (2.5)4.3 (2.5)F = 24.88, p < .0010 and 1 < 2 and 3;2 < 3Numbers in parentheses represent clinically meaningful cutpoint scores for the symptom measures CIN chemotherapy-induced nausea; SD standard deviation; NS not significant
Gastrointestinal symptom occurrence rates
Compared to the Both Low-PMF class, the Changing CIN-High PMF class and the Both High-PMF classes reported higher occurrence rates for dry mouth, feeling bloated, and abdominal cramps (Table 8). Compared to the Both Low-PMF class, the other three classes reported higher occurrence rates for vomiting, diarrhea, lack of appetite, constipation, and change in the way food tastes. Table 8. Differences in the occurrence of gastrointestinal symptoms among the CIN and evening fatigue latent profiles at enrollmentOccurrence of symptomsNo CIN and Low Evening Fatigue(0)40.6% (n = 543)Changing CIN and Low Evening Fatigue(1)15.7% (n = 210)Changing CIN and High Evening Fatigue(2)22.9% (n = 306)High CIN and High Evening Fatigue(3)20.9% (n = 279)Statistics% (n)% (n)% (n)% (n)Dry mouth38.6 (209)41.8 (87)50.7 (154)55.6 (153)Χ^2^ = 26.32, p <.0010 < 2 and 3;1 < 3Feeling bloated23.8 (129)30.3 (63)37.8 (115)48.4 (133)Χ^2^ = 53.91, p <.0010 < 2 and 31 < 3Vomiting3.5 (19)20.2 (42)13.2 (40)22.9 (63)Χ^2^ = 79.55, p <.0010 < 1, 2, and 3;2 < 3Diarrhea21.4 (116)37.0 (77)33.9 (103)35.3 (97)Χ^2^ = 29.91, p <.0010 < 1, 2 and 3Lack of appetite28.8 (156)42.8 (89)43.8 (133)62.2 (171)Χ^2^ = 85.43, p <.0010 < 1, 2 and 3;1 and 2 < 3Increased appetite22.1 (120)26.0 (54)28.3 (86)30.5 (84)Χ^2^ = 7.99, p =.046No significant pairwise contrastsAbdominal cramps15.9 (86)21.2 (44)24.7 (75)34.2 (94)Χ^2^ = 36.24, p <.0010 < 2 and 3;1 < 3Difficulty swallowing8.3 (45)16.3 (34)12.8 (39)23.6 (65)Χ^2^ = 37.58, p <.0010 < 1 and 3;2 < 3Mouth sores17.0 (92)17.3 (36)22.0 (67)30.2 (83)Χ^2^ = 21.23, p <.0010 and 1 < 3Weight loss20.1 (109)25.5 (53)27.3 (83)32.7 (90)Χ^2^ = 16.43, p <.0010 < 3Weight gain24.0 (130)27.4 (57)25.3 (77)26.5 (73)Χ^2^ = 1.21, p =.752Constipation33.8 (183)45.7 (95)48.4 (147)55.6 (153)Χ^2^ = 40.70, p <.0010 < 1, 2 and 3Change in way food tastes39.5 (214)51.0 (106)54.3 (165)62.2 (171)Χ^2^ = 42.39, p <.0010 < 1, 2 and 3CIN chemotherapy-induced nausea
Discussion
This study is the first to use LCPA to identify subgroups of oncology patients with distinct joint profiles for CIN with either morning fatigue or evening fatigue over two cycles of chemotherapy. Across both LCPAs, 60% of the sample reported CIN with occurrence rates that ranged from approximately 30% to 90%. In addition, wide variations were found in both morning and evening fatigue severity scores depending on the distinct profile. These initial findings suggest that CIN co-occurs with both morning and evening fatigue. Future studies need to determine which symptom is driving the occurrence/severity of the other symptom.
While it is not readily apparent why five distinct profiles were found with the morning analyses and four with the evening analyses (Figs. 1 and 2), some patterns are worth noting. For both LCPA that included patients without CIN (i.e., 40.6% of the sample), morning and evening fatigue scores were below the clinically meaningful cutoffs. Equally important, for both LCPAs, the worse class had high levels of both symptoms and constituted between 8.1% (morning) and 20.9% (evening) of the sample. A final pattern that is worth noting is that for one or two of the morning and evening profiles, the occurrence rates for CIN changed with the highest rates reported in the weeks after the administration of chemotherapy (i.e., weeks 2 and 5). These findings suggest that within the various patient profiles, while both morning and evening fatigue exhibit relatively stable trajectories, nausea is a much more dynamic symptom.
Additional research is warranted to explain these findings including an evaluation of diurnal variations in the occurrence of nausea and their association with morning and evening fatigue; the influence of adherence with and patterns of use of anti-emetic regimens on latent class membership; and associations between the use of pharmacologic and non-pharmacologic interventions to manage both morning and evening fatigue and latent class membership. Equally important, as noted in the “Introduction” section, CIN and fatigue share common underlying mechanisms (e.g., inflammatory processes [20], alterations in gut-brain axis bidirectional signaling [20, 29]). While studied with individual symptoms, future research needs to evaluate the mechanisms that underlie the co-occurrence of the two symptoms, as well as the inter-individual differences in the severity of the combined symptom profiles. The remainder of the discussion focuses on the common risk factors for the worse co-occurrence profiles across the two LCPAs.
Common risk factors for worse CIN and fatigue profiles
Demographic and clinical factors
Table 9 provides a summary of the characteristics associated with membership in the worse joint profiles compared to the Both Low-AMF and Both Low-PMF classes. Common demographic and clinical characteristics associated with the worse CIN AND fatigue profiles (i.e., High CIN-Moderate AMF, Both High-AMF, and Both High-PMF) were younger age, lower annual income, lower functional status, higher likelihood of reporting depression, and receipt of a neurokinin-1 receptor antagonist and two other antiemetics. Consistent with previous reports, younger age was associated with the occurrence of CIN [46] and higher fatigue severity [47, 48]. This association may be explained by age-related changes in inflammatory processes [49, 50] and/or a “response shift” in older patients’ perceptions of their symptom experience [51]. One potential explanation for the associations with lower annual income is that cancer treatment may impose a significant financial burden on patients (i.e., increased financial toxicity [52]) that decreases their ability to pay for pharmacologic (e.g., antiemetics) and non-pharmacologic (i.e., physical therapy) interventions. Table 9. Characteristics associated with membership in the Joint CIN-Morning Fatigue and Joint CIN-Evening Fatigue classes compared to the No CIN and Low Fatigue classesCharacteristics•CIN-Morning Fatigue classes^+^CIN-Evening Fatigue classes^a^1234123Demographic characteristicsYounger age■■■■■■■More likely to be female■■■Less likely to be married or partnered■More likely to live alone■More likely to have a lower annual income■■■■More likely to have childcare responsibilities■■■Less likely to exercise on a regular basis■Less likely to report a current or past history of smoking■Clinical characteristicsLower KPS score■■■■■Higher number of comorbidities■■Higher SCQ score■■Higher MAX2 score■■More likely to report kidney disease■■More likely to report anemia or blood disease■■More likely to report depression■■■■■More likely to report back pain■Less likely to be diagnosed with gastrointestinal cancer■Less likely to receive targeted therapy■■■More likely to receive only chemotherapy■■■Less likely to receive only targeted therapy■■More likely to receive a 14-day cycle of chemotherapy■■More likely to receive highly emetogenic chemotherapy■■■■■■More likely to receive some type of antiemetics■■More likely to receive serotonin receptor antagonist and steroid■More likely to receive NK-1 RA and two other antiemetics■■■■Neuropsychological symptomsHigher depression■■■■■Higher trait anxiety■■■■Higher state anxiety■■■■Lower attentional function■■■■Higher sleep disturbance■■■■■Higher morning fatigue■■■■■Higher evening fatigue■■■■■Lower morning energy■■■■Lower evening energy■■■Type of pain Less likely to have no pain Less likely to have only non-cancer pain More likely to have only cancer pain More likely to have both cancer and non-cancer pain■■■■■■■■■■Higher worst pain intensity■■Higher number of pain locations■■■■Higher pain interference■■■■Gastrointestinal symptomsDry mouth■■■■Feeling bloated■■■■Vomiting■■■■■■■Diarrhea■■■■■■Lack of appetite■■■■■■Abdominal cramps■■■■Difficulty swallowing■■■■Mouth sores■■Weight loss■■■Constipation■■■■■■Change in way food tastes■■■■■CIN chemotherapy-induced nausea, KPS Karnofsky Performance Status score, NK-1 neurokinin-1, RA receptor antagonist, SCQ Self-administered comorbidity questionnaire•Comparisons done with the No CIN and Low Fatigue classes^+^ CIN-Morning Fatigue classes: 1 = Changing CIN and Low Morning Fatigue class; 2 = Changing CIN and Changing Morning Fatigue class; 3 = High CIN and Moderate Morning Fatigue class; 4 = High CIN and High Morning Fatigue class■Indicates the presence of the risk factor compared with the No CIN and Low Fatigue classes^a^CIN-Evening Fatigue classes: 1 = Changing CIN and Low Evening Fatigue class; Changing CIN and High Evening Fatigue class; 3 = High CIN and High Evening Fatigue class
Consistent with previous reports from our group [8, 12] and others [53], lower physical function was associated with the worse profiles for both LCPAs. In terms of KPS scores, compared to the Both Low-AMF or Both Low-PMF classes, differences in these scores for the High CIN-Moderate AMF class (Cohen’s d = 0.6), Both High-AMF class (Cohen’s d = 1.0), and Both High-PMF class (Cohen’s d = 0.7) represent clinically meaningful decrements in functional status. Given the established evidence that regular exercise can decrease fatigue [54], as well as recent evidence that suggests that physical activity is associated with reductions in nausea and vomiting in patients with lung cancer [55], patients warrant referrals to physical therapy for an exercise prescription and ongoing assessments of their adherence with the regimen and its efficacy.
Neuropsychological symptoms
Compared to the Both Low-AMF or Both Low-PMF classes, patients in the two worse profiles for both LCPAs reported higher scores for depression, state and trait anxiety, sleep disturbance, cognitive impairment, and pain interference, as well as lower scores for morning and evening energy. In addition, the scores reported by the patients in these profiles represent clinically meaningful levels of each of these symptoms (see Tables 4 and 7).
While no studies evaluated symptom burden in patients with distinct CIN and morning or evening fatigue profiles, our findings are consistent with previous reports that demonstrated associations between more severe CIN and higher levels of depression [5, 7], anxiety [5, 7], sleep disturbance [5, 7, 56], and pain [5]. Similarly, positive associations were found between average fatigue scores and higher levels of depression [5, 7], anxiety [5, 7], sleep disturbance [5, 7], cognitive impairment [57], and pain [5]. It is interesting to note that no studies were identified that documented an association between CIN and cognitive impairment. However, in the current study, the AFI scores for the worse classes suggest moderate decrements in cognitive function.
In terms of specific symptoms, among the two worse profiles for the morning and evening LCPAs, 31.8% and 34.3%, respectively, met the criteria for subsyndromal depression (i.e., CES-D scores of between 8 and 15) [36]. In addition, within these two classes, 55.7% of the patients in the morning and 42.5% in the evening LCPAs had CES-D scores that warrant clinical evaluation for depression. These percentages are consistent with previously reported depression rates of 17% to 45% in patients with cancer [58]. Previous studies noted that depression is a risk factor for both CIN and fatigue [3, 5, 59]. Common underlying mechanisms for these three symptoms (e.g., systemic inflammation, disruption of the hypothalamic-pituitary-adrenal axis and/or dysregulation of neurotransmitters including serotonin and substance P [60–64]) may explain these inter-relationships. Future studies need to evaluate the longitudinal relationships among these three symptoms.
Findings from a systematic review determined that the global prevalence rate of anxiety in patients with cancer is 31% [65]. In the current study, except for the Changing CIN-Low AMF class, trait anxiety scores were above the clinically meaningful cutoff for all of the other profiles. In many studies, a trait anxiety score of ≥ 40 indicates a need for a clinical evaluation for an anxiety disorder [37]. Across the two worst morning and evening LCPAs, 51.2% and 37.2% of the patients, respectively, met this cutoff score. While anxiety or “psychological distress” is common in patients receiving chemotherapy, more studies have evaluated for associations between nausea and anxiety compared to nausea and fatigue. In fact, higher levels of anxiety are associated with anticipatory and persistent nausea in patients receiving chemotherapy [66]. Findings from the current study suggest that anxiety is exacerbated by the co-occurrence of more severe CIN and fatigue. While the molecular mechanisms that underlie anxiety are not well understood, findings from a systematic review suggest that alterations in the HPA axis, serotonergic signaling, and gamma-aminobutyric acid metabolism contribute to the occurrence and severity of this symptom [67].
Across all of the profiles in the morning and evening LCPAs, sleep disturbance scores were above the clinically meaningful cutoff. While previous joint LPAs of sleep disturbance and morning and evening fatigue are not reported, the higher sleep disturbance scores in the worse profiles make clinical sense and are supported by cross-sectional analyses of patients receiving chemotherapy [68–70]. In addition, studies documented positive relationships between the severity of nausea and sleep disturbance in oncology patients [6, 56]. A future analysis will evaluate for distinct patient profiles using longitudinal measures of CIN and sleep disturbance.
The AFI evaluates patients’ perceived effectiveness in performing daily activities that are supported by attention and working memory [71]. Across the two worst morning and evening LCAs, AFI scores suggest moderate to high levels of cognitive impairment. In our previous studies with the same sample [72, 73], a joint LPA of AFI and evening fatigue scores demonstrated a dose response relationship between the two symptoms with patients classified into Low, Moderate, and High classes. No studies were identified that evaluated the relationships between nausea and cognitive impairment in patients receiving chemotherapy. Given that higher levels of stress were associated with membership in the Moderate and High joint fatigue and cognitive function profiles [73] and stress contributes to increases in CIN [11], a joint LCPA of CIN and AFI scores is warranted.
Previous work from our group [16] and others [74] demonstrated that decrements in energy are a distinct symptom from fatigue. Energy is described as an individual’s potential to perform physical and mental activities [74]. While joint latent variable models of fatigue and energy or CIN and energy are not available, for the two worst morning and evening LCPAs, both the morning and evening energy scores were below the clinically meaningful cutoffs. Of note, the morning energy levels for all of these patients were extremely low. Additional research is warranted to determine the specific causes for these significant decrements in energy.
The relationships between the various pain characteristics (i.e., type of pain, worst pain intensity, number of pain locations, pain interference) and the various morning and evening CIN and fatigue profiles are complex (Tables 4 and 7). In our previous joint LPA of morning fatigue and pain with the same sample [75], five distinct profiles were identified, with 44% of the sample having high levels of both morning fatigue and pain. Other cross-sectional studies of patients with cancer support this positive association [76, 77]. Less is known about the relationship between CIN and pain in patients receiving chemotherapy and warrants evaluation in future studies.
Gastrointestinal symptoms
The current study is the first to evaluate for associations between distinct joint profiles for CIN with either morning fatigue or evening fatigue and occurrence rates for common gastrointestinal symptoms in patients receiving chemotherapy. As shown in Table 9, the two worse profiles for the morning and evening LCPAs had the highest occurrence rates for the majority of the gastrointestinal symptoms. These findings are consistent with studies that identified associations between CIN and other GI symptoms using a variety of analytic techniques [78–80]. In a study of patients with breast cancer receiving chemotherapy [78], using network analysis, a gastrointestinal symptom cluster was identified that included nausea as the sentinel symptom and lack of appetite and vomiting. In a study of patients with lung cancer [79], using network analysis, a digestive symptom cluster was identified that included nausea, poor appetite, constipation, vomiting, and weight loss. However, no sentinel symptom was identified for this cluster. In another study of patients with ovarian cancer [80], in the multivariable analysis, nausea was associated with abdominal bloating, bowel disturbances, lack of appetite, vomiting, and weight loss. While the list of gastrointestinal symptoms in the current study was more comprehensive, these findings, taken together, suggest that multiple gastrointestinal symptoms co-occur at higher rates in patients with more severe CIN and fatigue profiles.
As noted in the “Introduction” section, in our previous analyses with the same sample [20, 28, 29], several common pathways involved in inflammation (e.g., cytokine-cytokine receptor interaction, chemokine signaling) and alterations in the gut-brain axis (e.g., intestinal immune network for IgA) were perturbed for CIN, as well as for morning and evening fatigue (Table 1). In addition, as noted throughout the “Discussion” section, many of these mechanisms are associated with other common symptoms (e.g., depression, anxiety) in patients receiving chemotherapy. An overall evaluation of the symptom burden of patients in the worse profiles for the morning and evening LCPAs suggests that the multiple mechanisms that underlie these symptoms may have additive or synergistic effects in some patients. Future studies need to determine the sentinel symptom that occurs as a result of these interaction effects; develop targeted interventions for this sentinel symptom; and determine the effects of various pharmacologic and non-pharmacologic interventions on reducing symptom burden among patients with the worse profiles.
Limitations
Several limitations warrant consideration. Given that the sample was primarily female, white, and well-educated, our findings may not generalize to more diverse samples. Since patients had received at least one cycle of chemotherapy, future research needs to evaluate symptoms prior to the initiation of chemotherapy, as well as changes in the joint CIN and fatigue profiles over the entire course of chemotherapy and into survivorship. Given that data were not collected on doses of antiemetics prescribed and changes in antiemetic prescriptions, patients’ adherence with their antiemetic regimen was not evaluated and may have contributed to the changing CIN profiles. In addition, a history of motion sickness as a potential risk factor for CIN was not evaluated [81, 82].
Implications for practice and research
Being the first study to identify joint profiles for CIN and morning and evening fatigue, these findings require replication. In addition, research is needed on the molecular mechanisms that underlie the co-occurrence of these two common symptoms between and among the distinct profiles. Based on the risk factors listed in Table 9, clinicians need to be alert for patients with a high comorbidity burden and a poorer functional status. Oncology clinicians need to consult with primary care providers to ensure the effective management of patients’ chronic conditions. Referrals are warranted to physical therapy to improve patients’ functional status. Equally important, given the significant symptom burden in the worse profiles, clinicians need to perform comprehensive symptom assessments with all patients receiving chemotherapy and initiate interventions. Clinicians need to evaluate if patients are taking their anti-emetics as prescribed and initiate changes to the prescription if needed. Given the higher prevalence rates for the majority of the gastrointestinal symptoms, patients need to be evaluated for nutritional deficits. Clinicians need to assess hydration status and caloric intake; the need for vitamins and mineral supplements; and whether a referral to a dietician is warranted.
The reference list from the paper itself. Each links out to its DOI / PubMed record.
- 1National Comprehensive Cancer Network: Antiemetics. http://www.nccn.org/professionals/physician_gls/pdf/antiemesis.pdf (2024). Accessed.