Assessment of the effects of whole-body muscle and fat mass on bone mineral content based on 628 DXA datasets
Jing Liu, Dongpan Chen, Tanli Min, Ling Bai, Xin Zhang, Sheng Wang, Zun Wang, Mai Chen, Biyun Zhang, Daoming Xu

TL;DR
This study finds that muscle mass is more strongly linked to bone mineral content than fat mass, suggesting muscle maintenance is key for bone health.
Contribution
A unified statistical model is developed to clarify the independent roles of muscle and fat mass in bone mineral content.
Findings
Total muscle mass is the strongest and consistent positive correlate of bone mineral content across all groups.
Total fat mass only positively correlates with bone mineral content in specific subgroups like females and older individuals.
Age negatively correlates with bone mineral content, especially in females.
Abstract
The prevalence of osteoporosis is steadily increasing. Although the relationships between muscle mass, fat mass, and bone mineral content (BMC) have been extensively studied, they remain contentious. This study aimed to develop a unified statistical model to evaluate the independent effects of total muscle and fat mass on BMC, clarify their respective roles in osteoporosis pathogenesis, and inform targeted prevention strategies. We retrospectively analyzed data from 628 subjects who underwent body composition assessment at the Affiliated Hospital of Nanjing University of Chinese Medicine between January 2022 and July 2024. Collected parameters included age, height, weight, body mass index (BMI), total BMC, total muscle mass, total fat mass, and whole-body bone mineral density (BMD) T-scores. Groups were compared by sex, age and whole-body BMD T-score categories. Spearman correlation…
Genes, proteins, chemicals, diseases, species, mutations and cell lines named across the full text — each resolved to its canonical identifier and authoritative record.
Click any figure to enlarge with its caption.
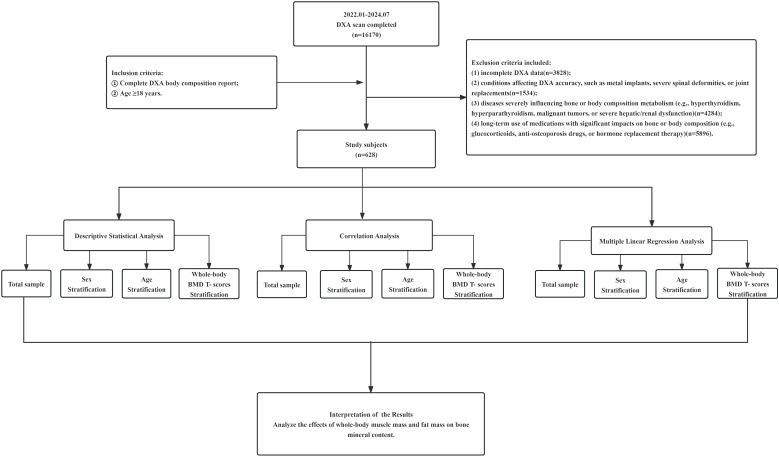 Figure 1
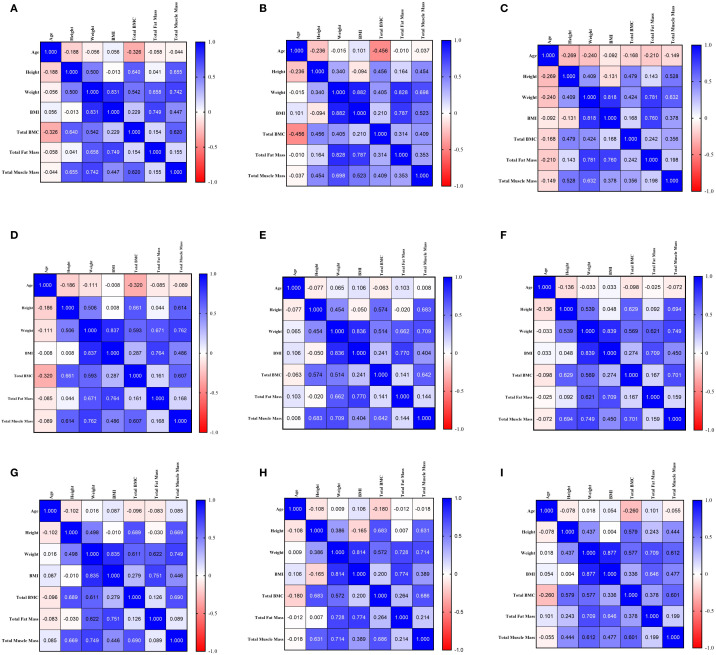 Figure 2
| Variable | Total | Female | Male | Z |
|
|---|---|---|---|---|---|
| Age | 61.00 | 61.00 | 61.50 | -0.059 | 0.953 |
| Height | 160.00 | 159.00 | 170.00 | -14.801 | <0.001 |
| Weight | 60.00 | 59.25 | 70.00 | -10.290 | <0.001 |
| BMI | 23.50 | 23.24 | 24.23 | -2.480 | 0.013 |
| Total BMC | 1904.48 | 1819.75 | 2611.27 | -14.590 | <0.001 |
| Total Muscle mass | 34209.50 | 32606.40 | 45298.25 | -3.928 | <0.001 |
| Total Fat mass | 23185.00 | 23646.50 | 21723.50 | -15.513 | <0.001 |
| T-Score | -0.60 | -0.90 | 0.25 | -7.494 | <0.001 |
| Variable | <60 years | 60–70 years | >70 years | H |
|
|---|---|---|---|---|---|
| Age | 53.00 | 65.00** | 74.00**## | 541.422 | <0.001 |
| Height | 161.00 | 160.00* | 159.00## | 14.334 | <0.001 |
| Weight | 61.00 | 60.00 | 60.00 | 2.125 | 0.346 |
| BMI | 23.31 | 23.53 | 23.71 | 1.397 | 0.497 |
| Total BMC | 2054.07 | 1819.07** | 1783.99## | 54.629 | <0.001 |
| Total | 34246.10 | 34206.40 | 34049.60 | 0.561 | 0.756 |
| Total | 23485.00 | 22623.00 | 23084.00 | 3.396 | 0.183 |
| T-Score | -0.20 | -1.10** | -1.40** | 57.948 | <0.001 |
| Variable | Normal bone mass | Osteopenia | Osteoporosis | H |
|
|---|---|---|---|---|---|
| Age | 58.00 | 65.00*** | 67.00***# | 66.554 | <0.001 |
| Height | 162.00 | 160.00*** | 157.00***## | 62.444 | <0.001 |
| Weight | 62.25 | 60.00 | 55.00***### | 44.621 | <0.001 |
| BMI | 23.66 | 23.78 | 22.31**## | 13.686 | 0.001 |
| Total BMC | 2177.51 | 1717.33*** | 1416.63***### | 378.332 | <0.001 |
| Total | 35854.05 | 34061.10** | 30735.80***### | 55.502 | <0.001 |
| Total | 23247.50 | 23798.00 | 22250.00*## | 9.112 | 0.011 |
| T-Score | 0.20 | -1.70*** | -3.10***### | 478.394 | <0.001 |
| Group | Model | Variable | B |
| t |
| 95.0% CI for B | Adjusted R2 | |
|---|---|---|---|---|---|---|---|---|---|
| Lower bound | Upper bound | ||||||||
| Total Sample ( | Model 1 | (Intercept) | 326.126 | 3.818 | <0.001 | 158.404 | 493.848 | 0.438 | |
| Total Fat mass | 0.005 | 0.061 | 2.012 | 0.045 | 0.000 | 0.009 | |||
| Total Muscle mass | 0.044 | 0.652 | 21.562 | <0.001 | 0.040 | 0.048 | |||
| Model 2 | (Intercept) | 1188.499 | 9.380 | <0.001 | 939.674 | 1437.324 | 0.500 | ||
| Total Fat mass | 0.012 | 0.165 | 3.436 | <0.001 | 0.005 | 0.020 | |||
| Total Muscle mass | 0.046 | 0.687 | 20.695 | <0.001 | 0.042 | 0.051 | |||
| Age | -9.340 | -0.218 | -7.499 | <0.001 | -11.785 | -6.894 | |||
| BMI | -23.776 | -0.169 | -3.242 | 0.001 | -38.177 | -9.374 | |||
| Females | Model 1 | (Intercept) | 758.239 | 8.244 | <0.001 | 577.524 | 938.953 | 0.230 | |
| Total Fat mass | 0.013 | 0.227 | 5.329 | <0.001 | 0.008 | 0.017 | |||
| Total Muscle mass | 0.024 | 0.347 | 8.134 | <0.001 | 0.018 | 0.029 | |||
| Model 2 | (Intercept) | 1716.763 | 14.745 | <0.001 | 1487.995 | 1945.531 | 0.400 | ||
| Total Fat mass | 0.017 | 0.308 | 5.258 | <0.001 | 0.011 | 0.023 | |||
| Total Muscle mass | 0.024 | 0.356 | 8.493 | <0.001 | 0.019 | 0.030 | |||
| Age | -12.730 | -0.395 | -11.111 | <0.001 | -14.981 | -10.479 | |||
| BMI | -13.091 | -0.133 | -2.050 | 0.041 | -25.639 | -0.544 | |||
| Males | Model 1 | (Intercept) | 1354.237 | 4.471 | <0.001 | 754.880 | 1953.593 | 0.126 | |
| Total Fat mass | 0.015 | 0.219 | 2.602 | 0.010 | 0.004 | 0.027 | |||
| Total Muscle mass | 0.021 | 0.259 | 3.079 | 0.003 | 0.007 | 0.034 | |||
| Model 2 | (Intercept) | 1781.819 | 4.174 | <0.001 | 936.916 | 2626.722 | 0.131 | ||
| Total Fat mass | 0.027 | 0.383 | 2.637 | 0.009 | 0.007 | 0.047 | |||
| Total Muscle mass | 0.025 | 0.315 | 3.395 | <0.001 | 0.010 | 0.039 | |||
| Age | -0.840 | -0.024 | -0.275 | 0.783 | -6.879 | 5.198 | |||
| BMI | -34.041 | -0.229 | -1.522 | 0.130 | -78.301 | 10.219 | |||
| Group | Model | Variable | B |
| t |
| 95.0% CI for B | Adjusted R2 | |
|---|---|---|---|---|---|---|---|---|---|
| Lower bound | Upper bound | ||||||||
| <60 years ( | Model 1 | (Intercept) | 810.466 | 6.702 | <0.001 | 572.380 | 1048.552 | 0.360 | |
| Total Fat mass | 0.005 | 0.070 | 1.423 | 0.156 | -0.002 | 0.011 | |||
| Total Muscle mass | 0.034 | 0.589 | 11.977 | <0.001 | 0.028 | 0.039 | |||
| Model 2 | (Intercept) | 1614.917 | 8.014 | <0.001 | 1218.148 | 2011.686 | 0.408 | ||
| Total Fat mass | 0.009 | 0.133 | 1.493 | 0.137 | -0.003 | 0.020 | |||
| Total Muscle mass | 0.035 | 0.604 | 10.253 | <0.001 | 0.028 | 0.041 | |||
| Age | -11.716 | -0.214 | -4.366 | <0.001 | -16.999 | -6.433 | |||
| BMI | -14.468 | -0.120 | -1.230 | 0.220 | -37.635 | 8.699 | |||
| 60–70 years ( | Model 1 | (Intercept) | 115.667 | 0.856 | 0.393 | -150.742 | 382.076 | 0.516 | |
| Total Fat mass | 0.001 | 0.013 | 0.289 | 0.773 | -0.006 | 0.008 | |||
| Total Muscle mass | 0.050 | 0.719 | 15.484 | <0.001 | 0.044 | 0.057 | |||
| Model 2 | (Intercept) | 707.069 | 1.463 | 0.145 | -245.115 | 1659.253 | 0.520 | ||
| Total Fat mass | 0.010 | 0.131 | 1.670 | 0.096 | -0.002 | 0.022 | |||
| Total Muscle mass | 0.053 | 0.763 | 14.587 | <0.001 | 0.046 | 0.061 | |||
| Age | -6.047 | -0.039 | -0.845 | 0.399 | -20.149 | 8.055 | |||
| BMI | -21.978 | -0.151 | -1.785 | 0.076 | -46.241 | 2.285 | |||
| >70 years ( | Model 1 | (Intercept) | -266.411 | -1.415 | 0.159 | -638.973 | 106.152 | 0.549 | |
| Total Fat mass | 0.005 | 0.062 | 1.036 | 0.302 | -0.004 | 0.014 | |||
| Total Muscle mass | 0.058 | 0.736 | 12.257 | <0.001 | 0.048 | 0.067 | |||
| Model 2 | (Intercept) | 420.871 | 0.722 | 0.472 | -733.775 | 1575.516 | 0.561 | ||
| Total Fat mass | 0.015 | 0.190 | 2.268 | 0.025 | 0.002 | 0.028 | |||
| Total Muscle mass | 0.062 | 0.792 | 11.997 | <0.001 | 0.052 | 0.072 | |||
| Age | -4.459 | -0.039 | -0.649 | 0.518 | -18.065 | 9.147 | |||
| BMI | -30.732 | -0.197 | -2.193 | 0.03 | -58.47 | -2.994 | |||
| Group | Model | Variable | B |
| t |
| 95.0% CI for B | Adjusted R2 | |
|---|---|---|---|---|---|---|---|---|---|
| Lower bound | Upper bound | ||||||||
| Normal bone mass | Model 1 | (Intercept) | 744.630 | 7.655 | <0.001 | 553.347 | 935.913 | 0.460 | |
| Total Fat mass | 0.004 | 0.066 | 1.726 | 0.085 | -0.001 | 0.009 | |||
| Total Muscle mass | 0.038 | 0.672 | 17.549 | <0.001 | 0.034 | 0.043 | |||
| Model 2 | (Intercept) | 1147.395 | 8.386 | <0.001 | 878.333 | 1416.458 | 0.484 | ||
| Total Fat mass | 0.016 | 0.240 | 3.537 | <0.001 | 0.007 | 0.024 | |||
| Total Muscle mass | 0.043 | 0.762 | 16.763 | <0.001 | 0.038 | 0.048 | |||
| Age | -2.769 | -0.074 | -1.918 | 0.056 | -5.608 | 0.069 | |||
| BMI | -29.376 | -0.245 | -3.302 | 0.001 | -46.872 | -11.880 | |||
| Osteopenia | Model 1 | (Intercept) | 800.274 | 11.441 | <0.001 | 662.129 | 938.418 | 0.558 | |
| Total Fat mass | 0.003 | 0.084 | 1.583 | 0.115 | -0.001 | 0.006 | |||
| Total Muscle mass | 0.025 | 0.730 | 13.729 | <0.001 | 0.022 | 0.029 | |||
| Model 2 | (Intercept) | 1253.251 | 13.225 | <0.001 | 1066.085 | 1440.417 | 0.660 | ||
| Total Fat mass | 0.014 | 0.432 | 5.635 | <0.001 | 0.009 | 0.019 | |||
| Total Muscle mass | 0.029 | 0.843 | 16.472 | <0.001 | 0.026 | 0.033 | |||
| Age | -2.891 | -0.142 | -3.050 | 0.003 | -4.763 | -1.019 | |||
| BMI | -28.155 | -0.478 | -5.847 | <0.001 | -37.665 | -18.645 | |||
| Osteoporosis | Model 1 | (Intercept) | 837.300 | 9.991 | <.001 | 670.801 | 1003.799 | 0.339 | |
| Total Fat mass | 0.009 | 0.334 | 3.844 | <.001 | 0.004 | 0.013 | |||
| Total Muscle mass | 0.012 | 0.422 | 4.856 | <.001 | 0.007 | 0.017 | |||
| Model 2 | (Intercept) | 1138.461 | 6.973 | <.001 | 813.993 | 1462.930 | 0.382 | ||
| Total Fat mass | 0.009 | 0.336 | 2.985 | 0.004 | 0.003 | 0.015 | |||
| Total Muscle mass | 0.011 | 0.373 | 4.207 | <.001 | 0.006 | 0.016 | |||
| Age | -4.415 | -0.240 | -2.883 | 0.005 | -7.459 | -1.371 | |||
| BMI | 1.862 | 0.032 | 0.273 | 0.785 | -11.674 | 15.398 | |||
Peer Reviews
No public reviews on file for this paper yet. If you reviewed it on a platform where reviews are public (OpenReview, ICLR, NeurIPS, ICML), you can paste yours below so the community can read it here.
Videos
No videos yet. Explain this paper in a talk, walkthrough, or lecture? Add one.
Taxonomy
TopicsBone health and osteoporosis research · Vitamin D Research Studies · Nutrition and Health in Aging
Introduction
Osteoporosis is a systemic metabolic bone disease characterized by reduced bone mineral content and microarchitectural deterioration, leading to increased bone fragility and fracture risk. Fragility fractures are among its most serious complications. Clinical guidelines commonly recommend osteoporosis screening in postmenopausal women and men aged 50 years and older (1). Bone mineral density (BMD) peaks in early adulthood and declines with age, with postmenopausal women experiencing accelerated bone loss (2). In China, osteoporosis affects 6.9% of men and 32.1% of women over 50, and the burden of fragility fractures ranks second highest worldwide (3). Dual-energy X-ray absorptiometry (DXA) remains the gold standard for diagnosing osteoporosis (3), and is increasingly used to evaluate body composition, including muscle and fat mass, in conditions such as sarcopenia and obesity (4, 5).
An intimate functional and metabolic relationship exists between muscle and bone. Mechanical loading from muscle contractions stimulates bone formation through mechanosensitive pathways involving osteocyte signaling (6–8). Muscle mass is a strong predictor of bone mineral content (BMC) (2), and muscle-derived factors such as irisin and insulin-like growth factor-1(IGF-1) promote bone formation, while myostatin inhibits it (9, 10). In addition, muscle-secreted cytokines and extracellular vesicles carrying microRNAs can directly influence bone remodeling (11, 12). Conversely, bone-derived osteocalcin modulates muscle metabolism, highlighting a bidirectional crosstalk (2). These interactions underscore the importance of muscle maintenance in osteoporosis prevention.
Although areal bone mineral density (aBMD) is the standard clinical parameter for diagnosing osteoporosis and assessing fracture risk (1, 3), it may not be the most appropriate measure for investigating the relationship between body composition and bone. aBMD is mathematically derived by dividing bone mineral content (BMC) by bone area, rendering it inherently influenced by skeletal size (13, 14). Given that body size correlates strongly with both muscle and fat mass, using aBMD as the outcome could introduce a degree of circularity when evaluating muscle–bone or fat–bone associations. In contrast, BMC represents the absolute mineral content of the skeleton and is less confounded by bone dimensions, thereby providing a more direct reflection of the total mineralized response to mechanical and metabolic stimuli (2, 6). Therefore, to better delineate the independent contributions of muscle and fat mass to skeletal mineral status, this study employed total BMC as the primary outcome measure.
In contrast, the role of fat mass in bone metabolism remains controversial. While some studies suggest a protective mechanical effect of adipose tissue on bone density (15–17), others report that excess fat-particularly visceral fat-promotes inflammation and secretion of adipokines such as leptin and tumor necrosis factor-α(TNF-α), which may suppress bone formation and enhance resorption (18). Most prior studies have assessed muscle or fat in isolation, limiting the ability to discern their independent effects on bone.
To address this gap, we analyzed body composition data from 628 clinical subjects to evaluate the independent contributions of total muscle mass and total fat mass to BMC within a unified statistical model. Furthermore, we stratified analyses by sex and bone density status to clarify population-specific effects. This approach provides a more integrated perspective on muscle-fat-bone interactions and supports the development of tailored strategies for osteoporosis prevention and management.
Materials and methods
Study population and design
This retrospective study screened individuals who underwent DXA body composition examination at the Department of Nuclear Medicine, Affiliated Hospital of Nanjing University of Chinese Medicine, between January 2022 and July 2024.The detailed procedures of this study are described in the Flowchart (Figure 1). The participants were primarily outpatients and inpatients who voluntarily underwent DXA examination for health assessment or clinical indication.
Flowchart of the study.
Inclusion criteria were: (1) Availability of a complete DXA report; (2) Age ≥ 18 years.
Exclusion criteria included: (1) Incomplete DXA data(*n=*6,321 excluded); (2) Conditions affecting DXA accuracy, such as metal implants, severe spinal deformities, or joint replacements (*n=*1, 582 excluded); (3) Diseases severely influencing bone or body composition metabolism (e.g., hyperthyroidism, hyperparathyroidism, Cushing’s syndrome, malignant tumors, or severe hepatic/renal dysfunction)(*n=*7,125 excluded); (4) Long-term use of medications with significant impacts on bone or body composition (e.g., glucocorticoids, anti-osteoporosis drugs, or hormone replacement therapy) (n = 514 excluded).
A total of 16,170 individuals were initially identified. After applying the eligibility criteria, 628 subjects were included in the final analysis. The study was approved by the Ethics Committee of the Affiliated Hospital of Nanjing University of Chinese Medicine (No. 2024NL-085-02, May 9, 2024) and registered with the Chinese Clinical Trial Registry (ChiCTR2400085209||http://www.chictr.org.cn/, June 3, 2024).
Data collection and measurements
Demographic and body composition data were retrieved from the Clinical Information System of the Department of Nuclear Medicine. Collected variables included age, height, body weight, body mass index (BMI), total BMC, total muscle mass (representing DXA-derived lean soft tissue mass), total fat mass, and whole-body BMD T-score. BMI was calculated as weight in kilograms divided by the square of height in meters (kg/m²). All measurements were performed using a Hologic Discovery DXA bone densitometer (Model ASY-03954). It should be noted that the “total muscle mass” measured by DXA technically represents lean soft tissue mass, which includes water, connective tissue, and organ mass in addition to skeletal muscle. Similarly, “total fat mass” represents whole-body adipose tissue without distinguishing between subcutaneous and visceral depots. All measurements reported herein are whole-body values. In this analysis, BMC was selected as the primary outcome because it reflects the total amount of mineral in the skeleton and is less influenced by bone size compared to a real BMD, thereby providing a more direct measure of bone mass in relation to body composition. This choice also minimizes the risk of partial circularity when interpreting associations with muscle mass, as aBMD is mathematically derived using bone area which correlates with body size. Given that sex and age are established determinants of BMC, and skeletal health status represents a complete spectrum from normality to disease, this study conducted subgroup analyses to comprehensively evaluate the characteristics of the associations between muscle mass, fat mass, and BMC across different populations and health states.
Statistical analysis
Data were analyzed using SPSS Statistics (Version 29.0). Normally distributed continuous variables are presented as mean ± standard deviation, and non-normally distributed variables as median and interquartile range. Group comparisons were conducted using ANOVA for normally distributed data(after confirmation by Shapiro-Wilk test), and the Mann-Whitney U or Kruskal-Wallis test for non-normal data. Correlations between variables were assessed using Spearman’s rank correlation analysis, and correlation heatmaps were generated with GraphPad Prism (Version 10). To assess the robustness of the primary associations and to perform a sensitivity analysis, two multiple linear regression models were constructed. Model 1 included only total muscle mass and total fat mass to examine their unadjusted associations with total BMC. Model 2 further adjusted for age and BMI as covariates. The stability of the regression coefficients for muscle mass and fat mass across the two models was evaluated to determine the sensitivity of these core associations to model specification. Multicollinearity was assessed using variance inflation factor (VIF), with values <5 considered acceptable (all VIFs in the final models were <4.5). A two-sided P-value <0.05 was considered statistically significant.
Results
Basic characteristics and group comparisons of the included population
A total of 628 participants were enrolled in this study. The collected data were stratified by sex, age, and total body BMD T-score for comparative analysis. Sex-based comparison revealed that males had significantly greater height, weight, BMI, total BMC, total muscle mass, and T-score than females (P < 0.001). Conversely, total fat mass was significantly higher in females (P < 0.001). No significant difference in age was observed between the two groups (P = 0.953) (Table 1).
Age-stratified comparison showed significant differences among the three age groups (<60 years, 60–70 years, >70 years) in age, height, total BMC, and T-score (P < 0.001). Post-hoc analysis indicated a declining trend in height, total BMC, and T-score with advancing age. Both the 60–70 years and >70 years groups showed significantly lower values compared to the <60 years group. In contrast, no significant differences were found among the groups in weight, BMI, total fat mass, or total muscle mass (P>0.05) (Table 2).
Comparison based on whole-body BMD T-score demonstrated that, compared to the normal bone mass group, both the osteopenia and osteoporosis groups were characterized by significantly increased age and decreased height, total BMC, total muscle mass, and T-score. Furthermore, compared to the osteopenia group, the osteoporosis group exhibited significantly greater age and lower height, weight, BMI, total BMC, total muscle mass, and T-score (Table 3).
Correlation analysis
Spearman correlation analysis was conducted to evaluate the relationships between total BMC and variables including age, height, weight, BMI, total muscle mass, and total fat mass. In the overall sample (*n=*628, Figure 2a), Total BMC showed a significant negative correlation with age (r=-0.326, P < 0.001) and significant positive correlations with height, weight, BMI, total muscle mass, and total fat mass(all P < 0.001). The strongest positive correlation was observed with total muscle mass (*r=*0.620), which was substantially higher than that with total fat mass (*r=*0.154).
(a) Correlation for Total Sample (n=628). (b) Correlation for Females (n=498). (c) Correlation for Males (n=130). (d) Correlation for <60 years (n=271). (e) Correlation for 60–70 years (n=229). (f) Correlation for >70 years (n=128). (g) Correlation for Normal Bone Mass (n=372). (h) Correlation for Osteopenia (n=163). (i) Correlation for Osteoporosis (n=93).
After stratification by sex, the correlation pattern in females (*n=*498, Figure 2b) remained consistent with the total sample, though the inverse correlation between total BMC and age was more pronounced (r=-0.456, P < 0.001). In males (*n=*130, Figure 2c), total BMC was not significantly correlated with age or BMI (P>0.05) but showed positive correlations with height, weight, total muscle mass, and total fat mass (all P < 0.01). The correlation with total muscle mass in males (*r=*0.356) was weaker than that in females and the overall sample.
Age-stratified analysis demonstrated evolving correlation patterns. In the <60 years group (*n=*271, Figure 2d), total BMC was negatively correlated with age (r=-0.320, P < 0.001) and strongly positively correlated with height (*r=*0.661) and total muscle mass (*r=*0.607) (both P < 0.001). The correlation with total fat mass was weak but significant (*r=*0.161, P = 0.008). In the 60–70 years group (*n=*229, Figure 2e), the correlation between total BMC and age was no longer significant (r=-0.063, P = 0.343). Strong positive correlations persisted with height (*r=*0.574) and total muscle mass (*r=*0.642) (both P < 0.001), while the association with total fat mass was marginal (*r=*0.141, P = 0.033). In the >70 years group (*n=*128, Figure 2f), total BMC was not significantly associated with age (r=-0.098, P = 0.273) but remained strongly positively correlated with height (*r=*0.629) and total muscle mass (*r=*0.701) (both P < 0.001). The correlation with total fat mass was not significant (*r=*0.167, P = 0.059).
When stratified by whole-body BMD T-score, total BMC in the normal bone mass group (*n=*372, Figure 2g) showed no significant correlation with age but a strong positive correlation with total muscle mass (*r=*0.690, P < 0.001). In both the osteopenia (*n=*163, Figure 2h) and osteoporosis (*n=*93, Figure 2i) groups, total BMC was negatively correlated with age (r=-0.180, P = 0.022; r=-0.260, P = 0.012, respectively) and remained strongly correlated with total muscle mass. Notably, the correlation between total BMC and total fat mass was highest in the osteoporosis group (*r=*0.378).
Multiple linear regression analysis
Multiple linear regression analysis of the total sample data
Analysis of the total sample (*n=*628, Table 4) indicated that both muscle mass and fat mass were significant predictors of total BMC. In Model 1, total muscle mass (*β=*0.652, P < 0.001) was a strong positive predictor, with each 1-gram increase associated with an average increase of 0.044 g in total BMC. Total fat mass (*β=*0.061, P = 0.045) also reached statistical significance, although its effect was modest. This model explained 43.8% of the variance in total BMC (adjusted R²=0.438).
After incorporating age and BMI into Model 2, the model’s explanatory power increased to 50.0% (adjusted R²=0.500). The positive predictive effects of total muscle mass (*β=*0.687, P < 0.001) and total fat mass (*β=*0.165, P < 0.001) remained significant and were notably enhanced. In contrast, age (β=-0.218, P < 0.001) and BMI (β=-0.169, P = 0.001) emerged as significant negative predictors. This indicates that each one-year increase in age was associated with an average reduction of 9.340 g in total BMC, and each one-unit increase in BMI was associated with an average reduction of 23.776 g. No multicollinearity issues were detected in either model. The sensitivity analysis confirmed the robustness of these core associations. The positive relationship between muscle mass and BMC remained strong and stable (β increased from 0.652 to 0.687), while the association for fat mass was not only sustained but strengthened after covariate adjustment (β increased from 0.061 to 0.165), as evidenced by the comparison between Model 1 and Model 2.
Sex-stratified multiple linear regression analysis
Sex-stratified multiple linear regression analysis revealed distinct patterns between sexes. In the female sample (*n=*498, Table 4), both total muscle mass (*β=*0.347) and total fat mass (*β=*0.227) in Model 1 exerted significant positive effects on total BMC (P < 0.001). Specifically, each 1-gram increase in muscle mass and fat mass was associated with an average increase of 0.024 g and 0.013 g in total BMC, respectively. The model explained 23.0% of the variance in total BMC. After adding age and BMI in Model 2, the explanatory power increased to 40.0%. The effects of total muscle mass (*β=*0.356) and total fat mass (*β=*0.308) remained highly significant (P < 0.001). Age (β=-0.395, P < 0.001) and BMI (β=-0.133, P = 0.041) were also significant negative predictors. For females, each one-year increase in age was associated with an average reduction of 12.730 g in total BMC, and each one-unit increase in BMI was associated with an average reduction of 13.091 g. In contrast, the male sample (*n=*130, Table 4) showed different results. In Model 1, although both total muscle mass (*β=*0.259, P = 0.003) and total fat mass (*β=*0.219, P = 0.010) were significant predictors, the overall explanatory power of the model was weak (adjusted R²=0.126). The inclusion of age and BMI in Model 2 did not substantially improve the model fit (adjusted R²=0.131). Notably, neither age nor BMI showed a statistically significant effect on total BMC in males (P>0.05). Furthermore, the standardized coefficient for total fat mass (*β=*0.383) exceeded that for total muscle mass (*β=*0.315). However, due to the small sample size and low explanatory power of the models in males, these findings should be interpreted with caution.
Age-stratified multiple linear regression analysis
The age-stratified multiple linear regression analysis yielded the following results. In the <60 years group (*n=*271, Table 5), total muscle mass was the sole significant positive predictor of total BMC (Model 1, *β=*0.589; Model 2, *β=*0.604; both P < 0.001). After adding age in Model 2, it showed a significant negative effect (β=-0.214, P < 0.001), with each one-year increase in age associated with an average reduction of 11.716 g in total BMC. The effects of total fat mass and BMI were not significant (Table 5). In the 60–70 years group (*n=*229, Table 5), total muscle mass exhibited the strongest predictive effect (Model 1, *β=*0.719; Model 2, *β=*0.763; both P < 0.001). Within this age range, total fat mass, age, and BMI showed no significant influence on total BMC (Table 5). In the >70 years group (*n=*128, Table 5), total muscle mass maintained a very strong positive predictive role (Model 1, *β=*0.736; Model 2, *β=*0.792). Notably, after adjusting for age and BMI in Model 2, total fat mass emerged as a significant positive predictor (*β=*0.190, P = 0.025), while BMI became a significant negative predictor (β=-0.197, P = 0.030). The effect of age was not significant (Table 5).
Multiple linear regression analysis after stratification by whole-body BMD T-Score
Multiple linear regression analysis based on total body BMD T-score yielded the following group-specific results. In the normal bone mass group (*n=*372, Table 6), total muscle mass was the only significant positive predictor in Model 1. After BMI was included in Model 2, it emerged as a significant negative predictor (β=-0.245, P = 0.001), while the effect of total fat mass also became significantly positive (*β=*0.240, P < 0.001). The influence of age was of borderline significance (P = 0.056) (Table 6). In the osteopenia group (*n=*163, Table 6), total muscle mass showed a stable and strong predictive effect. In Model 2, which included age and BMI, total fat mass (*β=*0.432), age (β=-0.142), and BMI (β=-0.478) all became highly significant predictors (all P < 0.01). The model demonstrated high explanatory power, accounting for 66.0% of the variance in total BMC (Table 6). In the osteoporosis group (*n=*93, Table 6), both total muscle mass and total fat mass were significant positive predictors in both Model 1 and Model 2. In Model 2, age was a significant negative predictor (β=-0.240, P = 0.005), whereas the effect of BMI was not significant (Table 6).
Discussion
Based on DXA data from 628 clinical subjects, this study assessed the independent effects of total body muscle mass and fat mass on BMC within a single model, and conducted stratified analyses across different sexes, ages, and bone density statuses. The results indicate a stable and significant positive association between total body muscle mass and BMC, whereas fat mass demonstrated a complex, condition-dependent relationship—showing a certain positive correlation in females, individuals over 70 years old, and the osteoporosis group, but with a weaker or non-significant effect in the total sample and certain subgroups. Furthermore, age was a consistent negative influencing factor for total BMC, with the effect being particularly significant in females, those under 60 years old, and the osteoporosis population; meanwhile, BMI was independently associated with decreased BMC in the overall sample, females, individuals over 70 years old, and in groups with normal or osteopenic bone mass. It is important to note that the “total muscle mass” derived from DXA in this study technically represents lean soft tissue mass, which includes water, connective tissue, and organ mass in addition to contractile skeletal muscle. This methodological constraint should be considered when interpreting the observed associations.
Consistent with previous studies (19, 20), muscle mass was strongly and consistently associated with bone strength. In the total sample and all stratified analyses (by sex, age, and bone density groups) of this study, muscle mass showed a highly significant positive correlation with BMC (all P < 0.001), with both the correlation coefficient (r) and regression coefficient (β) being significantly higher than those for fat mass. More importantly, the independent positive association of muscle mass with BMC remained highly significant in both the basic model and extended models adjusted for covariates such as age and BMI. The variability of its standardized regression coefficient (β) was much smaller than that of fat mass, demonstrating a more robust and consistent association of muscle mass with bone. These findings are highly consistent with the theory of muscle-bone coupling, in which muscle contraction stimulates bone through mechanical loading, activating mechanosensing pathways (such as PIEZO ion channels) in bone cells to promote bone formation. Furthermore, various myokines secreted by muscle (such as irisin) and extracellular vesicle-carried miRNAs (e.g., miR-27a-3p) can directly regulate osteogenic differentiation and bone remodeling processes (6, 21). In the population over 70 years old in this study, the association of muscle mass with BMC was the strongest (Model 2 *β=*0.792), suggesting that the association between muscle maintenance and skeletal health may become increasingly prominent with aging. Even in the osteoporosis group, muscle mass remained positively correlated with BMC (*β=*0.373-0.422). Collectively, these observations underscore the importance of muscle mass in bone health and suggest that interventions aimed at maintaining or increasing muscle mass warrant further investigation as a potential strategy for osteoporosis prevention and management.
The role of adipose tissue in skeletal health remains controversial. Ectopic lipid deposition can induce lipotoxicity, promoting osteoclast differentiation from bone marrow progenitors while inhibiting the osteogenic potential of mesenchymal stem cells (MSCs) (22). Concurrently, visceral fat accumulation is often associated with a chronic low-grade inflammatory state (e.g., elevated TNF-α and IL-6), which accelerates bone resorption by enhancing osteoclast activity and suppressing osteoblast function (23). Furthermore, adipokines such as leptin and adiponectin modulate bone metabolism through complex central and peripheral pathways (24–26). As a common indicator of overall obesity (27), BMI demonstrated an independent negative association with BMC in this study. This negative association was observed in the total sample and most subgroups, being particularly pronounced in females, individuals over 70 years of age, and those with osteopenia. This suggests that the metabolic disturbances linked to overall obesity may adversely impact bone health.
Our findings provide a more nuanced perspective on the “obesity paradox”. Although fat mass was correlated with BMC in the total sample and most subgroups, the strength of this association was substantially weaker than that of muscle mass and exhibited clear population heterogeneity. The relationship between fat and bone appears highly dependent on sex, hormonal milieu, and bone metabolic status (28–30). In our study, the association was stronger in females, which may be partly attributed to the role of adipose tissue as a primary source of aromatase for estrogen synthesis. Estrogen promotes osteoblast differentiation and maturation while inhibiting osteoclastogenesis and inducing osteoclast apoptosis (31, 32). Conversely, in adults over 70 years of age and in those with osteoporosis, fat mass emerged as a significant independent positive correlate of BMC. This indicates that during aging or severe bone loss, the metabolic support role of fat and its potential “protective effect” as a mechanical load may become relatively more prominent. Therefore, the net impact of fat on the skeleton represents a complex balance. It is not uniformly beneficial or detrimental but likely depends on the interplay between fat distribution, overall adiposity (BMI), concomitant metabolic and inflammatory status, and individual physiological context. In clinical practice, when assessing body composition in relation to skeletal health, it is essential to move beyond a simplistic focus on total fat mass and instead comprehensively consider the metabolic quality of obesity and the individual’s overall condition.
Age exhibited a significant sex-specific influence on BMC in this study, reflecting the distinct roles of sex hormones in skeletal aging. Among females, age was a strong and independent negative predictor of BMC (β =-0.395, P < 0.001), which aligns with accelerated bone turnover and increased bone resorption driven by the sharp decline in estrogen levels after menopause (33). This also explains why women are not only at higher risk for osteoporosis but also experience a much faster rate of bone loss compared to men. In contrast, age was not a significant independent predictor of BMC in males (β =-0.024, P = 0.783). This finding is consistent with previous studies indicating that age-related bone loss in men typically begins later, progresses more slowly, and follows a more linear decline (34, 35). This is largely attributed to the absence of a sudden hormonal event analogous to menopause in women; instead, the decline in male sex hormone levels with age is a relatively gradual process (36, 37), which may explain why its association with BMC appears less pronounced in cross-sectional studies. In summary, our data reinforce the central role of estrogen in bone homeostasis and highlight the necessity of tailoring osteoporosis prevention and management strategies to sex-specific aging patterns.
Stratified analysis by bone density status further elucidated the dynamic relationships of muscle and fat with skeletal health. In the normal and osteopenic stages, the regression models showed strong explanatory power (adjusted R²=0.484 and 0.660, respectively). Here, total muscle mass was the strongest and most stable factor positively associated with BMC, whereas the independent association of fat mass was weak or non-significant. This suggests that inadequate mechanical stimulation may be a key driver of bone loss in early disease stages. Consequently, interventions during this phase might focus on enhancing muscle mass and strength—for example, through resistance training—to decelerate mineral loss and improve bone strength (38–40). In the osteoporosis stage, although muscle mass remained a primary correlate of BMC, fat mass also emerged as an independent, significant positive factor, with both contributing jointly to BMC. Notably, the model’s explanatory power declined in this group (adjusted R²=0.382). This shift implies that in established osteoporosis, the dominant link between muscle and bone may attenuate, while adipose tissue might play a relatively greater role, potentially helping to mitigate bone loss through metabolic or endocrine mechanisms. These observations offer a refined perspective for osteoporosis management.
This study highlights the distinct contributions of muscle and fat to skeletal health. Our cross-sectional data reveal a robust, positive association between muscle mass and BMC, reinforcing muscle’s role as a key correlate in bone’s mechanical and metabolic milieu. In contrast, the relationship between fat mass and BMC was highly context-dependent. The positive associations observed in women, older adults, and individuals with osteoporosis suggest that adipose tissue may exert its influence may be related to local hormonal activity (e.g., estrogen synthesis) or energy substrate provision, rather than through a universally protective effect. Thus, in designing strategies to preserve skeletal health, priority should be given to maintaining or increasing muscle mass, whereas the role of fat requires an individualized assessment that moves beyond a simple binary of “beneficial” or “harmful.”
Limitations
This study has several limitations. First, the cross-sectional design precludes causal inferences regarding the observed associations. Second, the single-center, retrospective design and the pronounced sex imbalance (130 males vs. 498 females) may limit the generalizability of the findings. It is important to note that this sex distribution reflects the real-world epidemiology of osteoporosis in the Chinese population (3), where nationwide data show a significantly higher prevalence in women (32.1% in women over 50 vs. 6.9% in men) leading to a greater proportion of women undergoing DXA screening in clinical practice. Consequently, this imbalance substantially reduces the statistical power for sex-specific analyses, particularly in the male subgroup where the regression models showed low explanatory power (adjusted R²=0.131). Therefore, findings related to sex differences, especially those concerning the role of fat mass in men, should be interpreted with caution and require validation in larger, more balanced cohorts. Third, although statistically significant, the regression models—especially for males (adjusted R²=0.131)-had limited explanatory power, indicating that important confounding or contributing factors (e.g., physical activity, dietary calcium and vitamin D, sex hormone levels, inflammatory markers, and genetic background) were not measured. These unmeasured variables may have influenced the observed associations and could partially explain the limited explanatory power of some subgroup models. Fourth, methodological constraints should be noted: the “total muscle mass” derived from DXA represents lean soft tissue rather than specific skeletal muscle mass or function, and the analysis could not differentiate between adipose tissue depots (e.g., subcutaneous vs. visceral fat), which may have distinct effects on bone metabolism.
Based on these limitations, future studies should: (1) employ longitudinal or interventional designs to establish causality; (2) recruit larger, multi-center cohorts with balanced sex representation to enhance generalizability and statistical power; and (3) integrate detailed measures of lifestyle (diet, exercise), systemic biomarkers (hormones, inflammatory markers), body composition specificity (muscle quality, fat distribution), and omics data to fully elucidate the mechanisms underlying muscle–fat–bone interactions.
Conclusion
In summary, analyses of DXA body composition data from 628 individuals demonstrate that muscle mass is the strongest and most consistent correlate of BMC, supporting a strong associative relationship between muscle and bone. In contrast, the association of fat mass with BMC is highly context-dependent, appearing most evident in women and patients with osteoporosis, although the sex-specific findings in males require further investigation due to the smaller sample size. Age shows an independent inverse association with BMC in women, underscoring the complexity of postmenopausal bone health. Based on current associative evidence, maintaining muscle mass may be an important consideration in strategies for osteoporosis prevention, while supporting a personalized approach to assessing the role of fat based on individual metabolic and hormonal profiles.
The reference list from the paper itself. Each links out to its DOI / PubMed record.
- 1Morin SN Leslie WD Schousboe JT . Osteoporosis: A review. JAMA. (2025) 334:894–907. doi: 10.1001/jama.2025.6003(2025, PMID: 40587168 · doi ↗ · pubmed ↗
- 2Kirk B Lombardi G Duque G . Bone and muscle crosstalk in ageing and disease. Nat Rev Endocrinol. (2025) 21:375–90. doi: 10.1038/s 41574-025-01088-x(2025, PMID: 40011751 · doi ↗ · pubmed ↗
- 3Chinese Society of Osteoporosis and Bone Mineral Research, Chinese Medical Association . Primary osteoporosis guideline for diagnosis and treatment (2022). Chin J Osteoporos Bone Miner Res. (2022) 5:573–611. doi: 10.3969/j.issn.1674-2591.2022.06.001(2022, PMID: 34269225 · doi ↗
- 4Marra M Sammarco R De Lorenzo A Iellamo F Siervo M Pietrobelli A . Assessment of body composition in health and disease using bioelectrical impedance analysis (BIA) and dual energy X-ray absorptiometry (DXA): A critical overview. Contrast Media Mol Img. (2019) 2019:3548284. doi: 10.1155/2019/3548284(2019, PMID: 31275083 PMC 6560329 · doi ↗ · pubmed ↗
- 5Guglielmi G Ponti F Agostini M Amadori M Battista G Bazzocchi A . The role of DXA in sarcopenia. Aging Clin Exp Res. (2016) 28:1047–60. doi: 10.1007/s 40520-016-0589-3(2016, PMID: 27256078 · doi ↗ · pubmed ↗
- 6Malvandi AM Gerosa L Banfi G Lombardi G . The bone-muscle unit: from mechanical coupling to soluble factors-mediated signaling. Mol Aspects Med. (2025) 103:101367. doi: 10.1016/j.mam.2025.101367(2025, PMID: 40339487 · doi ↗ · pubmed ↗
- 7Xiao B . Mechanisms of mechanotransduction and physiological roles of PIEZO channels. Nat Rev Mol Cell Biol. (2024) 25:886–903. doi: 10.1038/s 41580-024-00773-5(2024, PMID: 39251883 · doi ↗ · pubmed ↗
- 8Liu Y Gong H Wang X Yang Q Liu S Zhu D . Mechanosensors in osteocytes. Journalof Medical Biomechanics. (2024) 39:207–13. doi: 10.16156/j.1004-7220.2024.02.003(2024, PMID: 41795857 · doi ↗