Comprehensive machine learning analysis of a radiomics-based model for predicting microsatellite instability in right Colon Cancer
Junchuan Li, Li Liu, Xiaoqiong Zhong, Runxin Yang, Wenfeng Wang, Lian Yin, Dong Li, Hua Liu

TL;DR
This study develops a machine learning model using radiomics and clinical data to predict microsatellite instability in right colon cancer, offering a noninvasive preoperative tool for clinical decisions.
Contribution
The novel contribution is a radiomics-based machine learning model integrated with clinicopathological features for predicting dMMR/MSI-H status in right colon cancer.
Findings
The random forest-based joint model achieved AUC values of 0.99 (training) and 0.97 (test) for predicting dMMR status.
The model showed good generalizability with an AUC of 0.81 in external validation using left colon cancer data.
The joint model outperformed radiomics-only and clinical-only models in predictive performance.
Abstract
The objective of this study was to develop and validate a noninvasive radiomics-based machine learning (ML) model integrated with clinicopathological features for the prediction of microsatellite instability [deficient mismatch repair (dMMR)/microsatellite instability—high (MSI-H)] status in right colon cancer, aiming to provide a preoperative decision-making tool for clinical practice. A total of 247 patients with right colon cancer [43 dMMR and 204 proficient mismatch repair (pMMR)] who underwent radical resection between January 1, 2017, and 31 December 2024, were enrolled and randomly divided into a training set (70%) and a test set (30%). Preoperative contrast-enhanced computed tomography (CT) images were processed using 3D Slicer for region of interest (ROI) delineation and radiomics feature extraction. The intraclass correlation coefficient (ICC) was used to assess interobserver…
Genes, proteins, chemicals, diseases, species, mutations and cell lines named across the full text — each resolved to its canonical identifier and authoritative record.
Click any figure to enlarge with its caption.
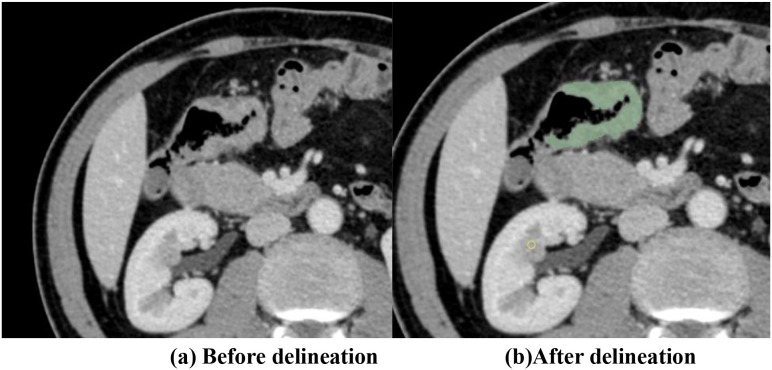 Figure 1
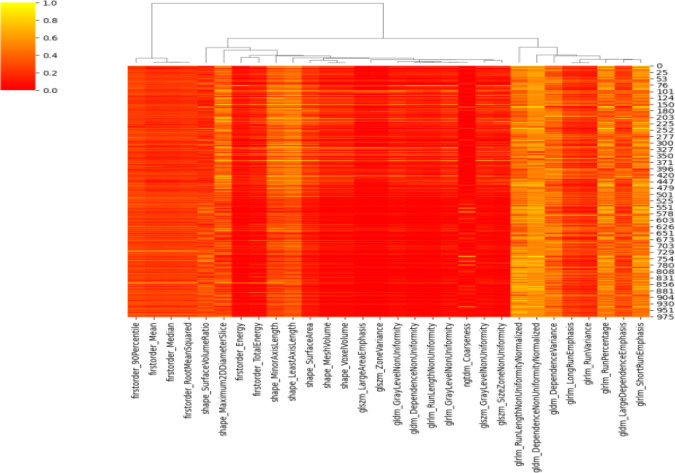 Figure 2
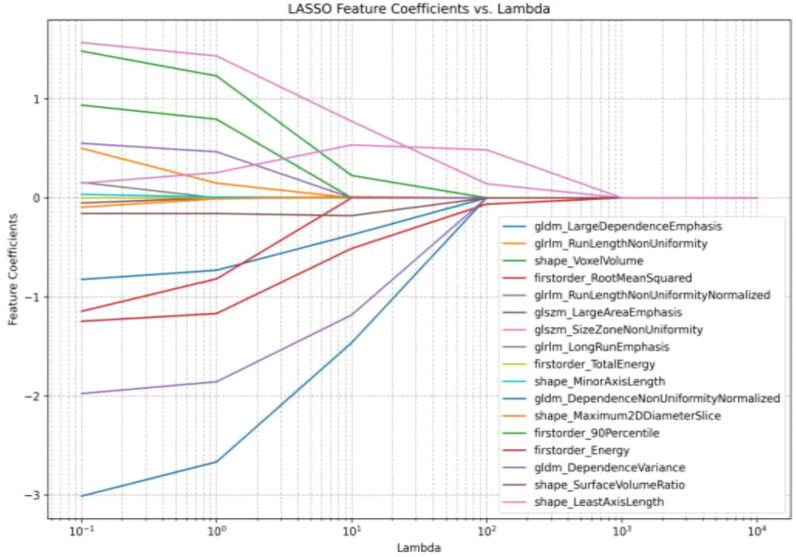 Figure 3
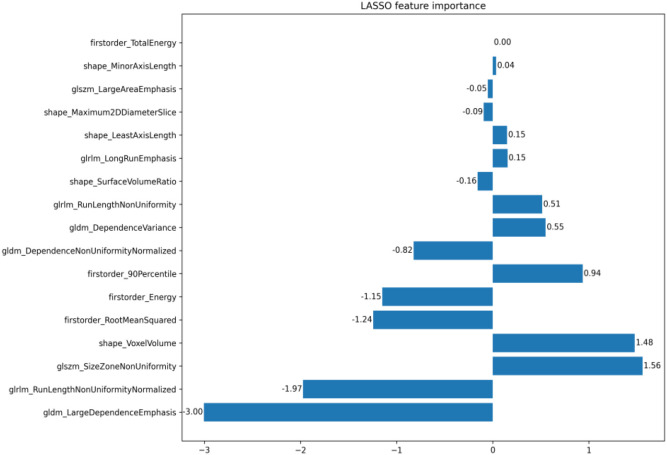 Figure 4
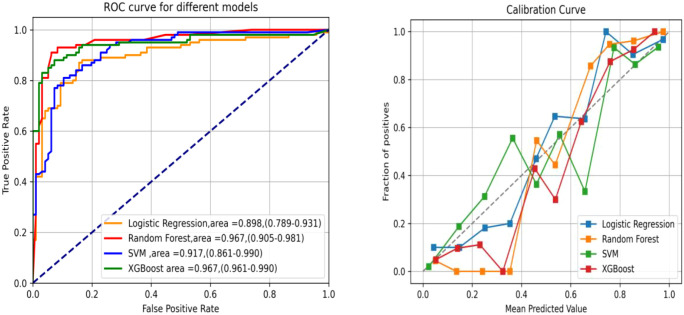 Figure 5
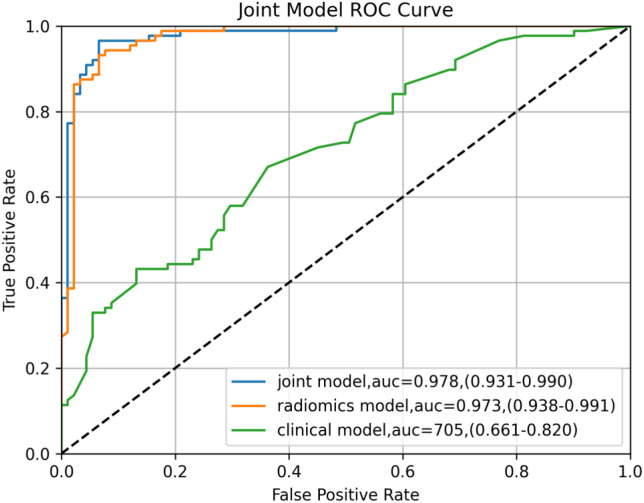 Figure 6
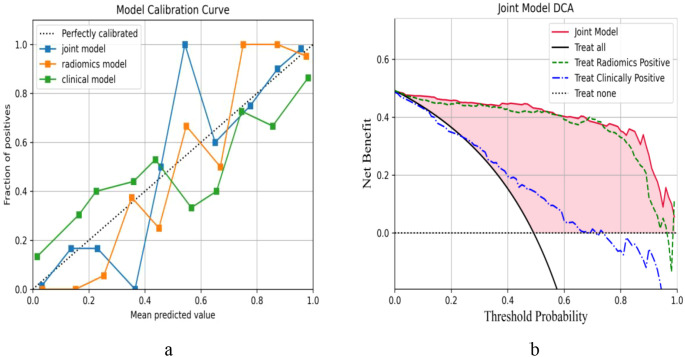 Figure 7
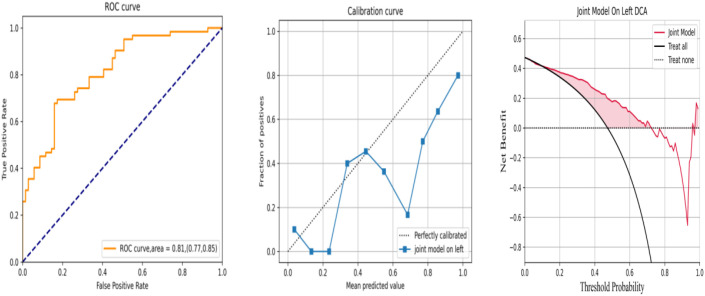 Figure 8
| Characteristics | Training set |
| Test set |
| |||
|---|---|---|---|---|---|---|---|
| dMMR ( | pMMR ( | dMMR ( | pMMR ( | ||||
| Sex | Male patients | 16 | 78 | 0.873 | 6 | 34 | 0.568 |
| Female patients | 14 | 64 | 7 | 28 | |||
| Age | <50 years | 7 | 33 | 0.991 | 3 | 14 | 0.969 |
| ≥50 years | 23 | 109 | 10 | 48 | |||
| BMI | <18.5 | 3 | 14 | 0.881 | 1 | 3 | 0.914 |
| 18.5–24 | 17 | 87 | 8 | 40 | |||
| >24 | 10 | 41 | 4 | 19 | |||
| Location | Ileocecal | 6 | 31 | 0.041 | 1 | 14 | 0.011 |
| Colon ascendens | 14 | 57 | 6 | 25 | |||
| Hepatic flexure | 9 | 52 | 3 | 22 | |||
| Transverse colon | 1 | 2 | 3 | 1 | |||
| Long diameter | <5 cm | 10 | 24 | 0.040 | 4 | 9 | 0.003 |
| ≥5 cm | 20 | 118 | 9 | 53 | |||
| Morphology | Ulcerative type | 18 | 96 | 0.553 | 8 | 44 | 0.672 |
| Bulge type | 12 | 44 | 5 | 17 | |||
| Cauliflower type | 0 | 0 | 0 | 0 | |||
| Infiltrating type | 0 | 2 | 0 | 1 | |||
| Histological type | Without mucus | 16 | 131 | <0.001 | 8 | 57 | 0.003 |
| Mucus or signet ring cell | 14 | 11 | 5 | 5 | |||
| pT | T1 | 1 | 3 | 0.654 | 0 | 1 | 0.972 |
| T2 | 4 | 11 | 1 | 5 | |||
| T3 | 20 | 94 | 9 | 41 | |||
| T4 | 5 | 34 | 3 | 15 | |||
| pN | N0 | 22 | 48 | <0.001 | 10 | 21 | 0.004 |
| N+ | 8 | 94 | 3 | 41 | |||
| pM | M0 | 27 | 135 | 0.281 | 12 | 59 | 0.677 |
| M1 | 3 | 7 | 1 | 3 | |||
| pTNM | I | 3 | 13 | 0.222 | 2 | 6 | 0.448 |
| II | 18 | 67 | 8 | 29 | |||
| III | 6 | 55 | 2 | 24 | |||
| IV | 3 | 7 | 1 | 3 | |||
| Intravascular cancer thrombus | No | 24 | 108 | 0.642 | 10 | 47 | 0.932 |
| Yes | 6 | 34 | 3 | 15 | |||
| Nerve invasion | No | 21 | 88 | 0.407 | 9 | 36 | 0.455 |
| Yes | 9 | 54 | 4 | 26 | |||
| Total | |||||||
| Differentiated | High | 0 | 1 | 0.093 | 0 | 1 | 0.302 |
| High-medium | 1 | 1 | 0 | 3 | |||
| Medium | 14 | 95 | 6 | 40 | |||
| Medium-low | 6 | 28 | 3 | 11 | |||
| Low | 6 | 10 | 3 | 4 | |||
| Total | |||||||
| Method | AUC (95%CI) | Accuracy | Sensitivity | Specificity | |
|---|---|---|---|---|---|
| LR | Training set | 0.91 (0.88–0.99) | 0.94 | 0.85 | 0.86 |
| Test set | 0.89 (0.78–0.93) | 0.83 | 0.80 | 0.91 | |
| RF | Training set | 0.98 (0.89–0.99) | 0.98 | 0.93 | 0.91 |
| Test set | 0.96 (0.91–0.98) | 0.91 | 0.91 | 0.73 | |
| SVM | Training set | 0.94 (0.83–0.98) | 0.95 | 0.88 | 0.87 |
| Test set | 0.91 (0.86–0.99) | 0.84 | 0.82 | 0.93 | |
| XGBoost | Training set | 0.97 (0.90–1.00) | 0.99 | 0.92 | 0.85 |
| Test set | 0.94 (0.96–0.99) | 0.83 | 0.91 | 0.93 |
| Model | AUC (95%CI) | Accuracy | Sensitivity | Specificity | |
|---|---|---|---|---|---|
| Radiomics model | Training set | 0.99 (0.98–0.99) | 0.98 | 0.97 | 0.96 |
| Test set | 0.97 (0.93–0.99) | 0.92 | 0.94 | 0.91 | |
| Clinical model | Training set | 0.81 (0.69–0.86) | 0.80 | 0.60 | 0.80 |
| Test set | 0.70 (0.66–0.82) | 0.61 | 0.51 | 0.73 | |
| Joint model | Training set | 0.99 (0.98–1.00) | 0.99 | 0.98 | 0.97 |
| Test set | 0.97 (0.93–0.99) | 0.93 | 0.94 | 0.93 |
| Characteristics | Training set (right colon) | Validation set (left colon) |
| |
|---|---|---|---|---|
| Sex | Male patients | 16 (52%) | 7 (50%) | 0.837 |
| Female patients | 14 (48%) | 7 (50%) | ||
| Age | <50 years | 7 (24%) | 3 (21%) | 0.888 |
| ≥50 years | 23 (76%) | 11 (79%) | ||
| BMI | <18.5 | 3 (10%) | 1 (8%) | 0.643 |
| 18.5–24 | 17 (58%) | 10 (71%) | ||
| >24 | 10 (32%) | 3 (21%) | ||
| Location | Ileocecal | 6 (21%) | Descending colon 2 (14%) | 0.918 |
| Colon ascendens | 14 (48%) | Rectum 7 (50%) | ||
| Hepatic flexure | 9 (29%) | Sigmoid colon 4 (29%) | ||
| Transverse colon | 1 (2%) | Splenic flexure 1 (7%) | ||
| Long diameter | <5 cm | 10 (32%) | 5 (36%) | 0.877 |
| ≥5 cm | 20 (68%) | 9 (64%) | ||
| Morphology | Ulcerative type | 18 (61%) | 10 (71%) | 0.463 |
| Bulge type | 12 (39%) | 4 (29%) | ||
| Cauliflower type | 0 (0%) | 0 (0%) | ||
| Infiltrating type | 0 (0%) | 0 (0%) | ||
| Histological type | Without mucus | 16 (53%) | 7 (50%) | 0.837 |
| Mucus or signet ring cell | 14 (47%) | 7 (50%) | ||
| pT | T1 | 1 (1%) | 0 (0%) | 0.825 |
| T2 | 4 (12%) | 3 (21%) | ||
| T3 | 20 (69%) | 9 (63%) | ||
| T4 | 5 (18%) | 2 (14%) | ||
| pN | N0 | 22 (75%) | 9 (64%) | 0.540 |
| N+ | 8 (25%) | 5 (36%) | ||
| pM | M0 | 27 (90%) | 13 (93%) | 0.759 |
| M1 | 3 (10%) | 1 (7%) | ||
| pTNM | I | 3 (11%) | 2 (14%) | 0.967 |
| II | 18 (61%) | 8 (59%) | ||
| III | 6 (18%) | 3 (21%) | ||
| IV | 3 (10%) | 1 (7%) | ||
| Intravascular cancer thrombus | No | 24 (81%) | 11 (79%) | 0.913 |
| Yes | 6 (19%) | 3 (21%) | ||
| Nerve invasion | No | 21 (72%) | 9 (64%) | 0.705 |
| Yes | 9 (28%) | 5 (36%) | ||
| Total | ||||
| Differentiated | High | 0 (0%) | 0 (0%) | 0.905 |
| High-medium | 1 (4%) | 1 (9%) | ||
| Medium | 14 (52%) | 6 (55%) | ||
| Medium-low | 6 (22%) | 2 (18%) | ||
| Low | 6 (22%) | 2 (18%) | ||
| Total |
| Left colon | AUC (95%CI) | Accuracy | Sensitivity | Specificity |
|---|---|---|---|---|
| Validation set | 0.81 (0.77–0.85) | 0.70 | 0.85 | 0.57 |
Peer Reviews
No public reviews on file for this paper yet. If you reviewed it on a platform where reviews are public (OpenReview, ICLR, NeurIPS, ICML), you can paste yours below so the community can read it here.
Videos
No videos yet. Explain this paper in a talk, walkthrough, or lecture? Add one.
Taxonomy
TopicsRadiomics and Machine Learning in Medical Imaging · Genetic factors in colorectal cancer · Colorectal Cancer Surgical Treatments
Introduction
1
Traditional imaging modalities for tumor diagnosis rely primarily on physicians’ qualitative assessments of the lesion location, morphological characteristics, density profiles, and infiltration extent. This subjectivity-driven paradigm has long been plagued by interobserver variability, particularly when differentiating early-stage lesions from benign proliferative lesions or when evaluating subtle peritumoral infiltration. Recent advancements in radiomics have transformed this paradigm by enabling the extraction of high-dimensional, quantitative features from standard imaging modalities. Radiomics, a multidisciplinary field that combines medical imaging and artificial intelligence, offers a noninvasive, dynamic, and operator-independent analysis of intratumoral heterogeneity through computational algorithms (1). This approach converts radiographic images into actionable, mineable data, facilitating the development of predictive models that complement traditional diagnostic workflows (2–4). After feature extraction, machine learning (ML) techniques are used to construct predictive models. Common algorithms include support vector machine (SVM), artificial neural network (ANN), Bayesian network (BN), decision tree (DT), k-nearest neighbor (KNN), random forest (RF), extreme gradient boosting (XGBoost), and clustering methods (5–7). These algorithms enable the identification of complex patterns and associations within radiomics datasets, improving diagnostic accuracy and prognostic prediction in oncology. Through big data analytics, radiomics holds significant promise for personalized medicine applications, including treatment prediction, biomarker discovery, and patient stratification. In contemporary oncology research, ML has emerged as a powerful tool for the prediction of lymph node metastasis, treatment response, and prognosis (8–11). On the other hand, molecular immunology and genetic studies have increasingly focused on identifying the risk factors that drive tumorigenesis and metastatic progression (12–18). Although TNM remains the gold standard for prognosis assessment and treatment planning, tumor heterogeneity is increasingly attributed to the complexity of the tumor microenvironment and diversity of the immune cell components (19). In addition, deep learning (DL) algorithms, a subset of ML, can construct multilayer neural networks to provide more accurate predictive outcomes. Studies have confirmed that DL can effectively detect microsatellite instability [deficient mismatch repair (dMMR)/microsatellite instability—high (MSI-H)] in gastric and endometrial cancer (20, 21). MSI-SEER enables the prediction of MSI in gastric cancer and colorectal cancer (CRC) (22). A DL model based on H&E histological images has outperformed experienced pathologists in the prediction of MSI in CRC (23, 24). In the future, H&E-stained sections using the Deepath-MSI model could potentially obviate the need for routine immunohistochemistry and polymerase chain reaction (PCR) assays for MSI (25).
The present study introduces a novel approach by developing a preoperative radiomics-based predictive model, providing a noninvasive alternative to conventional tissue-based diagnostics. This methodology leverages the intrinsic correlation between imaging features and molecular phenotypes, with the potential to enable the early identification of dMMR tumors. Our objective was to establish a clinical decision support system to identify patients at risk for cancer and facilitate early intervention for these patients.
Data and methods
2
Research objective
2.1
Clinical data were collected from 247 patients with right colon cancer who underwent radical resection surgery at the Department of Gastrointestinal Surgery at Yanjiang District People’s Hospital of Ziyang and Ziyang Central Hospital between 1 January 2017 and 31 December 2024. The cohort included 43 patients with dMMR and 204 with proficient mismatch repair (pMMR). Patients were randomly divided into a training set and a test set at a 7:3 ratio. All procedures were performed in accordance with the Declaration of Helsinki and relevant regulatory guidelines. This retrospective study was approved by the Ethics Committee of Yanjiang District People’s Hospital of Ziyang. Written informed consent was waived due to the retrospective nature of the research.
Inclusion criteria
2.2
The inclusion criteria were as follows: 1) patients with complete sets of clinical, pathological, imaging, and immunohistochemical data; 2) patients with right colon cancer who received radical surgical treatment after CT scans; and 3) the MMR was assessed by postoperative pathology.
Exclusion criteria
2.3
We excluded the following: 1) patients who had undergone neoadjuvant chemotherapy, radiotherapy, or any biological therapy prior to surgical intervention; 2) patients who did not undergo surgical resection or those with unavailable or incomplete postoperative pathological datasets; 3) cases with CT images of suboptimal quality that rendered quantitative analysis unfeasible; and 4) patients whose target lesions were not discernible on preoperative CT imaging, precluding radiomics feature extraction and model construction.
Software selection
2.4
We used 3D Slicer for region of interest (ROI) delineation and texture feature extraction. The slicer-radiomics module within 3D Slicer was used to extract textures from the confirmed ROIs, including first-order statistics, shape-based features, gray-level co-occurrence matrix parameters, gray-level run-length matrix parameters, and neighborhood gray-tone difference matrix parameters from validated ROIs (1, 2).
Sketching of the primary lesion
2.5
Contrast-enhanced CT DICOM datasets acquired 1–2 weeks preoperatively were imported into the 3D Slicer software. Patient-identifying information was removed prior to ROI delineation. Primary tumor ROIs were manually segmented layer-by-layer on axial slices by two radiologists with ≥3 years of abdominal imaging experience based on tumor attenuation characteristics and the anatomical continuity, with reference to multi-phase enhancement patterns (Figure 1) (3). To ensure interobserver consistency, the final segmentation results were independently reviewed and refined by two senior radiologists.
(A) Before delineation. (B) After delineation of the region of interest (ROI).
Repeatability of data
2.6
The texture features were independently extracted from the predefined ROIs on the CT images of 10 consecutive patients by two radiologists, the purpose of which was to assess intraobserver repeatability. The intraclass correlation coefficient (ICC) was calculated to evaluate interobserver consistency in the texture feature measurements. The ICC values were interpreted as follows: 0.81–1.00 (excellent consistency), 0.61–0.80 (good consistency), 0.41–0.60 (moderate consistency), 0.21–0.40 (fair consistency), and 0–0.20 (poor consistency).
Establishing the prediction model
2.7
Four ML models were used: logistic regression (LR), RF, SVM, and XGBoost.
Evaluating the predictive models
2.8
Receiver operating characteristic (ROC) curves were used to evaluate the predictive ability, with the area under the curve (AUC) and calibration curves employed for efficiency. In addition, decision curve analysis (DCA) was also performed to evaluate practicability (4).
Statistical methods
2.9
Categorical variables were analyzed with the chi-square test. Univariate LR was conducted to identify potential risk factors. Variables with a p-value <0.1 in the univariate analysis were included in the subsequent multivariate LR model to determine independent predictive factors. Feature selection, predictive model construction, statistical analyses, and data visualization were conducted using R software (version 4.0.4). Statistical significance was set at p < 0.05.
Results
3
General information
3.1
Consecutively collected patients, including 43 with dMMR and 204 with pMMR, were randomly divided into a training set and a test set at a ratio of 7:3. The training set consisted of 30 dMMR and 142 pMMR patients, while the test set included 13 dMMR and 62 pMMR patients. There were statistical consistencies in sex, age, BMI, location, long diameter, morphology, histological type, pT (pathological primary tumor), pN (pathological regional lymph node), pM (pathological distant metastasis), pTNM (pathological tumor, node, metastasis), intravascular cancer thrombus, nerve invasion, and differentiation (all from postoperative pathological diagnosis) between the training set and the test set (Table 1).
Screening and reducing dimensionality of the texture features
3.2
After extracting patients’ ROIs, a total of six categories encompassing 107 texture features were obtained (2). The ROIs from 10 randomly selected patients were independently evaluated by two physicians for ICC analysis. Subsequently, 77 features with ICC < 0.75 were excluded, yielding 30 stable features. Finally, the remaining 17 texture features and their weight coefficients were obtained using least absolute shrinkage and selection operator (LASSO) regression with 50% cross-validation (Figures 2–4).
The 30 stable texture features.
Least absolute shrinkage and selection operator (LASSO) regression of the 30 texture features.
The 17 texture feature weight coefficients.
Prediction model for dMMR right colon cancer by different ML methods
3.3
Construction of the primary lesion radiomics prediction model
3.3.1
The AUC, accuracy, sensitivity, and specificity of LR, RF, SVM, and XGBoost in the primary lesion prediction model were calculated and compared in the training set and the test set (Table 2). The results revealed RF (AUC = 0.96) to be superior to the other algorithms in predicting dMMR. Calibration curves were drawn by repeated self-sampling 1,000 times, with all curves indicating good probability prediction (Figure 5).
Receiver operating characteristic (ROC) and calibration curves of the primary lesion radiomics using four machine learning (ML) methods.
Construction of a joint clinicopathological–radiomics prediction model
3.3.2
The highest AUC with the RF algorithm was finally selected. For the clinical model, the clinicopathological variables identified as independent predictors via multivariate analysis—including sex, age, tumor long diameter, histological type, pN, pM, pTNM, and differentiation degree—were incorporated. The joint model was established based on the primary lesion after taking out a test set and performing 50% cross-validation on the remaining data. In the radiomics model, the AUC, accuracy, sensitivity, and specificity were 0.99 (95%CI = 0.98–0.99), 0.98, 0.97, and 0.96 in the training set and were 0.97 (95%CI = 0.93–0.99), 092, 0.94, and 0.91 in the test set, respectively. For the clinical models (established based on selected indicators such as sex, age, long diameter, histological type, pN, pM, pTNM, and differentiation), the training set values were 0.81 (95%CI = 0.69–0.86), 0.80, 0.60, and 0.80, while those of the test set were 0.70 (95%CI = 0.66–0.82), 0.61, 0.51, and 0.73, respectively. For the joint models (the 17 texture features in RF and the selected indicators mentioned above), the values were 0.99 (95%CI = 0.98–1.00), 0.99, 0.98, and 0.97 in the training set and were 0.97 (95%CI = 0.93–0.99), 0.93, 0.94, and 0.93 in the test set, respectively (Table 3). Notably, the joint model achieved the highest AUC of 0.978, which was significantly higher than that of the radiomics model and the clinical model alone, indicating that the new joint model would improve the prediction efficiency with RF (Figure 6). The calibration curve showed that the joint model had a better predictive probability, and DCA evaluated the influence of the model on clinical decisions (Figures 7A, B). Throughout the entire threshold probability range, the benefit of the joint model was better than that of the radiomics or the clinical prediction model.
Receiver operating characteristic (ROC) curves of the different models for the right colon under random forest (RF) for predicting deficient mismatch repair (dMMR). .
(A, B) Calibration curve and decision curve analysis (DCA) of the different models for the right colon under random forest (RF) for predicting deficient mismatch repair (dMMR).
To further validate the effect of the joint model, data from the left colon were randomly selected as an external validation set to evaluate the generality and extrapolation ability. No statistically significant differences were observed between the training set and the external validation set (Table 4). As the RF algorithm achieved the best effect in the model, it was performed using the same method, achieving AUC, accuracy, sensitivity, and specificity values of 0.81 (95%CI = 0.77–0.85), 0.70, 0.85, and 0.57, respectively (Table 5). The calibration curve was drawn with repeated self-sampling, indicating satisfactory predictive performance. At the same time, DCA was performed to evaluate the impact of clinical decisions, which showed the joint prediction model to have better benefits throughout the threshold probability range (Figure 8).
Receiver operating characteristic (ROC), calibration curve, and decision curve analysis (DCA) of the joint model in the left colon under random forest (RF) for predicting deficient mismatch repair (dMMR).
Discussion
4
In 2012, Lambin introduced the concept of radiomics, which is defined as the process of extracting large-scale quantitative features from medical images, followed by feature selection and predictive model construction (5–8). Subsequently, Tuan developed and validated a novel CT-based index for pre-radiotherapy assessment of non-small cell lung cancer (9). In recent years, there has been a growing body of research applying radiomics analysis to differentiate benign from malignant colorectal tumors (10, 11). Currently, diagnosis of the dMMR status primarily relies on an invasive biopsy, which poses considerable clinical challenges (e.g., invasiveness, potential complications, and sampling bias). Thus, the development of a noninvasive predictive method for dMMR status holds significant clinical value for guiding treatment decisions. In the present study, we trained and validated an RF-based predictive model as a tool that was expected to be applied for the diagnosis of dMMR in right colon cancer. In addition, we screened the most important clinically relevant variable features from numerous colon cancer-related characteristics. Through these analyses, clinicians can utilize the model established by this algorithm to identify dMMR-positive patients, which is expected to optimize the risk stratification in clinical practice. Model construction involved three key steps: 1) segmentation of the lesion from the CT images, noting that inter-operator subjectivity may compromise the repeatability of the results (12); 2) conversion of image features into numerical data; and 3) application of four ML algorithms. To mitigate delineation variability, interobserver consistency was examined using texture features from 10 randomly selected patients whose lesions were independently outlined by two radiologists. Features with an ICC > 0.75 were retained for subsequent LASSO analysis (13–15). Notably, Liang demonstrated that LASSO-based radiomics could distinguish CRC stages I–II from III–IV with an AUC of 0.792, underscoring its potential for preoperative staging (16).
Radiomics models leveraged ML algorithms to establish optimal feature classification boundaries (17). Currently, there is no consensus on the optimal ML algorithm; however, LR, RF, SVM, and other algorithms have been widely applied in CRC radiomics prediction models, particularly for genotyping, tumor staging, pathological response assessment, and survival analysis (18, 19, 26, 27). Deist compared radiomics models for predicting radiotherapy outcomes and found that the LR and RF models outperformed others (28), whereas conflicting evidence suggests that SVM may yield marginally better results than LR (29–31). In our study, LR, RF, SVM, and XGBoost were employed for radiomics analysis of preoperative primary lesions to maximize diagnostic efficiency. The training set achieved AUC values of 0.91 (LR), 0.986 (RF), 0.944 (SVM), and 0.977 (XGBoost), with corresponding test set AUC values of 0.898, 0.967, 0.917, and 0.945. Notably, the RF algorithm demonstrated superior performance, consistent with its proven utility in predicting histological differentiation in CRC and non-small cell lung cancer (32, 33). However, in the era of big data and precision medicine, single clinical or imaging-based models have increasingly failed to meet individualized needs. Joint models integrating clinical characteristics and radiomics have shown significant optimization, enhancing predictive efficiency (34).
The primary objective of this study was to establish a noninvasive approach for predicting the MMR status using radiomics.
First, we successfully achieved this goal via the RF algorithm and validated the efficacy of this model. Second, we constructed a clinical model incorporating partial postoperative pathological parameters, which also yielded certain predictive performance, but was inferior to the radiomics model. Third, a joint model was developed by combining the RF algorithm with clinical data, and this framework also included postoperative pathological parameters. Currently, the MMR status is predominantly reliant on immunohistochemistry or genetic testing. These tests are typically performed after routine pathological examination, which not only delays the treatment time but also increases the financial burden. In contrast, a radiomics model has already demonstrated favorable predictive efficacy for MMR status; furthermore, the joint model can maximize the predictive performance to the greatest extent. Notably, patients undergoing enhanced recovery after surgery and discharged early may not be guaranteed timely access to the MMR status results.
Previous studies have demonstrated the utility of joint radiomics–clinical models for the prediction of the MMR status. For instance, in a cohort of 119 stage II CRC patients, a joint model achieved an AUC of 0.752 (35), while another study in stage II–III CRC reported moderate predictive performance of a joint model, with AUC values of 0.80 in the training set and 0.79 in the test set (36). Notably, these joint models exhibited superior predictive performance for dMMR in CRC (35–37), which is consistent with our findings that the RF algorithm outperformed previous reports (ACU = 0.978 vs. 0.90) (37). In addition, validation using data of the left colon yielded comparable results, indicating that radiomics-based dMMR prediction is generalizable across the entire colon and is not restricted to right-sided lesions. The clinical utility and the reliability of this comprehensive model were further validated using DCA, reinforcing radiomics as an emerging noninvasive tool to assist in clinical decision-making and patient management.
This study has several limitations that warrant discussion. First, as a single-center retrospective analysis, the generalizability of our model may be limited. Prospective multicenter studies with bigger sample sizes are essential to validate and refine these findings. Second, although immunohistochemistry is a widely used and reliable method for assessing the dMMR status, PCR remains the gold standard for definitive MMR, which may have introduced validation bias. Third, the exclusion of patients with incomplete or inconsistent clinical data inevitably introduced selection bias, potentially affecting the representativeness of this cohort. Fourth, despite the performance of interobserver consistency testing, manual delineation of the ROIs introduced inherent subjectivity. The development and the adoption of artificial intelligence-driven automated ROI segmentation technologies are critical for enhancing research reproducibility (38, 39). Finally, external validation via a prospective multicenter trial is necessary to mitigate the inherent biases of retrospective designs and to establish the model’s clinical applicability across diverse populations.
Conclusion
5
In this study, a joint predictive model was constructed by incorporating the RF algorithm with clinicopathological variables, and its performance in predicting the dMMR status in right colon cancer was systematically evaluated. The RF algorithm, a powerful ensemble learning method known for its ability to handle high-dimensional data, capture complex nonlinear relationships, resist overfitting through bootstrap aggregation, and feature randomness, was adopted as the core ML framework. By incorporating key clinicopathological features—including age, tumor size, histological grade, and lymph node, among others—the joint model harnesses both the superior pattern recognition capability of the RF algorithm and the clinical relevance of pathological indicators. This integration enables the model to synergistically leverage computational analytics and clinical expertise for enhanced predictive performance.
The reference list from the paper itself. Each links out to its DOI / PubMed record.
- 1Fedorov A Beichel R Kalpathy-Cramer J Finet J Fillion-Robin JC Pujol S . 3D Slicer as an image computing platform for the Quantitative Imaging Network. Magn Reson Imaging. (2012) 30:1323–41. doi: 10.1016/j.mri.2012.05.001, PMID: 22770690 PMC 3466397 · doi ↗ · pubmed ↗
- 2van Griethuysen J Fedorov A Parmar C Hosny A Aucoin N Narayan V . Computational radiomics system to decode the radiographic phenotype. Cancer Res. (2017) 77:e 104–7. doi: 10.1158/0008-5472.CAN-17-0339, PMID: 29092951 PMC 5672828 · doi ↗ · pubmed ↗
- 3Zhao W Yang J Ni B Bi D Sun Y Xu M . Toward automatic prediction of EGFR mutation status in pulmonary adenocarcinoma with 3D deep learning. Cancer Med. (2019) 8:3532–43. doi: 10.1002/cam 4.2233, PMID: 31074592 PMC 6601587 · doi ↗ · pubmed ↗
- 4Vickers AJ Cronin AM Elkin EB Gonen M . Extensions to decision curve analysis, a novel method for evaluating diagnostic tests, prediction models and molecular markers. BMC Med Inform Decis Mak. (2008) 8:53. doi: 10.1186/1472-6947-8-53, PMID: 19036144 PMC 2611975 · doi ↗ · pubmed ↗
- 5Gillies RJ Kinahan PE Hricak H . Radiomics: images are more than pictures, they are data. Radiology. (2016) 278:563–77. doi: 10.1148/radiol.2015151169, PMID: 26579733 PMC 4734157 · doi ↗ · pubmed ↗
- 6Lambin P Rios-Velazquez E Leijenaar R . Radiomics: extracting more information from medical images using advanced feature analysis. Eur J Cancer. (2012) 48:441–6. doi: 10.1016/j.ejca.2011.11.036, PMID: 22257792 PMC 4533986 · doi ↗ · pubmed ↗
- 7Gillies RJ Kinahan PE Hricak H . Radiomics: images are more than pictures, they are data. (2013) 278:563–77. doi: 10.1148/radiol.2015151169, PMID: 26579733 PMC 4734157 · doi ↗ · pubmed ↗
- 8Aerts HJ Velazquez ER Leijenaar RT Parmar C Grossmann P Carvalho S . Decoding tumour phenotype by noninvasive imaging using a quantitative radiomics approach. Nat Commun. (2014) 5:4006. doi: 10.1038/ncomms 5006, PMID: 24892406 PMC 4059926 · doi ↗ · pubmed ↗