Association and predictive value of sarcopenic obesity for the prognosis of lung cancer patients receiving immune checkpoint inhibitors
Tingting Yang, Wen Wang, Yan Qiao, Ke Guan, Weixiang Wang, Yang Yang, Yongchun Chen, Lijun Shen

TL;DR
Sarcopenic obesity is linked to worse survival in lung cancer patients undergoing immunotherapy, suggesting it could help predict outcomes and guide treatment.
Contribution
This study identifies sarcopenic obesity as an independent prognostic factor for lung cancer patients receiving immune checkpoint inhibitors.
Findings
Patients with sarcopenic obesity had the lowest 3-year survival rate (median survival: 22.55 months).
Sarcopenic obesity was an independent predictor of reduced survival in multivariate analysis.
Early identification of sarcopenic obesity may improve treatment strategies for immunotherapy patients.
Abstract
Sarcopenic obesity (SO) has been established as a reliable predictor of prognosis for several cancer types; however, its role in the prognosis of lung cancer patients receiving immune checkpoint inhibitors (ICIs) remains unclear. This study aimed to explore the potential predictive value of SO on survival outcomes in lung cancer patients undergoing ICI therapy. From May 2018 to October 2020, lung cancer patients who received immunotherapy at a tertiary hospital in Henan Province were retrospectively evaluated using data from the electronic medical record system. Data on demographic characteristics, biochemical markers, current illnesses and treatments, and nutrition-related information were documented. Sarcopenia was evaluated using the skeletal muscle index (SMI) (cm2/m2), which was calculated by measuring the muscle mass area from a cross-sectional CT image at the L3 vertebra level…
Genes, proteins, chemicals, diseases, species, mutations and cell lines named across the full text — each resolved to its canonical identifier and authoritative record.
Click any figure to enlarge with its caption.
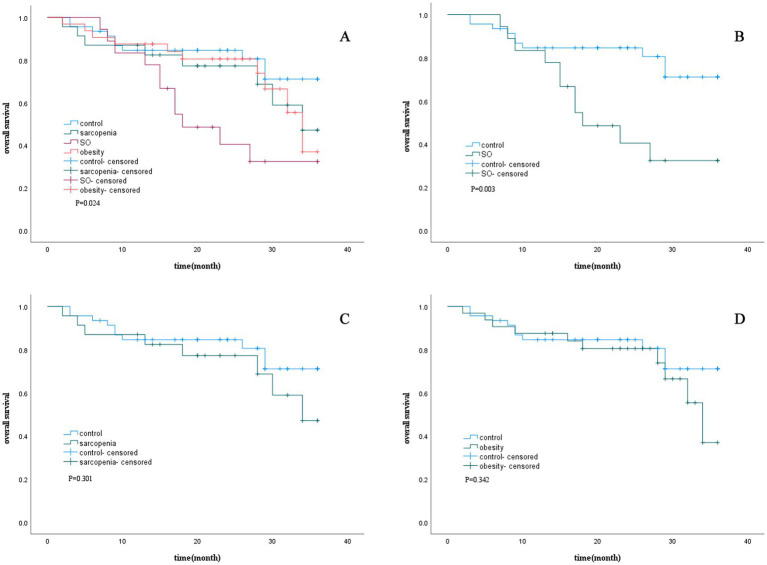 Figure 1
| Variables | Total ( | Control ( | Sarcopenia ( | Sarcopenic obesity ( | Obesity ( | |
|---|---|---|---|---|---|---|
| Demographic characteristics | ||||||
| Gender | 0.052 | |||||
| Male | 79 (66.40) | 30 (65.20) | 11 (47.80) | 16 (88.90) | 22 (68.80) | |
| Female | 40 (33.60) | 16 (34.80) | 12 (52.20) | 2 (11.10) | 10 (31.20) | |
| Age (year) | 61.22 ± 11.56 | 60.11 ± 10.86 | 64.87 ± 10.33 | 64.39 ± 8.10 | 58.41 ± 14.16 | 0.112 |
| Height (cm) | 165.23 ± 8.28 | 163.91 ± 8.75 | 162.83 ± 6.75 | 171.06 ± 7.70 | 165.56 ± 7.58 | 0.006 |
| Weight (kg) | 64.12 ± 11.69 | 59.00 ± 7.17 | 53.39 ± 7.17 | 76.72 ± 9.36 | 72.09 ± 8.36 | <0.001 |
| BMI (kg/m2) | 23.33 ± 3.12 | 22.33 (21.15, 23.23) | 20.11 ± 2.12 | 25.51 (24.94, 27.26) | 25.71 (24.44, 27.68) | <0.001 |
| VFA (cm2) | 120.34 ± 72.59 | 88.06 ± 50.67 | 65.69 ± 48.79 | 164.20 ± 68.71 | 181.37 ± 57.68 | <0.001 |
| SMI (cm2/m2) | 46.53 ± 8.20 | 47.71 ± 5.36 | 36.34 ± 3.53 | 44.88 ± 4.87 | 53.11 ± 8.17 | <0.001 |
| Smoking | 0.842 | |||||
| Yes | 40 (33.60) | 16 (34.80) | 6 (26.10) | 6 (33.30) | 12 (37.50) | |
| No | 79 (66.40) | 30 (65.20) | 17 (73.90) | 12 (66.70) | 20 (62.50) | |
| Biochemical markers | ||||||
| Neutrophils (×109/L) | 4.21 (2.95, 5.56) | 3.52 (2.83, 6.14) | 3.67 (2.95, 5.12) | 5.06 ± 1.97 | 4.55 (2.98, 5.33) | 0.466 |
| Lymphocyte (×109/L) | 1.24 (0.89, 1.83) | 1.51 ± 0.63 | 1.09 (0.84,1.50) | 1.02 (0.87,1.78) | 1.24 (0.97, 1.73) | 0.356 |
| Monocyte count (×109/L) | 0.43 (0.32,0.57) | 0.45 (0.27,0.57) | 0.40 (0.32,0.58) | 0.50 ± 0.21 | 0.43 (0.33, 0.52) | 0.356 |
| Hemoglobin (g/L) | 123.95 ± 19.68 | 125.51 ± 20.27 | 113.26 ± 16.04 | 122.17 ± 18.45 | 130.41 ± 19.39 | 0.012 |
| Albumin (g/L) | 39.90 (35.80, 43.10) | 40.40 (35.98, 43.43) | 37.93 ± 5.59 | 38.45 ± 5.17 | 40.73 ± 4.18 | 0.857 |
| Creatinine (μmol/L) | 59.00 (50.00, 68.00) | 60.50 (53.75, 69.75) | 55.43 ± 15.81 | 64.00 (56.50, 69.00) | 58.28 ± 11.37 | 0.170 |
| Cystatin (mg/L) | 0.93 (0.85, 1.05) | 0.91 (0.84, 1.02) | 1.01 ± 0.19 | 1.04 ± 0.21 | 0.90 ± 0.13 | 0.122 |
| Current disease and treatment | ||||||
| Pathologist classification | 0.992 | |||||
| Small cell carcinoma | 11 (9.20) | 4 (8.70) | 2 (8.70) | 2 (11.10) | 3 (9.40) | |
| Non-small cell carcinoma | 108 (90.80) | 42 (91.30) | 21 (91.30) | 16 (88.90) | 29 (90.60) | |
| Stages | 0.628 | |||||
| II/III | 30 (25.20) | 9 (19.60) | 7 (30.40) | 6 (33.30) | 8 (25.00) | |
| IV | 89 (74.80) | 37 (80.40) | 16 (69.60) | 12 (66.70) | 24 (75.00) | |
| Surgery | 0.341 | |||||
| Yes | 13 (10.90) | 8 (17.40) | 2 (8.70) | 1 (5.60) | 2 (6.20) | |
| No | 106 (89.10) | 38 (82.60) | 21 (91.30) | 17 (94.40) | 30 (93.80) | |
| Metastasis | 0.169 | |||||
| Yes | 18 (15.10) | 10 (21.70) | 4 (17.40) | 0 (0.00) | 4 (12.50) | |
| No | 101 (84.90) | 36 (78.30) | 19 (82.60) | 18 (100.00) | 28 (87.50) | |
| Line of ICIs therapy | 0.226 | |||||
| 1L | 62 (52.10) | 30 (65.20) | 9 (39.10) | 8 (44.40) | 15 (46.90) | |
| 2L | 37 (31.10) | 13 (28.30) | 9 (39.10) | 6 (33.30) | 9 (28.10) | |
| ≥3L | 20 (15.80) | 3 (6.50) | 5 (21.80) | 4 (22.30) | 8 (25.00) | |
| Combination with chemotherapy | 0.177 | |||||
| Yes | 91 (76.50) | 39 (84.80) | 14 (60.90) | 14 (77.80) | 24 (75.00) | |
| No | 28 (23.50) | 7 (15.20) | 9 (39.10) | 4 (22.20) | 8 (25.00) | |
| Combination with RT/targeted therapy | 0.564 | |||||
| Yes | 82 (68.90) | 33 (71.70) | 13 (56.60) | 13 (72.70) | 23 (71.90) | |
| No | 37 (31.10) | 13 (28.30) | 10 (43.50) | 5 (27.80) | 9 (28.10) | |
| ECOG-PS | 0.268 | |||||
| 0–2 | 91 (76.50) | 37 (80.40) | 14 (60.90) | 14 (77.80) | 26 (81.30) | |
| 3–4 | 28 (23.50) | 9 (19.60) | 9 (39.10) | 4 (22.20) | 6 (18.80) | |
| Nutrition-related information | ||||||
| NRS2002 | 0.362 | |||||
| <3 | 82 (68.90) | 29 (63.00) | 15 (65.20) | 12 (66.70) | 26 (81.30) | |
| ≥3 | 37 (31.10) | 17 (37.00) | 8 (34.80) | 6 (33.30) | 6 (18.70) | |
| GLIM severity grading | 0.015 | |||||
| No | 93 (78.20) | 36 (78.20) | 15 (65.30) | 14 (77.80) | 28 (87.50) | |
| Moderate | 13 (10.90) | 5 (10.90) | 1 (4.30) | 4 (22.20) | 3 (9.40) | |
| Severe | 13 (10.90) | 5 (10.90) | 7 (30.40) | 0 (0.00) | 1 (3.10) | |
| PNI | 46.42 ± 6.42 | 46.93 ± 7.11 | 44.11 ± 6.94 | 45.55 ± 4.32 | 47.82 ± 5.67 | 0.163 |
| Variables | Univariable model | Multivariable Model | ||||
|---|---|---|---|---|---|---|
|
| 95% |
|
| 95% |
| |
| Gender (ref. male) | 1.054 | 0.541–2.054 | 0.876 | |||
| Age (year) | 1.021 | 0.991–1.050 | 0.168 | |||
| VFA (cm2) | 1.002 | 0.997–1.006 | 0.423 | |||
| Smoking (ref. No) | 1.247 | 0.653–2.380 | 0.504 | |||
| Sarcopenic status (ref. Control) | ||||||
| Obesity | 1.491 | 0.620–3.586 | 0.372 | 0.976 | 0.406–2.533 | 0.976 |
| Sarcopenia | 1.632 | 0.643–4.140 | 0.303 | 0.578 | 0.204–1.641 | 0.303 |
| Sarcopenic obesity | 3.479 | 1.470–8.237 | 0.005 | 3.479 | 1.374–8.814 | 0.009 |
| Biochemical markers | ||||||
| Neutrophils (×109/L) | 1.043 | 0.928–1.173 | 0.478 | |||
| Lymphocyte (×109/L) | 0.440 | 0.244–0.795 | 0.006 | |||
| Monocyte count (×109/L) | 0.993 | 0.500–1.969 | 0.983 | |||
| Hemoglobin (g/L) | 0.977 | 0.961–0.993 | 0.005 | |||
| Albumin (g/L) | 0.917 | 0.868–0.970 | 0.002 | |||
| Creatinine (μmol/L) | 0.978 | 0.955–1.002 | 0.078 | 0.963 | 0.936–0.990 | 0.008 |
| Cystatin (mg/L) | 0.848 | 0.155–4.641 | 0.849 | |||
| Current disease and treatment | ||||||
| Pathologist classification (ref. Small cell carcinoma) | ||||||
| Non-small cell carcinoma | 2.592 | 0.623–10.782 | 0.190 | |||
| Stages (ref. III or II) | ||||||
| IV | 2.090 | 0.917–4.766 | 0.080 | |||
| Surgery (ref. no) | ||||||
| Yes | 0.472 | 0.113–1.965 | 0.302 | |||
| Metastasis (ref. no) | ||||||
| Yes | 1.622 | 0.745–3.534 | 0.223 | |||
| Line of ICIs therapy (ref.1 L) | ||||||
| 2 L | 3.683 | 1.731–7.838 | <0.001 | 4.274 | 1.941–9.411 | 0.001 |
| ≥3 | 3.475 | 1.479–8.215 | 0.005 | 2.980 | 1.169–7.597 | 0.022 |
| Combination with chemotherapy (ref. No) | ||||||
| Yes | 0.460 | 0.231–0.918 | 0.028 | |||
| Combination with RT/targeted therapy (ref. No) | ||||||
| Yes | 1.280 | 0.623–2.629 | 0.501 | |||
| ECOG-PS (ref. 0–2) | ||||||
| 3–4 | 3.959 | 2.091–7.495 | <0.001 | 5.274 | 2.670–10.418 | <0.001 |
| Nutrition-related information | ||||||
| NRS2002 (ref. <3) | ||||||
| ≥3 | 1.425 | 0.737–2.756 | 0.292 | |||
| GLIM (ref. No) | ||||||
| Moderate | 1.503 | 0.579–3.904 | 0.402 | |||
| Severe | 1.714 | 0.709–4.143 | 0.231 | |||
| PNI | 0.906 | 0.863–0.952 | <0.001 | |||
Peer Reviews
No public reviews on file for this paper yet. If you reviewed it on a platform where reviews are public (OpenReview, ICLR, NeurIPS, ICML), you can paste yours below so the community can read it here.
Videos
No videos yet. Explain this paper in a talk, walkthrough, or lecture? Add one.
Taxonomy
TopicsNutrition and Health in Aging · Cancer Risks and Factors · Inflammatory Biomarkers in Disease Prognosis
Introduction
1
Lung cancer, a malignant tumor with high incidence and mortality rates worldwide, poses a serious threat to human health. Epidemiological data indicate that lung cancer exhibits the highest incidence among male malignancies and ranks second in female populations (1). Notably, it has the highest mortality rate across all cancer types. According to the 2020 global cancer incidence and mortality statistics, lung cancer accounted for 11.4% of all cancer cases, making it the second most common malignancy after breast cancer, and both the incidence and mortality rates of lung cancer are experiencing an upward trend worldwide (1, 2).
The advent of immune checkpoint inhibitors (ICIs) has revolutionized treatment paradigms for lung cancer, offering remarkable survival benefits and improvements in quality-of-life in clinical practice (3, 4). However, significant variability in treatment responses among patients remains a challenge. Increasing evidence suggests that intrinsic patient factors—particularly nutritional status and body composition—may critically modulate the efficacy of immunotherapy (5). Among these, sarcopenic obesity (SO), a pathophysiological condition characterized by concurrent sarcopenia and excess fat accumulation (6, 7), has emerged as a potential determinant of therapeutic outcomes. Previous studies have established SO as a robust predictor of cancer prognosis. Liu et al. (8) conducted a prospective cohort study involving 6,790 patients with solid tumors and found that SO was associated with worse overall survival (hazard ratio, HR = 1.54), reduced quality of life, and an increased risk of ICU admission. Gao et al. (9) performed a comprehensive systematic review and meta-analysis encompassing 38 studies involving 10,004 patients with cancer. This analysis revealed an aggregate prevalence of SO at 20% and significant correlations with poorer overall survival (HR = 1.83), reduced recurrence-free survival (HR = 2.10), increased surgical complications (HR = 3.01), and longer hospital stays (HR = 5.69).
However, evidence regarding the prognostic impact of SO on lung cancer patients undergoing ICI therapy remains limited. Although SO has been recognized as a prognostic factor in various cancers, its specific impact on outcomes following ICI therapy in lung cancer patients has not been fully elucidated. To address this knowledge gap, we designed a retrospective cohort study to systematically evaluate the effects of both sarcopenia and SO on treatment outcomes in ICI-treated lung cancer patients.
Materials and methods
2
Study participants
2.1
This retrospective study analyzed data obtained from lung cancer patients who received ICIs at a tertiary hospital in Henan Province, China. The inclusion criteria were as follows: (1) age ≥18 years; (2) pathologically confirmed lung cancer; (3) receipt of at least two cycles of ICI therapy; (4) availability of an abdominal CT scan performed within 1 week prior to the initiation of ICI therapy; and (5) complete clinical, laboratory, and imaging data. The exclusion criteria included the following: (1) a prior history of immunotherapy for lung cancer, (2) concurrent primary malignancies at other sites, (3) the use of hormonal therapy, or (4) absence of imaging of the third lumbar vertebra (L3) level in CT scans. The study protocol was approved by the Ethics Committee of Henan Provincial People’s Hospital.
Data collection and follow-up
2.2
From May 2018 to October 2020, 146 lung cancer patients who met the predefined inclusion and exclusion criteria and received ICI therapy were identified in the hospital’s electronic medical record system for inclusion in the study. Baseline clinical data were retrospectively extracted from medical records, including age, gender, height, weight, body mass index (BMI), smoking status, tumor pathology, tumor stage (according to the 8th edition of the AJCC), surgical history, metastasis status, and laboratory results (including neutrophil, lymphocyte, and monocyte counts and hemoglobin, albumin, creatinine, and cystatin levels), line of ICI therapy, and whether the therapy was combined with chemotherapy, with radiotherapy (RT)/targeted therapy. Other data extracted included the patient’s Eastern Cooperative Oncology Group Performance Status (ECOG-PS), Nutritional Risk Screening 2002 (NRS2002), Global Leadership Initiative on Malnutrition (GLIM), and the Prognostic Nutritional Index (PNI). Overall survival (OS) was defined as the time from the initiation of immunotherapy until death from any cause or the last follow-up (September 2023), with follow-up limited to a maximum of 3 years. Ultimately, 119 patients with complete information were included in the analysis.
Diagnostic criteria and classification of sarcopenia
2.3
The skeletal muscle area (SMA) at the L3 level on CT scans was used as a reliable indicator of whole-body skeletal muscle mass. All participants underwent CT scans within 1 week before immunotherapy. A quantitative analysis was performed using software developed by Shen et al.1 The specific procedures included: (1) SMA segmentation using Hounsfield unit (HU) thresholds (−29 to 150) and (2) automated calculation of the SMA using a convolutional neural network (CNN), which is a type of deep learning algorithm. The skeletal muscle index (SMI) was calculated by dividing the SMA (cm^2^) by the square of height (m^2^) (SMI = SMA/height^2^). Sarcopenia was defined as an SMI < 43 cm^2^/m^2^ for men with a BMI < 25 kg/m^2^, an SMI < 53 cm^2^/m^2^ for men with a BMI ≥ 25 kg/m^2^, and an SMI < 38 cm^2^/m^2^ for women (10). This classification has been extensively utilized in oncological research and demonstrates significant prognostic value for cancer patients (11, 12). The visceral fat area (VFA) was manually measured at the umbilical level using HU ranges of −150 to −50. All measurements were independently performed by two trained operators.
Patients were classified into four body composition subtypes: control (BMI < 24.0 kg/m^2^ without sarcopenia), sarcopenic (BMI < 24.0 kg/m^2^ with sarcopenia), obese (BMI ≥ 24.0 kg/m^2^ without sarcopenia), and SO (BMI ≥ 24.0 kg/m^2^ with sarcopenia).
Statistical analysis
2.4
Continuous variables with a normal distribution were presented as the mean ± standard deviation, while those with a non-normal distribution were expressed as the median (25th and 75th percentiles). Comparisons between groups for continuous variables were conducted using the Kruskal–Wallis H test or analysis of variance (ANOVA). Categorical variables were presented as frequencies (percentages). Differences among categorical variables were assessed using Pearson’s chi-squared test. The Kaplan–Meier method and log-rank testing were used to analyze the association between body composition characteristics and 3-year overall survival (OS). Univariable and multivariable Cox regression analyses were performed to identify independent prognostic factors influencing OS in lung cancer patients receiving immunotherapy. A two-sided p-value of <0.05 was considered statistically significant. The data were analyzed using SPSS 22.0.
Results
3
Baseline characteristics of the study population
3.1
Based on the inclusion and exclusion criteria, 146 hospitalized lung cancer patients receiving immunotherapy were initially enrolled. After excluding 9 cases with missing data on sarcopenia, 15 cases lost to follow-up, and 3 cases lacking both sarcopenia data and follow-up information, a total of 119 patients (81.5% of the original cohort) met all eligibility requirements and were included in the final analysis. Control (n = 46; 38.65%); sarcopenia (n = 23; 19.33%); obesity (n = 32; 26.89%); and SO (n = 18; 15.13%). The final cohort consisted of 79 men (66.40%) and 40 women (33.60%), with a mean age of 61.22 ± 11.56 years and a mean BMI of 23.33 ± 3.12 kg/m^2^. Differences were observed between the SO group and the other groups in terms of height, weight, BMI, visceral fat area (VFA), SMI, lymphocyte count, and hemoglobin levels (p < 0.05) (Table 1).
Impact of sarcopenic obesity on survival time
3.2
The impact of SO on survival time in lung cancer patients was analyzed using Kaplan–Meier curves (Figure 1). The results demonstrated that for 3-year survival rates, patients with SO had the highest mortality rate (median survival: 22.55 months), followed by those with sarcopenia alone (median survival: 28.29 months) and those with obesity alone (median survival: 28.99 months). In contrast, the control group exhibited the lowest mortality rate (median survival: 30.44 months). Significant differences were observed between the survival curves (p = 0.024).
Survival curve according to sarcopenic status. (A) Kaplan–Meier curves for 3-year overall survival in patients with obesity, sarcopenia, SO and control. (B) Kaplan–Meier curves for 3-year overall survival in patients with and without SO. (C) Kaplan–Meier curves for 3-year overall survival in patients with and without sarcopenia. (D) Kaplan–Meier curves for 3-year overall survival in patients with and without obesity. SO, sarcopenic obesity.
Further survival analyses, stratified by the presence of sarcopenia, SO, or obesity, showed that SO was associated with significantly shorter survival times compared to the control group, with statistically significant differences in the survival curves (p < 0.05).
Impact of sarcopenic obesity on survival time
3.3
The results of univariable and multivariable Cox regression analyses are presented in Table 2. Univariate Cox regression analysis of 3-year survival in lung cancer patients receiving immunotherapy identified several significant factors as follows: SO (HR = 3.479, 95% CI = 1.470–8.237), lymphocyte count (HR = 0.440, 95% CI = 0.244–0.795), hemoglobin level (HR = 0.977, 95% CI = 0.961–0.993), albumin level (HR = 0.917, 95% CI = 0.868–0.970), line of ICI therapy (2 L: HR = 3.683, 95% CI = 1.731–7.838; ≥3 L: HR = 3.475, 95% CI = 1.479–8.215), combination with chemotherapy (HR = 0.460, 95% CI = 0.231–0.918), an ECOG-PS ≥ 3 (HR = 3.959, 95% CI = 2.091–7.495), and the prognostic nutritional index (PNI) (HR = 0.906, 95% CI = 0.863–0.952). The multivariate analysis identified the following independent prognostic factors: SO (HR = 3.479, 95% CI = 1.374–8.814), creatinine level (HR = 0.963, 95% CI = 0.936–0.990), receiving ICIs as second-line therapy (HR = 4.274, 95% CI = 1.941–9.411), receiving ICIs as third-line or later therapy (HR = 2.980, 95% CI = 1.169–7.597), and an ECOG-PS ≥ 3 (HR = 5.274, 95% CI = 2.670–10.418).
Discussion
4
This study used a retrospective cohort design to investigate the influencing factors of survival time in ICI-treated lung cancer patients and explore the predictive value of sarcopenia and SO on the survival period after receiving immunotherapy. Cox regression analyses revealed that SO, an ECOG-PS ≥ 3, line of ICI therapy ≥2 L, and low creatinine levels were independent factors associated with reduced survival time in lung cancer patients. Kaplan–Meier curve analysis visually presented the survival differences among lung cancer patients across different groups. The results showed that the 3-year survival rate of immunotherapy in lung cancer patients with SO was the lowest, followed by the sarcopenic and obesity groups. In contrast, the control group exhibited the most favorable outcomes. These findings highlight the critical need for routine assessment and targeted intervention for SO in lung cancer patients receiving immunotherapy.
A multivariable Cox regression analysis further clarified the independent prognostic factors associated with the 3-year survival outcomes of lung cancer patients. The results indicated that even after multivariate adjustment, SO (HR = 3.479, 95% CI = 1.374–8.814) continued to have a consistently negative impact on patient survival, reflecting a significantly higher risk ratio. Therefore, it plays a crucial role in clinical prognosis assessment. Our findings align with previous conclusions that cancer patients who develop SO tend to have a poorer prognosis. A systematic review and meta-analysis of 38 observational studies on the prevalence and prognostic significance of SO in cancer patients revealed that SO individuals had a 1.83-fold increased mortality risk (RR = 1.83, 95% CI: 1.41–2.38) compared to non-sarcopenic obese patients (9). A cohort study conducted by Li Y et al. (13) identified that SO was a significant predictor of survival outcomes in hepatocellular carcinoma (HCC) patients undergoing transarterial chemoembolization (TACE). Previous research on SO and survival outcomes in lung cancer patients has been relatively limited, with the majority of studies focusing primarily on the prognostic impact of sarcopenia alone in this population. Bolte et al. (14) found that sarcopenia independently predicted worse overall survival (OS) in non-small cell lung cancer (NSCLC) patients (HR = 2.12), with sarcopenic patients having a median OS of 9.1 months compared to 22.3 months in non-sarcopenic patients. A systematic review conducted by Lin et al. (15) confirmed that sarcopenia is common among lung cancer patients and is linked to a higher incidence of postoperative complications, shorter progression-free survival after immunotherapy, and reduced OS. Moreover, sarcopenic patients had significantly higher mortality rates, regardless of cancer stage or treatment, reinforcing its negative impact on survival outcomes.
The mechanism by which SO influences the prognosis of lung cancer patients receiving immunotherapy remains unclear. Several studies have indicated that muscle loss leads to a reduction in the secretion of certain immunomodulatory factors by muscle cells, such as interleukin-7 (IL-7) and interleukin-15 (IL-15). When the secretion of these cytokines is insufficient, both the quantity and function of T cells are affected, resulting in a weakened ability of the body’s immune surveillance and immune response against tumor cells (16–18). In the context of obesity, there is an excessive accumulation of adipose tissue in the body, and adipocytes secrete large quantities of inflammatory cytokines, such as tumor necrosis factor-alpha (TNF-α) and interleukin-6 (IL-6). These inflammatory cytokines can inhibit the proliferation and activation of T cells and interfere with the normal functioning of the immune system (19–21). In addition, obesity can also lead to metabolic disorders in immune cells, affecting the energy supply and functional performance of T cells. This impairs their ability to be effectively activated and exert their immune-killing function against tumor cells, thereby creating favorable conditions for the growth and escape of tumors (22, 23). The complex interaction between SO and the tumor microenvironment has a significant impact on the growth of lung cancer and the efficacy of immunotherapy. Obesity is likely to cause metabolic abnormalities such as hyperglycemia and hyperlipidemia, providing favorable conditions for the synthesis of tumor cell membranes, energy metabolism, and rapid proliferation, which further promotes the growth of tumors (24, 25). A decrease in muscle mass will affect the function of immune cells and the activation of stromal cells in the tumor microenvironment. The disruption of the immune balance weakens the attack of the immune system on tumor cells, promoting the proliferation, invasion, and metastasis, and inhibiting the function of immune cells (26–28).
An ECOG-PS ≥ 3 (HR = 5.274, 95% CI = 2.670–10.418) was also confirmed as an independent prognostic factor. Patients with an ECOG-PS score of ≥ 3 had a 5.274 times higher risk of OS than those with an ECOG-PS score of < 3. ECOG-PS ≥ 3 reflects an extremely poor physical condition, indicating a decline in overall body function. This deterioration makes it challenging for patients to tolerate the burden of tumors and immunotherapy, which negatively impacts survival. Multiple studies have shown that the lower the ECOG-PS score, the higher the survival rate of patients. Blagden et al. (29) conducted a study on NSCLC patients and found that, after adjusting for sex and disease stage, the ECOG-PS score was an independent predictor of survival in multivariate Cox regression analysis. Patients with an ECOG-PS score of 0–1 demonstrated significantly longer median survival compared to those with an ECOG-PS score of 2–4. Similarly, Ma et al. (30) analyzed 988 small cell lung cancer patients and observed that an ECOG-PS score of 0–1 was associated with better OS (median OS: 17 months for ECOG 0–1 vs. 11 months for an ECOG 2–3, p < 0.001).
Multivariable Cox regression analysis demonstrated that patients receiving later-line ICI therapy faced significantly elevated mortality rates compared to first-line recipients (2 L: HR = 4.274, 95% CI:1.941–9.411; ≥3 L: HR = 2.980, 95% CI:1.169–7.597). These findings are consistent with previously reported outcomes by Li S et al. (11). This pattern may be explained by the more preserved immune competence and higher tumor immunogenicity typically observed in treatment-naïve patients. In contrast, those progressing to later lines of treatment often present with a higher tumor burden and more aggressive disease biology, representing a population with intrinsically diminished therapeutic potential (31). While PD-L1 expression represents a well-established predictive biomarker for ICI response (32), its assessment was not included in our multivariate analysis due to limited data availability, highlighting the need for future studies incorporating standardized PD-L1 evaluation to further elucidate the relationship between treatment line and immunotherapy efficacy.
It is particularly worth noting that the results of the multivariate analysis show that the creatinine level is an independent prognostic factor (HR = 0.963, 95% CI = 0.936–0.990). This suggests that an increase in the creatinine level is actually associated with a reduced risk of mortality. The underlying mechanism of this phenomenon may be closely related to the metabolic characteristics of creatinine production. Creatinine is continuously produced by muscle tissue through the metabolism of phosphocreatine, and its production is positively correlated with muscle mass (33). In the SO group, there was a decrease in muscle mass, which resulted in a compensatory reduction in the rate of creatinine production. As a result, serum creatinine levels failed to accurately reflect the glomerular filtration function. Even in cases of renal function damage, the reduced generation of creatinine from muscle sources can cause the serum creatinine test values to remain within the normal range, thereby masking the true state of renal function. This complex relationship between creatinine production and renal function assessment suggests that relying solely on serum creatinine levels to judge renal function and prognosis in clinical practice has limitations. It is necessary to combine multiple indicators, such as muscle mass assessment and glomerular filtration rate, for a more accurate evaluation of patient prognosis.
Interestingly, our research findings indicate that obese patients with sarcopenia have the poorest prognosis. In multivariate analysis, isolated sarcopenia or obesity did not predict the survival rates, highlighting the synergistic effect of these conditions. In SO patients, there is usually no obvious short-term weight change or visible signs of weight loss, and they are often misdiagnosed as having no nutritional risk without a computerized tomography (CT) scan. In this study, our research shows that SO is a potential predictor of overall survival in lung cancer patients receiving ICIs and serves as an independent prognostic factor. Without timely nutritional interventions, malnutrition can have an adverse impact on the prognosis of patients and lead to serious consequences. Implementing appropriate detection can help achieve early discovery, early diagnosis, and timely nutritional intervention, which increases the possibility of improving clinical prognosis. Therefore, timely identification and screening of malnourished patients with SO are crucial for helping them reverse their malnutrition status (34, 35).
This study has several limitations. First, its retrospective design could not draw causal inferences, and the small sample size in the sarcopenic obesity subgroup (n = 18) may limit statistical power. Second, the single-center cohort and strict inclusion criteria may introduce selection bias. Third, the potential limitations of the CT-based body composition analysis, including technical variations in scanning protocols and patient-related factors, should be considered when interpreting the results. Additionally, the CT-based sarcopenia cutoff values were derived from Western populations, although the methodology was validated among Chinese lung cancer patients. Future prospective, multi-center studies with larger sample sizes are needed to validate these findings and establish optimized CT diagnostic thresholds specific to the Asian populations. Despite these limitations, our study provides robust preliminary evidence through rigorous body composition assessments, adjustments for key confounders, and long-term follow-up.
Conclusion
5
This study indicated that SO was independently associated with poorer survival outcomes, even after adjusting for clinical and laboratory confounding factors. This highlights the crucial interaction between muscle depletion and fat mass in determining prognosis during immunotherapy, serving as a valuable reference for assessing the prognosis of lung cancer patients, particularly those receiving immunotherapy. Incorporating body composition assessments into clinical practice could help improve risk stratification and facilitate more precise disease evaluation and personalized treatment planning.
The reference list from the paper itself. Each links out to its DOI / PubMed record.
- 1Sung H Ferlay J Siegel RL Laversanne M Soerjomataram I Jemal A . Global Cancer statistics 2020: GLOBOCAN estimates of incidence and mortality worldwide for 36 cancers in 185 countries. CA Cancer J Clin. (2021) 71:209–49. doi: 10.3322/caac.21660, 33538338 · doi ↗ · pubmed ↗
- 2Riudavets M de Garcia Herreros M Besse B Mezquita L. Radon and lung cancer: current trends and future perspectives. Cancers. (2022) 14:3142. doi: 10.3390/cancers 14133142, 35804914 PMC 9264880 · doi ↗ · pubmed ↗
- 3Lee CS Devoe CE Zhu X Fishbein JS Seetharamu N. Pretreatment nutritional status and response to checkpoint inhibitors in lung cancer. Lung Cancer Manag. (2020) 9:LMT 31. doi: 10.2217/lmt-2020-0008, 32346405 PMC 7186851 · doi ↗ · pubmed ↗
- 4Borghaei H Paz-Ares L Horn L Spigel DR Steins M Ready NE . Nivolumab versus docetaxel in advanced nonsquamous non-small-cell lung cancer. N Engl J Med. (2015) 373:1627–39. doi: 10.1056/NEJ Moa 1507643, 26412456 PMC 5705936 · doi ↗ · pubmed ↗
- 5Guller M Herberg M Amin N Alkhatib H Maroun C Wu E . Nutritional status as a predictive biomarker for immunotherapy outcomes in advanced head and neck cancer. Cancers. (2021) 13:5772. doi: 10.3390/cancers 13225772, 34830929 PMC 8616447 · doi ↗ · pubmed ↗
- 6Cruz-Jentoft AJ Bahat G Bauer J Boirie Y Bruyere O Cederholm T . Sarcopenia: revised European consensus on definition and diagnosis. Age Ageing. (2019) 48:601. doi: 10.1093/ageing/afz 046, 31081853 PMC 6593317 · doi ↗ · pubmed ↗
- 7Veronese N Ragusa FS Pegreffi F Dominguez LJ Barbagallo M Zanetti M . Sarcopenic obesity and health outcomes: an umbrella review of systematic reviews with meta-analysis. J Cachexia Sarcopenia Muscle. (2024) 15:1264–74. doi: 10.1002/jcsm.13502, 38897937 PMC 11294015 · doi ↗ · pubmed ↗
- 8Liu C Liu T Deng L Zhang Q Song M Shi J . Sarcopenic obesity and outcomes for patients with Cancer. JAMA Netw Open. (2024) 7:e 2417115. doi: 10.1001/jamanetworkopen.2024.17115, 38874924 PMC 11179127 · doi ↗ · pubmed ↗