SERAPHIM 2.0: an extended toolbox for studying phylogenetically informed movements
Simon Dellicour, Nuno R Faria, Rebecca Rose, Philippe Lemey, Oliver G Pybus

TL;DR
The SERAPHIM 2.0 toolbox helps study how pathogens spread over time and space by analyzing genetic data and environmental influences.
Contribution
SERAPHIM 2.0 introduces new tools for visualizing, simulating, and testing phylogeographic hypotheses influenced by environmental factors.
Findings
The package now includes visualization tools and dispersal metrics for phylogeographic analysis.
It offers hypothesis testing to assess how environmental factors affect pathogen dispersal dynamics.
Several phylogeographic simulators are implemented for modeling lineage movements.
Abstract
We report the second version of the R package “seraphim”, a toolbox developed to process and analyze the output of spatially explicit phylogeographic reconstructions. This approach – also known as continuous phylogeographic inference – is commonly used in molecular epidemiology to reconstruct the dispersal history and spatiotemporal dynamics of rapidly evolving pathogens. The “seraphim” package now implements a broad range of features including (i) visualization of phylogeographic inferences, (ii) estimation of lineage dispersal metrics, (iii) several phylogeographic simulators, and (iv) hypothesis testing procedures to investigate the impact of environmental factors on variables such as diffusion velocity, dispersal location, and dispersal frequency of phylogenetic lineages. The package is openly available (https://github.com/sdellicour/seraphim) along with a series of tutorials…
Genes, proteins, chemicals, diseases, species, mutations and cell lines named across the full text — each resolved to its canonical identifier and authoritative record.
Click any figure to enlarge with its caption.
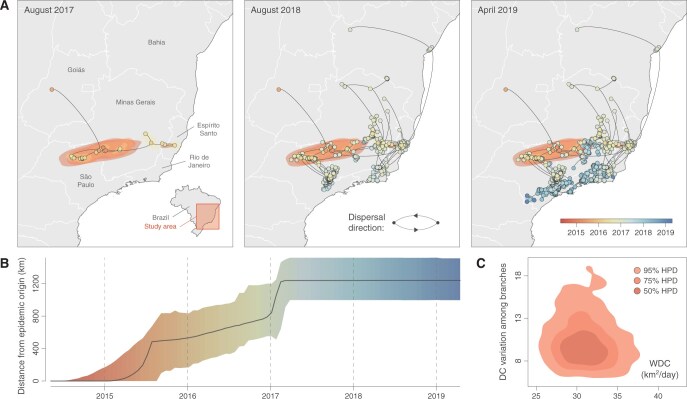 Figure 1
- —University of Brussels
- —Belgian Science Policy Office10.13039/501100002749
Peer Reviews
No public reviews on file for this paper yet. If you reviewed it on a platform where reviews are public (OpenReview, ICLR, NeurIPS, ICML), you can paste yours below so the community can read it here.
Videos
No videos yet. Explain this paper in a talk, walkthrough, or lecture? Add one.
Taxonomy
TopicsEvolution and Genetic Dynamics · Genomics and Phylogenetic Studies · Trypanosoma species research and implications
1 Introduction
When placed in a spatio-temporal context, phylogenetic trees can constitute a valuable source of information about the dispersal history and dynamics of viruses, and is achieved through phylogeographic inference. Popular methods for phylogeographic inference are typically categorized into discrete versus continuous approaches (Baele et al. 2018). Discrete approaches – based on discrete trait analysis (Lemey et al. 2009) or structured coalescent approximations (De Maio et al. 2015, Müller et al. 2018, Müller et al. 2025) – are based on an a priori definition of a set of discrete sampling locations and usually requires the assumption that all ancestors of the sampled viruses existed only at locations belonging to that set (Dellicour et al. 2018b). While spatial discretization can be sometimes arbitrary and/or lead to over-simplification, discrete phylogeography approaches have however proven relevant and useful in a number of studies, e.g. when attempting to test hypotheses about the impact of external factors on the frequency of dispersal events among discrete locations through generalized linear modeling (Lemey et al. 2014, Dudas et al. 2017). Continuous phylogeographic methods (Lemey et al. 2010, Fisher et al. 2021, Guindon and De Maio 2021, Bastide et al. 2024) represent an alternative approach to the spatial reconstruction of virus spread. Continuous approaches are particularly relevant when the pattern of spatial virus dispersal maintains a relationship with geographic distance; this may not always be the case, e.g. when the global spread of human respiratory viruses is driven by international air traffic (Lemey et al. 2014). While discrete and continuous approaches represent complementary tools to reconstruct viral spread in space and in time, it is important to note that both approaches are impacted by sampling bias (Kalkauskas et al. 2021, Layan et al. 2023).
Continuous phylogeographic inference has been made popular by its implementation (Lemey et al. 2010, Pybus et al. 2012) in the software package BEAST for Bayesian phylogenetic inference (Drummond et al. 2012, Bouckaert et al. 2019, Baele et al. 2025). This continuous phylogeographic approach uses 2D relaxed random walk (RRW) diffusion models to infer the location – i.e. geographic coordinates – of ancestral nodes within phylogenetic trees, while allowing for branch-specific variation in dispersal velocity (Pybus et al. 2012, Dellicour et al. 2021). Continuous phylogeographic inference is widely used in molecular epidemiology to reconstruct the spread of fast-evolving pathogens, such as RNA viruses, and has been notably applied to a number of emerging infections of humans (Faria et al. 2018, Kraemer et al. 2021). Yet, while spatially explicit, these methods do not model nor attempt to identify the (continuous) environmental factors that may affect the dispersal process, which motivated the implementation of the first version of the “seraphim” toolbox (Dellicour et al. 2016a).
We here present a second, substantially updated version of our R package “seraphim”, which was developed to analyze phylogenetically informed movement inference through continuous phylogeographic analysis. Specifically, “seraphim” 2.0 can be used to (i) visualize continuous phylogeographic reconstructions, (ii) estimate lineage dispersal statistics, (iii) perform continuous phylogeographic simulations, and (iv) conduct various hypothesis tests on the impact of environmental factors on the dispersal dynamic of lineages. Our open-source R package is available on GitHub along with a series of tutorials and associated example files that describe and illustrate how to apply the different analytical procedures it provides.
2 Features
Since its first release ten years ago (Dellicour et al. 2016a), several new features and methods have been added to “seraphim” and these are described below (see also Table 1, available as supplementary data at Bioinformatics online for an overview of all the new and updated functions in the package). The first step of all the analytical frameworks implemented in “seraphim” remains the generation of spatio-temporal information by sampling phylogenetic trees from a posterior distribution of trees inferred through Bayesian continuous phylogeographic inference. After this step, each posterior tree is decomposed as an extraction table, in which each row corresponds to a distinct phylogenetic branch summarized as a movement vector (Pybus et al. 2012) with a duration, start and end times, as well as start and end locations. The resulting set of extraction tables then serve as the basis of all the subsequent visualizations and analyses that can be conducted with the toolbox.
2.1 Visualization of continuous phylogeographic reconstructions
The package “seraphim” offers a flexible framework to generate detailed and customizable visualizations of continuous phylogeographic reconstructions. The newly available “spreadGraphic1” and “spreadGraphic2” functions can be used to estimate highest posterior density (HPD) polygons that reflect the uncertainty associated with the Bayesian phylogeographic inference. While the “spreadGraphic1” function extracts the 80% HPD polygons associated with each internal node of an individual maximum clade credibility (MCC) tree (previously retrieved and annotated with the program TreeAnnotator; Baele et al. 2025), the “spreadGraphic2” function estimates HPD polygons corresponding to successive time slices while considering several posterior trees and all internal nodes falling in each time slice. Unlike the implementation available in the first version of “seraphim”, these uncertainty polygons can now be saved in a vectorial format (i.e. shapefiles) and reported alongside the mapping of the MCC tree to summarize a continuous phylogeographic reconstruction (see Fig. 1A for an example). The utility of a visualization conducted in R lies in the flexibility of the geographic and landscape features that users can choose to plot together with a phylogeographic reconstruction; such features might include administrative borders, water flows, and/or any environmental factors that may have impacted the spread of lineages (and which can be further investigated with the hypothesis testing approaches implemented in the toolbox; see below).
Examples of visualizations that can be generated with the toolbox “seraphim” 2.0. Visualizations are based on a continuous phylogeographic analysis of the yellow fever virus (YFV) outbreak that started around 2015 in southeastern Brazil (Hill et al. 2022). (A) Continuous phylogeographic reconstruction of the dispersal history of YFV outbreak lineages: maximum clade credibility (MCC) tree and overall 80% highest posterior density (HPD) regions reflecting the uncertainty of the Bayesian phylogeographic inference summarized from 1000 trees sampled from the post-burn-in posterior tree distribution. MCC tree nodes are colored according to their time of occurrence and 80% HPD regions were computed for successive time layers and then superimposed using the same color scale to reflect time. The underlying map delimiting the Brazilian states was retrieved from the Database of Global Administrative Areas (GADM; https://gadm.org). (B) Evolution of the maximal wavefront distance from the epidemic origin: the solid curve represents the median value and the surrounding polygon the 95% HPD interval. Those estimates are also based on 1000 trees sampled from the post-burn-in posterior tree distribution, and the uncertainty polygon is colored according to the same time scale used in panel A. (C) Evaluation of the diffusion velocity of viral lineages through the estimation of the weighted diffusion coefficient (WDC): kernel density estimates of the diffusion coefficient (DC) parameters, with the posterior WDC estimates on the x-axis and the coefficient of variation of the diffusion coefficient among the branches of each sampled tree on the y-axis. In this graph, the three contours show, in shades of decreasing darkness, the 50%, 75%, and 95% HPD regions via kernel density estimation, respectively.
2.2 Estimation and comparison of dispersal statistics
The “spreadStatistics” function available in “seraphim” has been updated to allow the estimation of an extended set of complementary dispersal statistics, including diffusion coefficients (Pybus et al. 2012, Trovão et al. 2015) and isolation-by-distance (IBD) signal metrics (Dellicour et al. 2024). While diffusion coefficients can be estimated to measure the diffusion velocity of lineages within the study area, IBD signal metrics aim to measure to what extent phylogenetic branches are spatially structured or the tendency of phylogenetically closely related tips to be sampled from geographically proximate locations (Dellicour et al. 2024). Together, these two metrics constitute a comprehensive framework that can e.g. be used to compare the dispersal capacities and patterns associated with different viruses spreading in various geographic areas and/or host and vector populations. Examples of lineage dispersal statistic metrics that can be estimated and visualized with “seraphim” are illustrated in Fig. 1B and C.
2.3 Investigating the impact of environmental factors on the lineage dispersal dynamics
The newly extended version of our R package now includes several analytical procedures, known as “landscape phylogeographic analyses” (Dellicour et al. 2018b), to investigate the impact of environmental factors on the dispersal dynamics of lineages. While the initial version of the package (Dellicour et al. 2016a) only allowed testing of associations between environmental factors and lineage dispersal velocities (Dellicour et al. 2017), this procedure has now been modified to focus on the diffusion coefficient instead of the dispersal velocity of lineages (Dellicour et al. 2025). This change, which is implemented in the “spreadFactors” function, was motivated by the fact that diffusion coefficients were found to be more robust to sampling intensity (i.e. the sampling size) than metrics based on lineage dispersal velocity (Bastide et al. 2024, Dellicour et al. 2024, Neher 2025). It has been demonstrated that, contrary to diffusion coefficient estimates, lineage dispersal velocity estimates tend to increase with the number of samples included in the continuous phylogeographic analysis, which can be explained by a mechanistic dependence of these metrics on the number of tip nodes in the trees (Dellicour et al. 2024, Neher 2025).
In addition to this post hoc procedure, “seraphim” now implements a prior-informed landscape phylogeographic approach that can be applied as an alternative method to investigate the impact of environmental factors on the diffusion velocity of lineages. In contrast to the post hoc approach, the new prior-informed procedure integrates environmental heterogeneity before conducting continuous phylogeographic inference. In short, the environmental factor under investigation is used to transform the space and we then test if the continuous phylogeographic reconstruction conducted in the transformed space leads to a more regular (i.e. more Brownian) diffusion velocity of lineages; this analysis can indicate if environmental factors are associated with a degree of heterogeneity in diffusion velocity (Dellicour et al. 2025). Such prior-informed landscape phylogeographic analyses can, for instance, be conducted through an environmental factor-based multidimensional scaling (MDS) transformation, using the “mdsTransformation” function implemented in “seraphim”. This prior-informed approach is conceptually different from the updated post hoc procedure detailed above, and there are advantages and disadvantages to both approaches, making them complementary. While the post hoc approach can use the flexibility of the RRW to relax the assumption of a constant dispersal velocity and to capture the impact of environmental factors, it is in general more suited for dispersal processes that remain correlated with geographic distance to some extent. Although this limitation does not apply to the prior-informed approach, the prior-informed method carries a higher computational burden, because in order to test each environmental raster it is necessary to conduct a distinct continuous phylogeographic analysis, which can become very time-consuming (Dellicour et al. 2025).
In addition to investigating the impact of environmental factors on the diffusion velocity of lineages, the “spreadFactors” function can be used to also test for associations between such environmental factors and the dispersal locations of lineages (Dellicour et al. 2019, 2020), i.e. to explore if inferred lineages have a tendency to preferentially circulate, or avoid circulating, in specific environmental conditions. Because it is directly based on the environmental values extracted at the tree node positions, and given the fact that half of those are sampling locations associated with tip nodes, this landscape phylogeographic approach is intrinsically related to and impacted by the sampling pattern. The results from this approach should therefore be interpreted with caution and in the light of the sampling effort. Finally, the “spreadFactors” function now also allows users to conduct isolation-by-resistance (IBR) analyses (Dellicour et al. 2025). These analyses can be performed to test to what extent environmental factors might be associated with a deviation from an IBD pattern.
2.4 Spatially explicit phylogeographic simulators
The “seraphim” package now includes four phylogeographic simulators implemented in distinct functions: (i) the function “simulatorRRW1” to conduct simulations of a RRW diffusion process along time-scaled phylogenies, which was used to investigate the impact of barriers on the dispersal frequency of lineages (Dellicour et al. 2018a; Klitting et al. 2022); (ii) the function “simulatorRRW2” to conduct simulations based on a birth-death process and a Brownian random walk (BRW) or a RRW diffusion process, which was used to assess the robustness of dispersal metrics estimated from continuous phylogeographic reconstructions (Dellicour et al. 2024); (iii) the function “simulatorRRW3” to conduct simulations of a RRW diffusion process with a dispersal velocity impacted by an environmental raster, which was used to evaluate the statistical performance of landscape phylogeographic approaches (Dellicour et al. 2025); and (iv) the function “treesRandomisations” to conduct tree branch randomization on an environmental raster according to various randomization procedures, with the possibility of an impact of the environmental values on the repulsion or attraction of lineages when randomizing the tree branches within the study area. The latter function implements the tree branch randomization procedure (Dellicour et al. 2016b) used by the “spreadFactors” function to generate a null dispersal model for statistical estimation in the different landscape phylogeographic approaches.
3 Example of data analysis and visualization
Figure 1 illustrates the kind of visualizations that can be generated using “seraphim”. These visualizations are based on a continuous phylogeographic analysis of the yellow fever virus (YFV) outbreak that started around 2015 in southeastern Brazil (Hill et al. 2022). The phylogeographic inference was based on an alignment of 466 complete YFV genomes sequenced from samples collected exclusively from non-human primates or from mosquitoes (i.e. excluding available human samples), thus focusing on the sylvatic transmission cycle of the virus. The data aimed to investigate the environmental factors impacting the dispersal dynamics of viral lineages within the sylvatic reservoir (Hill et al. 2022). In this figure, we display (i) a visualization of the continuous phylogeographic reconstruction made of three successive, cumulative snapshots, corresponding to three distinct points in time (August 2017 and 2018, as well as the most recent sampling date in April 2019; Fig. 1A), (ii) a visualization of the evolution through time of the maximal wavefront distance from the epidemic origin (Fig. 1B), and (iii) evaluation of the diffusion velocity of viral lineages through the estimation of the weighted diffusion coefficient (Fig. 1C).
Supplementary Material
btag093_Supplementary_Data
The reference list from the paper itself. Each links out to its DOI / PubMed record.
- 1Baele G , Dellicour S, Suchard MA et al Recent advances in computational phylodynamics. Curr Opin Virol 2018;31:24–32.30248578 10.1016/j.coviro.2018.08.009 · doi ↗ · pubmed ↗
- 2Baele G , Ji X, Hassler GW et al BEAST X for Bayesian phylogenetic, phylogeographic and phylodynamic inference. Nat Methods 2025;22:1653–6.40624354 10.1038/s 41592-025-02751-x PMC 12328226 · doi ↗ · pubmed ↗
- 3Bastide P , Rocu P, Wirtz J et al Modeling the velocity of evolving lineages and predicting dispersal patterns. Proc Natl Acad Sci USA 2024;121:e 2411582121.39546571 10.1073/pnas.2411582121 PMC 11588136 · doi ↗ · pubmed ↗
- 4Bouckaert R , Vaughan TG, Barido-Sottani J et al BEAST 2.5: an advanced software platform for Bayesian evolutionary analysis. PLOS Comput Biol 2019;15:e 1006650.30958812 10.1371/journal.pcbi.1006650 PMC 6472827 · doi ↗ · pubmed ↗
- 5De Maio N , Wu C-H, O’Reilly KM et al New routes to phylogeography: a Bayesian structured coalescent approximation. P Lo S Genet 2015;11:e 1005421.26267488 10.1371/journal.pgen.1005421 PMC 4534465 · doi ↗ · pubmed ↗
- 6Dellicour S , Baele G, Dudas G et al Phylodynamic assessment of intervention strategies for the West African Ebola virus outbreak. Nat Commun 2018 a;9:2222.29884821 10.1038/s 41467-018-03763-2PMC 5993714 · doi ↗ · pubmed ↗
- 7Dellicour S , Bastide P, Rocu P et al How fast are viruses spreading in the wild? P Lo S Biol 2024;22:e 3002914.39625970 10.1371/journal.pbio.3002914 PMC 11614233 · doi ↗ · pubmed ↗
- 8Dellicour S , Gámbaro F, Jacquot M et al Comparative performance of viral landscape phylogeography approaches. Proc Natl Acad Sci USA 2025;122:e 2506743122.40569388 10.1073/pnas.2506743122 PMC 12232613 · doi ↗ · pubmed ↗