The Evolutionary Flexibility of the Drosophila Circadian Clock: Network Constraints or Adaptive Freedom?
Leo Douglas Creasey, Petar Borisov Petrov, Eran Tauber

TL;DR
This study examines how the circadian clock in fruit flies evolves, finding that it allows for flexibility rather than strict constraints.
Contribution
The study provides new insights into the evolutionary flexibility of the Drosophila circadian clock network.
Findings
Clk and per show high nucleotide divergence, while Pdp1 and sgg show little evolutionary change.
67 co-evolving site pairs were identified among CLK-PER, CLK-CWO, and SGG-PER.
Four genes (cwo, jet, per, and sgg) show evidence of positive selection.
Abstract
The study of network evolution is critical to understanding how complex biological processes arise and adapt over time. Protein networks, composed of interacting components, can exhibit varying degrees of conservation and flexibility, enabling organisms to fine-tune their responses to environmental changes. Using the circadian clock system in Drosophila as a case study, we explore how such networks evolve. We leverage the recently published 101 Drosophilidae genome project to analyze the evolution and co-evolution of 11 core clock proteins across 65 species spanning about 60 million years of evolution. A sliding window analysis of coding regions reveals substantial heterogeneity in nucleotide divergence, with Clk and per exhibiting high divergence, whereas Pdp1 and sgg show virtually no evolutionary change. Additionally, we assessed interdependent amino acid evolution across different…
Genes, proteins, chemicals, diseases, species, mutations and cell lines named across the full text — each resolved to its canonical identifier and authoritative record.
Click any figure to enlarge with its caption.
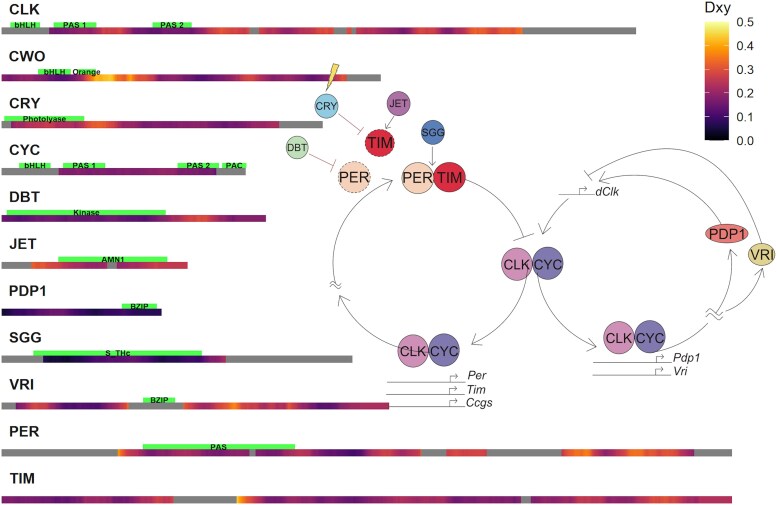 Fig. 1
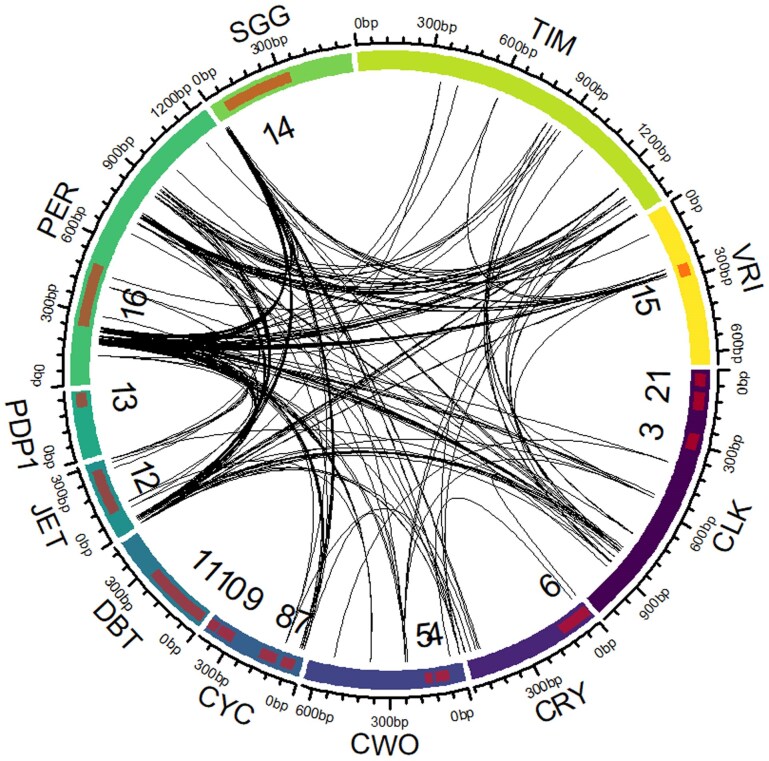 Fig. 2
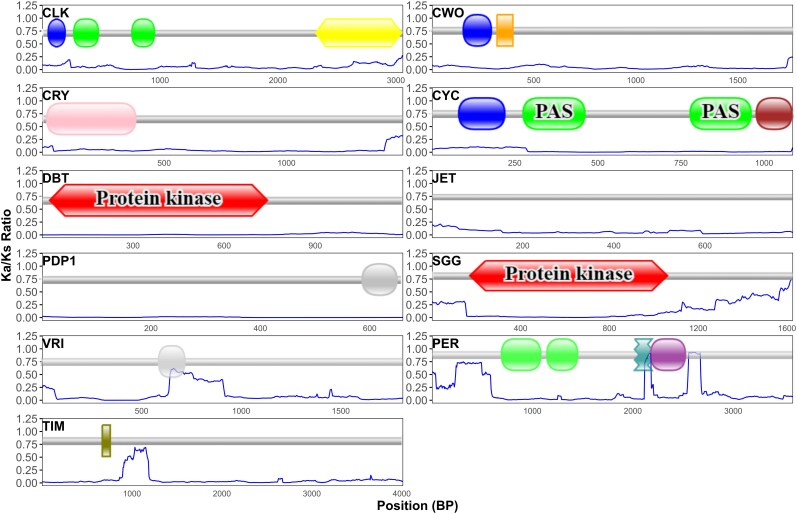 Fig. 3
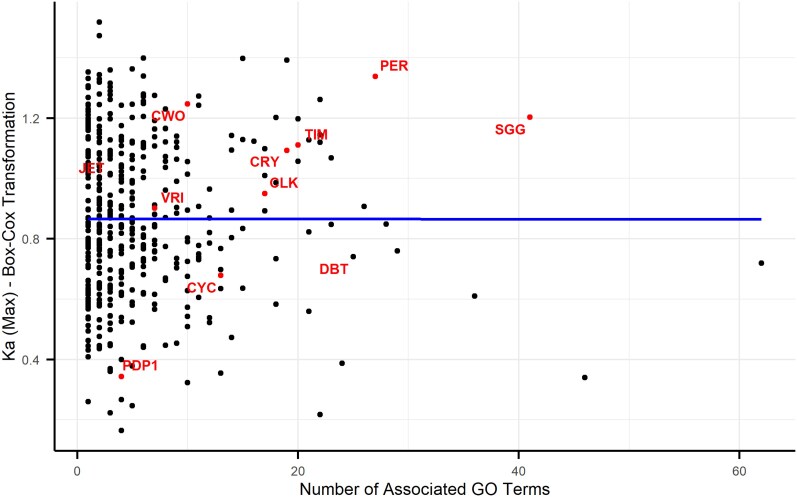 Fig. 4
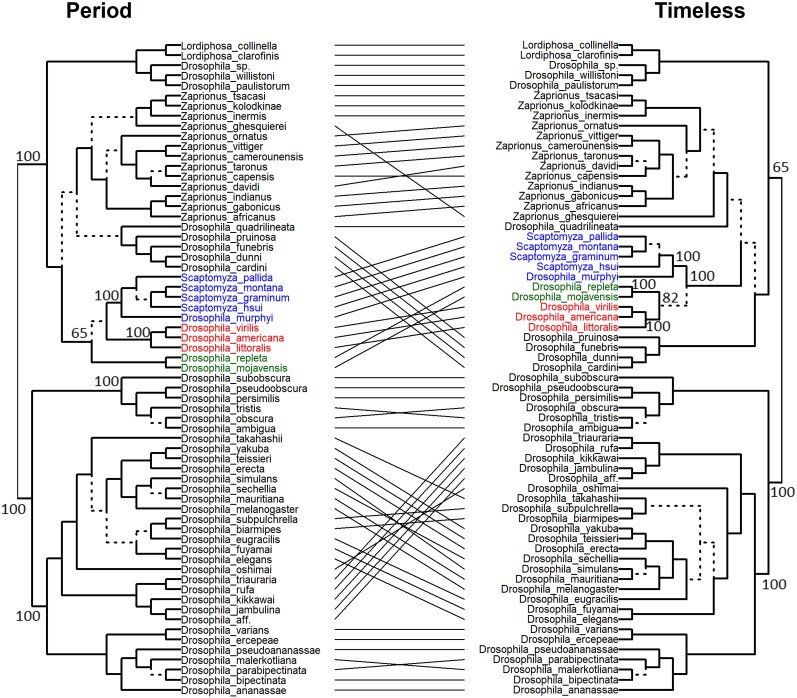 Fig. 5
| Gene | Model | df | LRT (2Δℓ) |
|
|---|---|---|---|---|
| CLK | M0 to M1 | 1 | 713.49 | 0.0 |
| M7 to M8 | 2 | −0.02 | 1.0 | |
| CRY | M0 to M1 | 1 | 501.19 | 0.0 |
| M7 to M8 | 2 | −0.01 | 1.0 | |
| CWO | M0 to M1 | 1 | 628.18 | 0.0 |
| M7 to M8 | 2 | 7.07 | 0.029* | |
| CYC | M0 to M1 | 1 | 45.74 | 0.0 |
| M7 to M8 | 2 | −0.01 | 1.0 | |
| DBT | M0 to M1 | 1 | 99.87 | 0.0 |
| M7 to M8 | 2 | −0.01 | 1.0 | |
| JET | M0 to M1 | 1 | 491.97 | 0.0 |
| M7 to M8 | 2 | 9.39 | 0.009* | |
| PDP1 | M0 to M1 | 1 | 7.51 | 0.006 |
| M7 to M8 | 2 | 4.39 | 0.112 | |
| PER | M0 to M1 | 1 | 2008.64 | 0.0 |
| M7 to M8 | 2 | 6.07 | 0.048* | |
| SGG | M0 to M1 | 1 | 2282.52 | 0.0 |
| M7 to M8 | 2 | 22.94 | 0.0*** | |
| TIM | M0 to M1 | 1 | 1802.13 | 0.0 |
| M7 to M8 | 2 | 1.13 | 0.567 | |
| VRI | M0 to M1 | 1 | 717.37 | 0.0 |
| M7 to M8 | 2 | −0.0 | 1.0 |
- —Marie Sklodowska-Curie ITN “CINCHRON’
Peer Reviews
No public reviews on file for this paper yet. If you reviewed it on a platform where reviews are public (OpenReview, ICLR, NeurIPS, ICML), you can paste yours below so the community can read it here.
Videos
No videos yet. Explain this paper in a talk, walkthrough, or lecture? Add one.
Taxonomy
TopicsCircadian rhythm and melatonin · Plant Molecular Biology Research · Chromosomal and Genetic Variations
Introduction
In multicellular organisms such as animals and plants, the number of phenotypic states far exceeds the number of proteins within their proteomes. This expansion of phenotypic diversity has been achieved through the evolution of complex gene and protein networks (Greenspan 2009). Mechanisms such as gene duplications enable proteins to acquire novel functions, thereby increasing the diversity of interactions within biological systems (Mottes et al. 2021). Gene duplications not only expand the protein network but also promote the development of new phenotypes, as duplicated genes diverge in function over time. Furthermore, mutations in existing proteins, referred to as link dynamics, serve as a dominant evolutionary force shaping network structure (Berg et al. 2004). The interplay between gene duplications, link dynamics, and stochastic variations in gene expression contributes to the rich diversity of protein networks. These processes illustrate how gene networks evolve to generate new phenotypes and enhance biological diversity through structural and functional innovations.
The circadian clock (Latin for circa “around” and diem “day”) is an endogenous pacemaker that drives diel physiological and biochemical rhythms. The circadian system allows organisms to track the predictable daily changes in their environment, such as light and temperature, resulting from Earth's self-rotation. This ability to anticipate environmental changes and synchronize behavior with optimal times of day provides a strong adaptive advantage. For example, the movement of sunflowers toward the east to face the rising sun and honeybee visits to specific flowers at particular times are both governed by circadian rhythms (Bloch et al. 2017).
Much of the understanding of the molecular circuit underpinning the circadian system has emerged from research on the fruit fly Drosophila melanogaster. The first clock gene to be discovered in the fruit fly was period (per), which, like the following genes that have been discovered, is highly conserved in all other animal groups, including humans.
The Drosophila circadian clock consists of two interlocking negative feedback loops (Fig. 1). In the core loop, CLOCK (CLK) and CYCLE (CYC) form a heterodimer that binds E-box elements to activate transcription of period (per) and timeless (tim), whose protein products PER and TIM subsequently form a complex that represses CLK–CYC activity, thereby completing the feedback cycle (Glossop et al. 1999). This repression is reinforced by CLOCK-WORK ORANGE (CWO), which binds E-box regions together with CLK–CYC (Zhou et al. 2016).
Nucleotide divergence of circadian clock genes across Drosophila species. Heatmap showing relative pairwise genetic divergence (Dxy) using a 150 bp sliding window. Grey regions indicate areas of low-quality alignment, where divergence estimates could not be reliably calculated. Inset: Schematic representation of the circadian clock molecular circuit, illustrating the core feedback loops and interactions among clock genes. Arrows indicate activating interactions, whereas blunt-ended lines indicate inhibitory interactions.
The stability and timing of PER and TIM are modulated by phosphorylation through kinases, including DOUBLETIME (DBT) and SHAGGY (SGG). A secondary regulatory loop operates in parallel, in which Vrille (VRI) represses Clk transcription, while PAR-domain protein 1ε (PDP1ε) activates it. Clock output is conveyed to downstream processes via factors such as the pigment-dispersing factor (PDF) neuropeptide and its receptor (PDFR). Entrainment of the circadian clock to the light–dark cycle is mediated by CRYPTOCHROME (CRY), a blue-light photoreceptor, which promotes light-dependent regulation of TIM (Ceriani et al. 1999) through JETLAG (JET), contributing to synchronization with environmental cues.
The circadian clock network is particularly interesting because several clock proteins are pleiotropic, serving roles beyond circadian regulation. For instance, CRY is involved in magnetosensitivity (Gegear et al. 2008), CRY and PDF influence geotaxis (Toma et al. 2002), and SGG participates in the Wnt signaling pathway, essential for development and organogenesis (Papadopoulou et al. 2004). Given their broad functions, pleiotropic genes are often subject to purifying selection, reducing genetic variation (Barbitoff et al. 2025). However, pleiotropy can also lead to balancing selection, maintaining genetic diversity by favoring different alleles for their effects on distinct traits (Mérot et al. 2020).
Previous studies have explored genetic variation in clock genes across different Drosophila species, demonstrating how the evolution of these genes drives molecular adaptations specific to the species’ ecological niches (Tauber et al. 2003). These studies have typically focused on the evolution of individual genes within the circadian clock, often in isolation. However, these genes operate as part of a highly interconnected network, and the evolution of the clock system has not been studied as a whole network of interacting proteins. The recent genome sequencing of 93 Drosophila species (Kim et al. 2021) allows for a comprehensive analysis of the evolution of circadian clock genes across multiple species. These species represent approximately 60 million years of evolutionary history and span 14 subgroups within Drosophila and Sophophora (Russo et al. 2013). Here, we analyzed this dataset and identified the orthologous clock proteins across all these species, providing a unique opportunity to examine the evolution of circadian clock genes not in isolation, but as part of a broader, interconnected gene network. One of the key questions addressed in this study is how pleiotropic genes within the circadian clock network evolve, and how their interactions with other genes in the network contribute to the broader evolutionary dynamics of gene networks.
Results
Sequence Divergence of Circadian Clock Genes
To assess how individual components of the circadian clock network have evolved, we began by examining patterns of nucleotide divergence across 11 core clock genes in 65 Drosophila species. We calculated pairwise nucleotide divergence (Dxy), which measures the average number of nucleotide differences per site between species, using a sliding window approach to capture local variation along each gene. This allowed us to identify both conserved and rapidly evolving regions. The analysis revealed substantial variation between and within genes (Fig. 1). Among the different genes, cwo and tim exhibited the highest levels of variability, with tim displaying the widest range of Dxy values, followed closely by cwo. These genes showed substantial fluctuations across their coding regions, indicating a high degree of localized molecular polymorphism. Clk and per also exhibited relatively high levels of diversity, with mean Dxy values around 0.23 and broad distributions spanning 0.105 to 0.379 and 0.137 to 0.344, respectively.
In contrast, Pdp1 and sgg were the most conserved genes in terms of nucleotide divergence. Pdp1 had the lowest mean Dxy (0.10) with a narrow distribution ranging from 0.051 to 0.155. Similarly, sgg exhibited a low mean Dxy (0.10) and the smallest minimum value (0.04), indicative of strong sequence conservation. cyc and dbt also demonstrated lower diversity, with mean divergence values around 0.17 and relatively stable distributions.
Variation within genes showed different patterns, with some genes, such as jet and cry, displaying relatively uniform levels of polymorphism across their length, whereas others, particularly cwo and tim, showed distinct regions of elevated diversity interspersed with conserved stretches. Clk, per, and vri exhibited intermediate levels of variation, with notable peaks and troughs in diversity along their coding sequences.
Coevolution of Amino Acids in Clock Proteins
To explore potential functional dependencies between clock proteins, we analyzed coevolution at the amino acid level using CAPS2 (Fares and McNally 2006). This method identifies pairs of residues across proteins that exhibit correlated evolutionary changes across species, which may indicate direct physical interactions, compensatory substitutions, or shared selective pressures. The analysis identified 304 significant co-evolving sites at FDR < 0.05 (Fig. 2, Table S1), spanning 29 unique protein combinations. The strongest signal involved PER, which formed dense networks with several partners. PER-JET accounted for 59 site pairs, followed by PER-TIM (41 pairs), PER-SGG (34 pairs), PER-CLK (25 pairs), and PER-VRI (25 pairs). Secondary hubs included JET-SGG (13 pairs), CYC-SGG, CLK-JET, CLK-TIM, and CWO-PER (12 pairs each), plus PER-CYC and JET-TIM (9 pairs each). Six combinations, including CRY-CWO, CRY-JET, CLK-CRY, and CLK-VRI, were represented by a single co-evolving site.
Co-evolving sites among circadian clock proteins. The circular plot shows significant co-evolving pairs of amino acids (p < 0.05). Highlighted sections represent functional domains: 1. bHLH; 2. PAS1; 3. PAS2; 4. bHLH; 5. Orange; 6. Photolyase; 7. bHLH; 8. PAS1; 9. PAS2; 10. PAC; 11. Kinase; 12. AMN1; 13. BZIP; 14. S_THc; 15. BZIP; 16. PAS.
The distribution of co-evolving sites was not uniform across the sequences, with some regions exhibiting a higher density of co-evolutionary links. Notably, no co-evolving sites were identified in protein pairs that are known to form heterodimers, such as CRY and TIM (Ceriani et al. 1999) or CLK and CYC (Liu et al. 2017). The lack of apparent co-evolution between physically interacting proteins or domains is consistent with recent work showing that compensatory coevolution contributes weakly to evolutionary rate covariation compared with shared selective pressures (Little et al. 2024).
As expected, the number of intra-protein coevolving sites is substantially higher than the number of inter-protein sites (Fig. S1). PER and TIM have the highest number of intra-protein site pairs (506 and 444, respectively), and PDP1 and DBT have the smallest number of intra-protein interactions (6 and 30).
Selection Analysis
To investigate patterns of selection pressure across the 11 circadian clock genes, we conducted a sliding window analysis to estimate the Ka/Ks ratio (ω) along the length of each gene. The Ka/Ks ratio compares the rate of nonsynonymous (amino acid–changing) substitutions to synonymous (silent) substitutions, providing insight into whether a gene is evolving under purifying, neutral, or positive selection. This analysis revealed considerable variation in selective pressure along the coding regions of different genes (Fig. 3). The majority of genes exhibited consistently low Ka/Ks ratios (ω << 1) throughout their lengths, indicative of strong purifying selection. These genes included Clk, cry, cyc, dbt, pdp1, tim, and vri. This suggests a strong evolutionary constraint, indicating high conservation and a small number of changes. While no genes displayed Ka/Ks ratios exceeding unity, suggesting pervasive positive selection, some genes exhibited regions with slightly elevated Ka/Ks ratios compared to the baseline. For per, the sliding window analysis showed peaks in ω within certain regions along the length of the sequence. A trend toward an increasing ω was observed toward the 3′ end in sgg, potentially suggesting relaxed evolutionary selection in this part of the gene. Subtle peaks in Ka/Ks ratios were also apparent along the lengths of cwo and jet, hinting at localized selective pressures.
Comparative analysis of selection pressures across Drosophila circadian clock genes using sliding window analysis of Ka/Ks ratios. The ratio of non-synonymous to synonymous substitution rates (ω) was calculated to identify signatures of selection.
To rigorously test for evidence of site-specific selection, we employed codon-based maximum likelihood models implemented in the PAML package (Yang 2007). We note that although these models operate at the codon level, they ultimately infer selection on the encoded amino acids, which determine protein structure, function, and potential interaction sites. Specifically, we compared two nested models: M7, which assumes that sites evolve under a beta distribution of ω values strictly less than 1 (i.e. purifying or neutral selection), and M8, which includes an additional category of sites with ω > 1, thus allowing for positive selection. A significant result from the likelihood ratio test (LRT) comparing M7 and M8 indicates that allowing for a class of positively selected codons provides a better fit to the data. The results of these analyses are summarized in Table 1.
The LRT comparing models M7 and M8 revealed statistically significant evidence of positive selection in 4 of the 11 genes examined: cwo, jet, per, and sgg (P < 0.05). This finding suggests that these genes have experienced adaptive evolution at specific codon sites. No significant evidence of positive selection was detected in Clk, cry, cyc, dbt, pdp1, tim, or vri, which is consistent with the strong purifying selection observed in the sliding window analysis. The genes with significantly higher LRT results are cwo, jet, per, and sgg. This supports the sliding windows result, further indicating these regions have undergone positive selection. The PAML analysis also revealed significant site-specific positive selection in three circadian clock genes: cwo (G203), per (G909), and sgg (G442; S452). The latter site is particularly important since it serves as an additional serine phosphorylation site of SGG in D. melanogaster, which is known to be important for circadian function (Beck et al. 2018).
We also tested for site-specific episodic diversifying selection using MEME (Mixed Effects Model of Evolution) (Murrell et al. 2012). MEME allows the nonsynonymous/synonymous rate ratio (ω) to vary across branches at each codon, thereby detecting positive selection that affects only a subset of lineages. At a significance threshold of P < 0.05, MEME identified numerous codons under episodic selection in most circadian clock genes. The largest numbers of significant sites were found in sgg (49 sites), tim (38), per (36), Clk (42), and vri (30). Additional genes also showed evidence of episodic selection, including cwo (29), jet (6), dbt (13), and cry (11). A smaller number of sites were detected in Pdp1 (4). Thus, nearly all core components of the circadian clock show signatures of lineage-specific positive selection, with particularly strong episodic signals in Clk, per, tim, sgg, and vri (Table S2)
Pleiotropy and Protein Evolution
Since some of the clock proteins are known to be pleiotropic, we have sought to explore the link between pleiotropy and protein divergence. To that end, we have analyzed 429 additional, randomly selected proteins from the same 65 Drosophila species that were used for the clock protein analysis. The annotation and alignment of these proteins were carried out in the same way as was done with the clock proteins. Using the number of GO terms associated as a measure of pleiotropy underscores this property among clock proteins (Fig. 4). Six clock proteins were amongst the top 10% of the number of associated GO terms, with PER and SGG being the most pleiotropic. Although these two proteins exhibited elevated nonsynonymous substitution rate (Ka), we found no significant link between Ka* and pleiotropy in clock proteins, or generally among the large sample of proteins (P = 0.99, Fig. 4). The gene-wise Ka also did not show a significant association with the pleiotropic score (Fig. S2). We have also estimated pleiotropy by the number of interactions that a gene/protein is known to have. Here, the linear model was also not significant (F1,388 = 1.40, P = 0.24), with a low adjusted R^2^ (0.001), suggesting again that protein interactions as a pleiotropy measure do not predict the level of Ka* (Fig. S2).
Relationship between evolutionary rate and pleiotropy in Drosophila proteins. The nonsynonymous substitution rate (Ka) was calculated across 440 proteins from 65 Drosophila species and plotted against each protein's pleiotropy score, measured as the number of associated GO terms. Each point represents an individual protein, with circadian clock proteins (n=11) highlighted in red. The blue line shows a linear regression fit to the data, which revealed no significant correlation between Ka and pleiotropy score (see text). Note that the x-axis contains a break to optimize the display of the data distribution.*
Incongruency of Protein Phylogenies
Incongruency between phylogenetic trees of proteins that are members of the same networks can provide valuable insights into the evolution and co-evolution of these proteins. Here, we generated mirror-trees (tanglegrams) of different pairs of clock proteins and assessed the level of incongruency between the dendrograms. The PER-TIM tanglegram shows a substantial incongruency (Fig. 5). For example, in the PER phylogeny, the virilis species group (e.g. D. virilis, D. americana, D. littoralis, shown in red) does not cluster with the repleta group (e.g. D. repleta, D. mojavensis, shown in green), but instead appears closer to the Scaptomyza clade (blue), thereby disrupting the monophyly of the subgenus Drosophila. In contrast, in the TIM phylogeny, the virilis and repleta groups cluster together, as expected for members of the subgenus Drosophila. Thus, PER's phylogeny fails to unite the virilis and repleta clades, a deviation previously noted in smaller datasets (Noreen et al. 2018).
Phylogenetic incongruence between PER and TIM protein trees in Drosophila. To examine potential co-evolution between these core circadian clock components, we compared phylogenetic trees inferred from nucleotide alignments of PER and TIM across 65 Drosophila species. The mirrored trees (tanglegram) reveal multiple topological incongruences (indicated by crossing lines) suggesting differing evolutionary pressures or rates of change acting on PER versus TIM. Branches leading to distinct subtrees are marked by dashed lines. Bootstrap support values (≥65%) are shown for major internal nodes.
The PER-CRY tanglegram also revealed several major topological incongruences (Fig. S3). In the CRY tree, species from the virilis and repleta groups form a single clade, consistent with their classification within subgenus Drosophila. The subgenus Drosophila comprises several major species groups, including the virilis and repleta groups, whereas Scaptomyza represents a more distantly related lineage that falls outside this subgenus. These relationships are well supported by accepted Drosophila species trees (Russo et al. 2013), which provide the phylogenetic framework for the colored clades shown in Fig. 5. In contrast, these groups are split in the PER tree, indicating disrupted monophyly. Another major difference involves the eugracilis–biarmipes lineage, which forms a clade in the PER tree but is broken in the CRY tree, where D. eugracilis is grouped with the elegans subgroup instead. These inconsistencies, especially where clades are clearly broken in one tree but intact in the other, suggest that PER and CRY have followed distinct evolutionary paths in some lineages, possibly reflecting different functional constraints or adaptive pressures. Substantial incongruencies are also present in the CLK-CYC, CLK-CWO and CRY-TIM tanglegrams (Fig. S4 to S6).
Discussion
Here, we measured the evolutionary rates shaping the circadian clock network. Focusing on coding DNA sequences, our implicit hypothesis was that species-specific adaptations to local environmental conditions would be mirrored by the pattern of molecular divergence and substitution rate that various core clock genes undergo.
Previous studies showed that variation in a single clock gene may modify circadian function. For example, diel locomotor and sexual activity profiles differ between D. melanogaster and D. psuedoobscura, and these differences are solely due to a species variation in the per gene as was demonstrated by comparing the behavior of transgenic D. melanogaster flies that harbored either the hetero- or the conspecific per gene (Tauber et al. 2003). However, in a different study, the rescue of the circadian function of per mutant D. melanogaster by different species per transgene yielded different levels of rescue, and this was explained by PER-TIM co-evolution (Piccin et al. 2000). Later experiments with two heterospecific transgenes expressing PER and TIM together in the double mutant D. melanogaster flies provided weak or partial evidence for co-evolution (Noreen et al. 2018). Similarly, the TIM transgene from remotely related species D. ananassae was able to rescue the circadian rhythm of D. melanogaster mutants (Nishinokubi et al. 2003), alluding to a weak constraint of co-evolution of TIM with other network proteins. These experiments are consistent with our finding here of modest molecular co-evolution between network proteins, which was notably not evident in pairs that are physically interacting, such as PER and TIM, or CLK and CYC (Fig. 2).
We acknowledge that the genetic variation in the core clock genes may capture only a small amount of the variation that drives local adaptation. Variation in other clock-controlled genes may contribute to variation in the circadian phenotypes, such as the phase, as was demonstrated in studies in D. melanogaster (Pegoraro et al. 2015, 2020), or in GWAS in human populations (Hu et al. 2016). Furthermore, some molecular adaptations in nonclock genes may modify the neuronal wiring of the clock neurons in the brain during development (rather than the cell-autonomous TTFL circuit). Species-specific wiring variations may lead to different neurochemistry of the circadian network, which may underlie the species local adaptation. For example, a study comparing D. ezoana and D. littoralis, from Northern Europe, to D. melanogaster, an equatorial strain, revealed expression patterns of PDF and CRY in clock and nonclock neurons that correlated with the different circadian behavior of high- and low latitudinal species (Menegazzi et al. 2017).
A central hypothesis in evolutionary biology is that pleiotropy, where a single gene influences multiple traits, constrains sequence evolution. Because mutations in such genes can have widespread deleterious effects, they are expected to be under strong purifying selection and evolve slowly, a pattern observed across diverse taxa (He and Zhang 2006; Hu et al. 2017; Mähler et al. 2017; Martin and Tate 2023).
Contrary to this expectation, our analysis revealed no significant correlation between a gene's pleiotropic degree and its rate of protein evolution (Ka). Highly pleiotropic genes like sgg or Pdp1 did not evolve more slowly than their less pleiotropic counterparts. We acknowledge, however, that both of our pleiotropy metrics (GO term annotation and gene interaction counts) are imperfect proxies. GO terms can be biased by differential annotation effort, and interaction databases may underrepresent certain pathways. Therefore, our conclusion refers to a lack of association between Ka and these proxies for pleiotropy, rather than pleiotropy itself.
This lack of association suggests that the impact of pleiotropy on the clock network is more nuanced than often assumed. One explanation is modular pleiotropy, where distinct protein domains compartmentalize different functions. This architecture may permit adaptive evolution in specific regions, such as those tuning circadian rhythms, without disrupting other vital roles, thus relaxing the overall sequence constraint (Chesmore et al. 2016).
Our findings highlight that the circadian clock network, despite its interwoven architecture and pleiotropic components, does not enforce an unusually slow evolutionary rate on its genes. This contrasts with a simplistic view that pleiotropy invariably slows evolution, and instead hints at an inherent flexibility in how clock genes balance multiple roles. One interpretation is that adaptive evolution in clock genes might occur through mechanisms other than protein-coding change, such as cis-regulatory modifications or gene expression adjustments, thereby sidestepping the pleiotropic constraints on the protein sequence. Zhang (2023) noted that evolutionary adaptation can sometimes be channeled through regulatory changes in pleiotropic genes to avoid detrimental effects on other traits. In the circadian system, species-specific adaptations of rhythms could predominantly involve changes in gene regulation or network interactions, allowing core clock protein sequences to drift more freely than expected. In the circadian clock, species-specific enhancer changes in pigment-dispersing factor (Pdf) abolish photoperiodic plasticity in D. sechellia, and the same variants shift evening activity in D. melanogaster (Shahandeh et al. 2024). Population genomic analyses reveal signals of directional selection on Pdf enhancers in D. sechellia and latitudinally varying selection in high-latitude D. melanogaster populations, illustrating how adaptive noncoding changes can reshape behavior without altering the protein.
Another source of variation we did not examine is alternative splicing. In D. melanogaster, the clock gene per yields two transcripts; warm temperatures favor the intron-retaining form, shortening the circadian period, whereas cool temperatures promote intron removal and lengthen it (Majercak et al. 1999). This thermal switch is weak in D. yakuba, showing that small regulatory changes rather than coding differences can adjust timing across species (Low et al. 2008). A similar “molecular thermometer” exists in timeless: cold favors tim-cold and tim-short-and-cold, heat elevates tim-medium, and toggling among them fine-tunes TIM levels (Anduaga et al. 2019). Close relatives retain this response, whereas more distant flies modify or lose it, and lineage-specific gains or losses of the responsive exons are seen across Diptera (Bullo et al. 2025). Thus, alternative splicing offers a versatile, noncoding route for thermal adaptation of circadian behavior. Because our study relied solely on genome sequences, we could not assess splice isoforms; resolving their evolutionary dynamics will require a comprehensive cross-species transcriptomic resource comparable in scope to current genomic datasets.
In addition to rate-based analyses, our tanglegram comparisons revealed notable phylogenetic incongruence between several clock-interacting proteins, including PER and TIM, as well as PER and CRY. While such discordance may result from incomplete lineage sorting, introgression, or differential selection pressures, the lack of detailed biological and ecological data, particularly regarding circadian behavior and photoperiodic adaptation for most Drosophila species, limits our ability to interpret these patterns confidently. Phylogenetic incongruence among gene trees is not uncommon, but in this case, further comparative work linking the evolution of clock proteins to species-specific traits would be needed to assess possible selective mechanisms.
In summary, the circadian clock genes provided an empirical test of the long-held assumption that pleiotropy constrains molecular evolution. Contrary to expectations from earlier studies and theoretical models, we found no evidence that pleiotropic clock genes evolve more slowly at the sequence level. This divergence from prior patterns underscores the complexity of evolutionary dynamics in protein networks. It suggests that pleiotropy's impact on sequence divergence is context-dependent and may be mitigated by modular functionality or alternative adaptive pathways. Our results contribute to a growing recognition that gene network evolution can accommodate pleiotropic versatility without universally imposing strong evolutionary constraint, thereby allowing even multifunctional proteins like clock components to explore sequence space and potentially facilitate lineage-specific innovations in circadian biology.
Materials and Methods
Gene Prediction and Protein Alignment
The 101 Drosophila genome project consisted of 101 genome scaffolds (Kim et al. 2021), lacking gene annotation. To identify the Drosophila 11 clock proteins (Fig. 1), we used AUGUSTUS software for gene prediction (Stanke et al. 2006). The search for the orthologous gene was facilitated using D. melanogaster sequences. These sequences were used in a BLAST search against a database of every genome from the 101 Drosophila genomes project. These BLAST fragments were then used to search for the predicted genes from the respective species. The collected sequences were aligned using MAFFT v7.490 (Katoh et al. 2002). These alignments are then scored using Alistat (Wong et al. 2020), where species sequences that had less than 40% consensus were removed. The sequences were converted to amino acid sequences and were re-aligned using the codon information. Finally, the alignments were adjusted by visual inspection. The final alignment included sequences from 65 different Drosophila species.
DNA Variation Analysis
To assess interspecific genetic variation, we calculated the average pairwise nucleotide divergence across Drosophila species, analogous to the π statistic. To that end, we used the pegas R package (Paradis and Barrett 2010). To minimize the sites with gaps in the data, we carried out pruning of the alignments, where sequences with a high percentage of gaps (over 5% of the total sequence length, or over 100 gap bases total) were removed. Using a custom code, the polymorphism was computed for a sliding window of a 180 bp window length, and a 6 bp step size. The output of the analysis was exported as text files and heatmap plots depicting polymorphism along the coding regions were created.
We carried out a nonsynonymous-to-synonymous substitution ratio test (the KA/KS test, ω) using a custom-made script and the SeqinR R package (Charif and Lobry 2007). The script runs a sliding window of 150 bp and a 6 bp step. This analysis provides a visual representation of the variation in selection pressure, with ω < 1 indicating purifying selection, ω ≈ 1 indicating neutral evolution, and ω > 1 suggesting positive selection. Graphs were made using the R software.
To test for the signature of negative purifying selection or accelerated evolution driven by positive Darwinian selection, we used the CodeML program from the PAML package (Yang 2007). We used the models M0 (One-ratio model), M1 (Nearly neutral model), M2 (Positive selection model), M7 (Beta model), and M8 (Beta & ω > 1 model). We compared the models using a likelihood ratio test. A custom script was made to conduct the model comparison and parse the significant sites from the results files.
We tested for site-wise episodic diversifying selection using MEME (Mixed Effects Model of Evolution) as implemented in HyPhy (Kosakovsky Pond et al. 2020). MEME fits a mixed-effects codon model that allows the nonsynonymous/synonymous rate ratio (ω) to vary across branches at each site, enabling detection of positive selection acting on a subset of lineages (episodic selection). We used the same codon alignments and gene trees as for the PAML analyses, ran MEME with default settings, and considered sites significant at P ≤ 0.05 (likelihood ratio test) unless otherwise specified.
We used the AutoCoEv pipeline (Petrov et al. 2022), which employs a modified version of the CAPS2 software (Fares and McNally 2006) to predict co-evolution between proteins. Notably, the patched version of CAPS2 provides extended statistical output, enabling correction for multiple comparisons. As orthologs had already been identified, we skipped the initial steps of AutoCoEv and proceeded directly from the prepared multiple sequence alignments (MSAs). Phylogenetic trees were generated using PhyML v3.3.20250515 (Guindon et al. 2010) and parsed into CAPS2, which was run with threshold settings of α = 0.05 and bootstrap = 0.95. We considered sites with Benjamini–Hochberg adjusted P-values (FDR) below 0.05 as statistically significant. The R package circlize was used to create the circular graphs (Gu et al. 2014).
To assess the pleiotropy of Drosophila genes, we used two distinct methods. The first utilized the DRoID interactome database (Murali et al. 2011). A custom-written code screened the database files and counted the number of times a gene of interest interacted with other genes. The database files that were used included yeast-2-hybrid files and the Flybase genetic interaction database (duplicate interactions were counted once).
The second method of quantifying pleiotropy was based on a gene of interest's number of Gene Ontology (GO) terms. Only the highest-level terms of the GO hierarchy (“Biological Process”) were counted. The consistency of these methods was compared using R. The rate of non-silent substitutions (Ka) across species was calculated as described above, and the effect of pleiotropy was tested using (i) the gene-wide overall Ka (ii) the maximum Ka (Ka*) of a window with few gaps (<1,000 of 6,630) from the sliding window analysis. A linear model was carried out in R using the MASS library with a Box-Cox transformation to stabilize the variance of the Ka data.
Phylogenetic Trees and Tanglegrams
Gene trees were generated with RAxML using default settings (Stamatakis 2014). These were imported into R. Using the ape R library (Paradis and Schliep 2019), the tree was converted to an ultrametric tree using the chronos() function. The “mirror-trees” (tanglegrams) of pairs of clock proteins were generated using the dendextend library (Galili 2015), and their co-evolution was visually analyzed.
Supplementary Material
evag061_Supplementary_Data
The reference list from the paper itself. Each links out to its DOI / PubMed record.
- 1Anduaga AM, et al Thermosensitive alternative splicing senses and mediates temperature adaptation in Drosophila. Elife. 2019:8:e 44642. 10.7554/ELIFE.44642.31702556 PMC 6890466 · doi ↗ · pubmed ↗
- 2Barbitoff YA, Bogaichuk PM, Pavlova NS, Malysheva PV, Predeus AV. Functional determinants and evolutionary consequences of pleiotropy in complex and Mendelian traits. Mol Biol Evol. 2025:42:msaf 232. 10.1093/molbev/msaf 232.40974070 PMC 12534788 · doi ↗ · pubmed ↗
- 3Beck K, Hovhanyan A, Menegazzi P, Helfrich-Förster C, Raabe T. Drosophila RSK influences the pace of the circadian clock by negative regulation of protein kinase shaggy activity. Front Mol Neurosci. 2018:11:361205. 10.3389/FNMOL.2018.00122/BIBTEX. · doi ↗
- 4Berg J, Lässig M, Wagner A. Structure and evolution of protein interaction networks: a statistical model for link dynamics and gene duplications. BMC Evol Biol. 2004:4:1–12. 10.1186/1471-2148-4-51/FIGURES/4.14720309 PMC 319700 · doi ↗ · pubmed ↗
- 5Bloch G, Bar-Shai N, Cytter Y, Green R. Time is honey: circadian clocks of bees and flowers and how their interactions may influence ecological communities. Philos Trans R Soc B Biol Sci. 2017:372:20160256. 10.1098/RSTB.2016.0256. · doi ↗
- 6Bullo E, Chen P, Fiala I, Smýkal V, Doležel D. Coevolution of Drosophila-type timeless with partner clock proteins. i Science. 2025:28:112338. 10.1016/J.ISCI.2025.112338.40322083 PMC 12049834 · doi ↗ · pubmed ↗
- 7Ceriani MF, et al Light-dependent sequestration of TIMELESS by CRYPTOCHROME. Science. 1999:285:553–556. 10.1126/science.285.5427.553.10417378 · doi ↗ · pubmed ↗
- 8Charif D, Lobry JR. Seqinr 1.0-2: a contributed package to the R project for statistical computing devoted to biological sequences retrieval and analysis. In: Bastolla U, Porto M, Roman HE, Vendruscolo M, editors. Structural approaches to sequence evolution. Biological and medical physics, biomedical engineering. Springer; 2007. p. 207–232. 10.1007/978-3-540-35306-5_10. · doi ↗