The effect of adding visual summaries to data visualizations on patient judgments of hypertension control
Victoria A Shaffer, Sean Duan, Pete Weiger, Michelle Bobo, Shannon M Canfield, Abigail Rolbiecki, Talile M Geleto, William Martinez, Richelle Koopman, David Dorr

TL;DR
This study tested how different visual summaries of blood pressure data affect patients' understanding and judgments of hypertension control.
Contribution
It compares the effectiveness of visual summaries like stoplight and gradient displays in a patient-facing digital application.
Findings
Uncontrolled hypertension led to higher perceived risk and lower perceived control.
Visual summaries did not significantly affect primary outcomes like risk perception or urgency.
Health literacy was related to judgments but did not interact with visual summary types.
Abstract
To test the impact of visual summaries of blood pressure (BP) data (eg, stoplight and gradient displays), within the context of a patient-facing digital application connected to the EHR, on patient judgments about hypertension control. Participants (N = 117; Internet sample of patients with hypertension) viewed graphs depicting BP data for fictitious patients. For each graph, participants rated perceived hypertension control, risk of heart attack and stroke, urgency, worry, and perceived understanding of health implications on a 0-100 slider bar and indicated the preferred action to take in response this BP data (eg, talk to doctor at next appointment, go to hospital immediately). Using a within-subjects design, all participants evaluated 12 graphs with data that varied in systolic BP mean (controlled or uncontrolled) and standard deviation (moderate or high) and included three…
Genes, proteins, chemicals, diseases, species, mutations and cell lines named across the full text — each resolved to its canonical identifier and authoritative record.
Click any figure to enlarge with its caption.
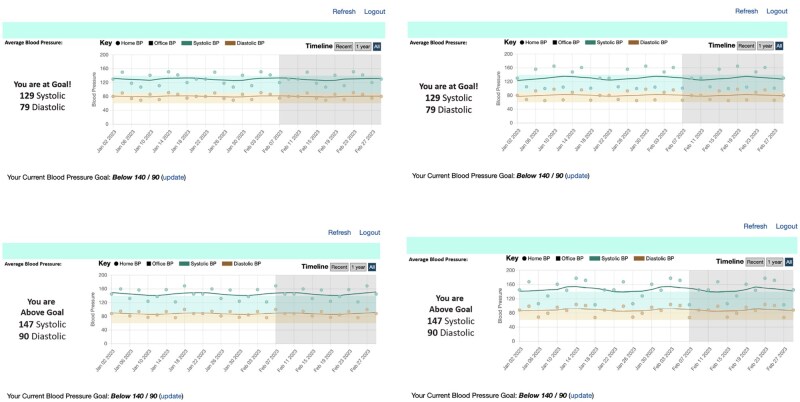 Figure 1
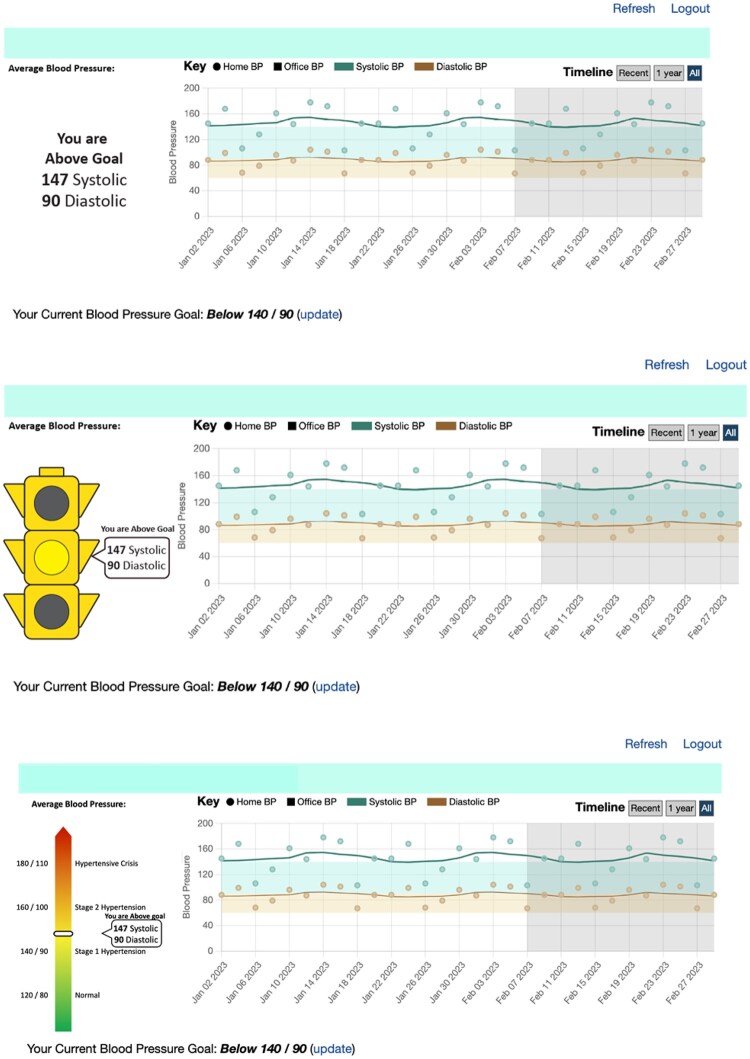 Figure 2
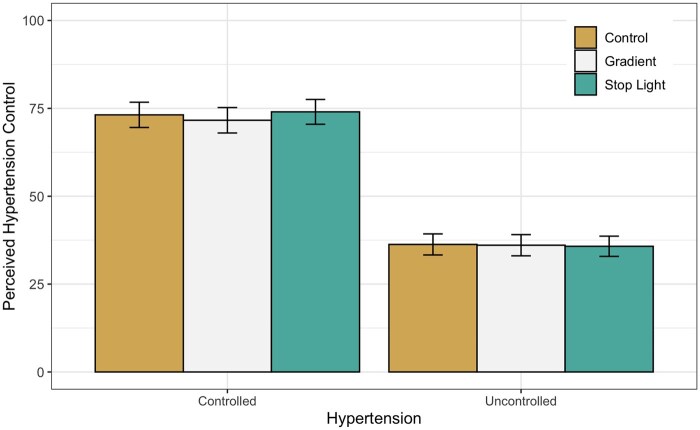 Figure 3
Peer Reviews
No public reviews on file for this paper yet. If you reviewed it on a platform where reviews are public (OpenReview, ICLR, NeurIPS, ICML), you can paste yours below so the community can read it here.
Videos
No videos yet. Explain this paper in a talk, walkthrough, or lecture? Add one.
Taxonomy
TopicsHealth Literacy and Information Accessibility · Data Visualization and Analytics · Electronic Health Records Systems