Review no. 2: a beginner’s guide for calculating eGFR slope using linear mixed-effects model in R—step-by-step methods and code examples
Megumi Oshima, Masahiko Gosho, Masao Iwagami, Yuka Sugawara, Hajime Nagasu, Takashige Kuwabara, Tadashi Sofue, Naoki Nakagawa, Yoshihisa Miyamoto

TL;DR
This paper provides a beginner-friendly guide on calculating eGFR slope using linear mixed-effects models in R, with step-by-step methods and code examples.
Contribution
The paper introduces a practical, hands-on approach to using linear mixed-effects models for eGFR slope calculation in R.
Findings
Linear mixed-effects models are more efficient than individual linear regression models for calculating eGFR slope.
The paper demonstrates how to calculate individual eGFR slopes and compare mean slopes between groups using R.
The method accounts for both population-level and subject-specific variations in eGFR data.
Abstract
Estimated glomerular filtration rate (eGFR) slope, which quantifies the annual change in kidney function using longitudinal measurements of eGFR, has emerged as a critical surrogate endpoint for chronic kidney disease progression in clinical trials. Accordingly, there is an increasing number of observational studies calculating the eGFR slope as an outcome or exposure of interest. To calculate the eGFR slope, linear mixed-effects models are considered statistically more efficient and therefore recommended over linear regression models constructed for each individual. Linear mixed-effects models can account for both fixed effects at the population level and random effects, which allow for subject-specific intercepts and slopes—e.g. individual-specific variation from the population mean. We introduce the practical implications of linear mixed-effects models using R programming:…
Genes, proteins, chemicals, diseases, species, mutations and cell lines named across the full text — each resolved to its canonical identifier and authoritative record.
Click any figure to enlarge with its caption.
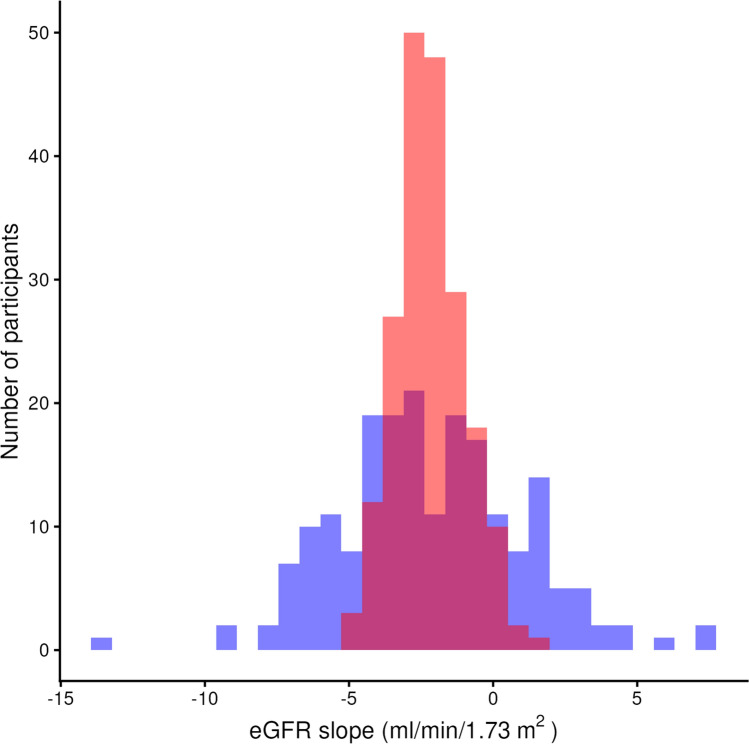 Figure 1
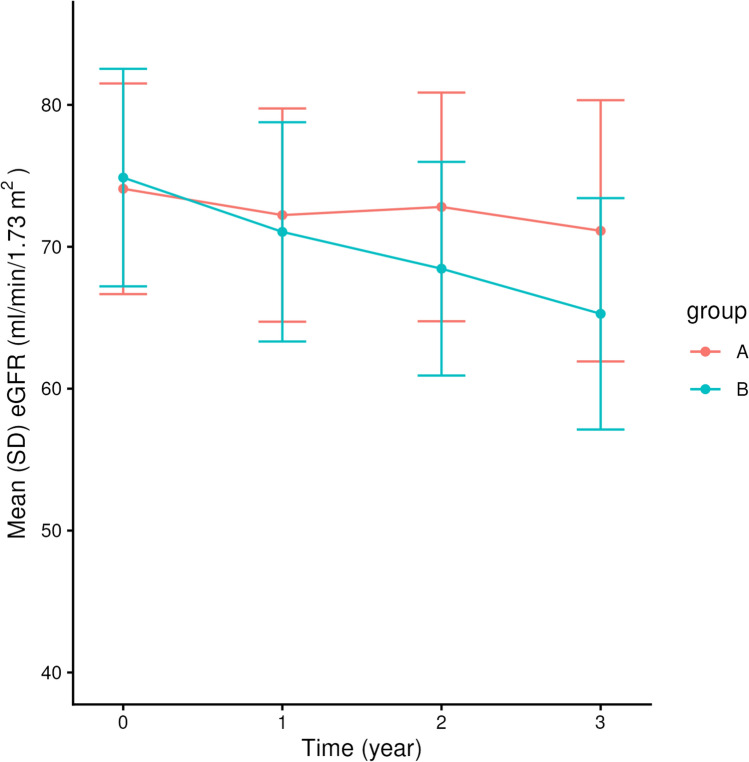 Figure 2
 Figure 3
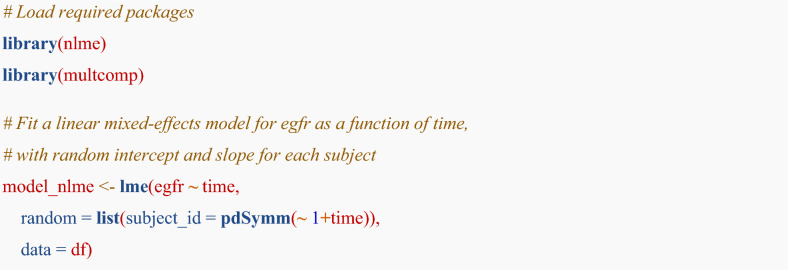 Figure 4
 Figure 5
 Figure 6
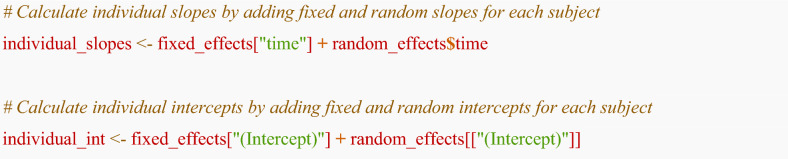 Figure 7
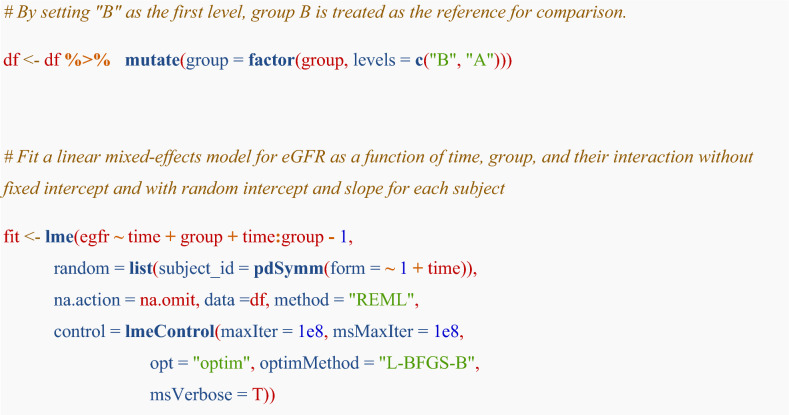 Figure 8
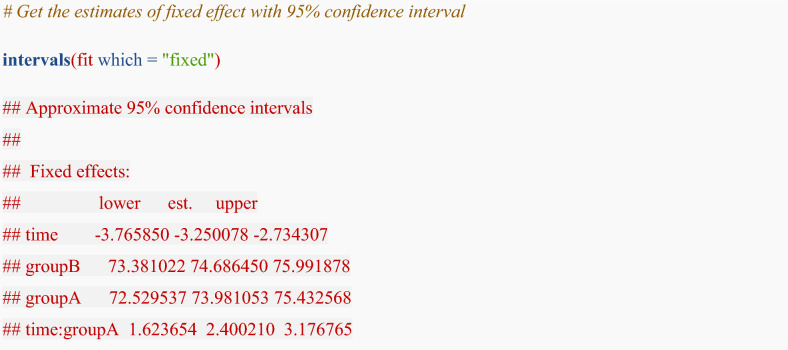 Figure 9
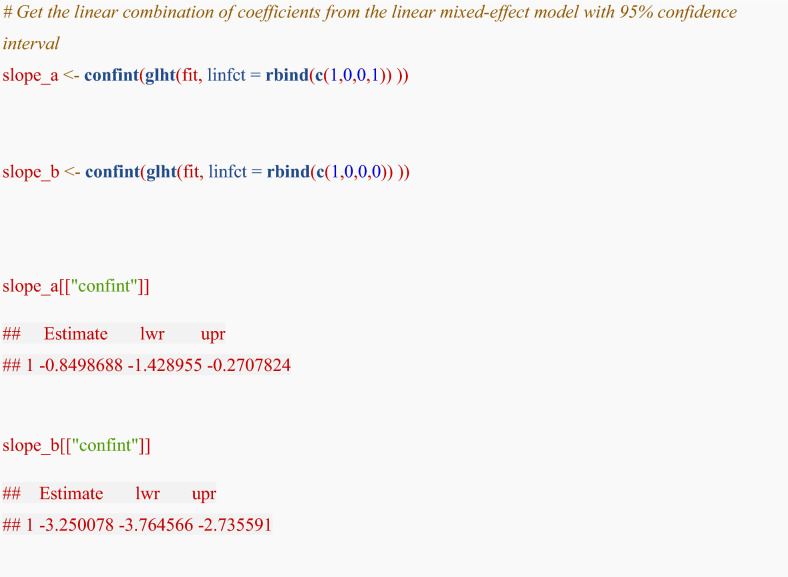 Figure 10
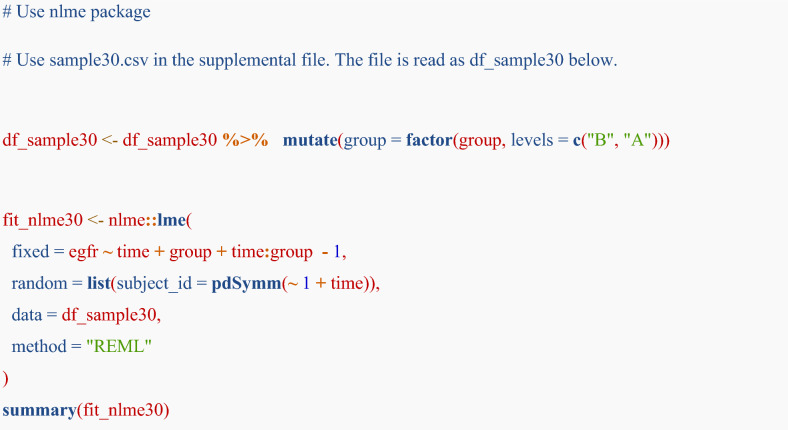 Figure 11
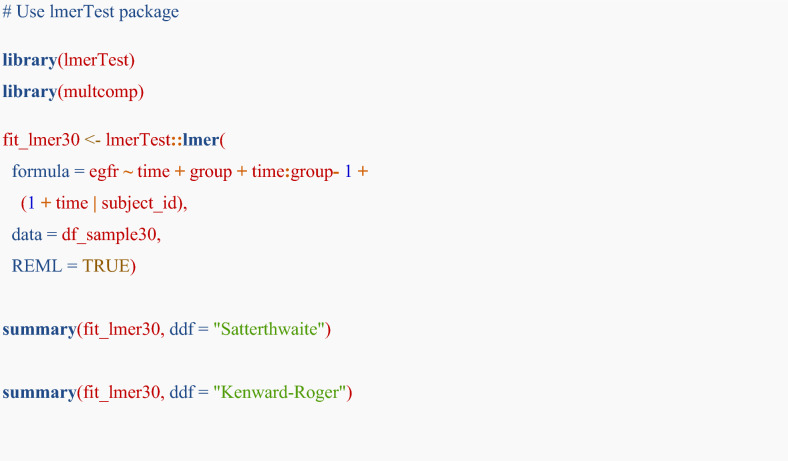 Figure 12
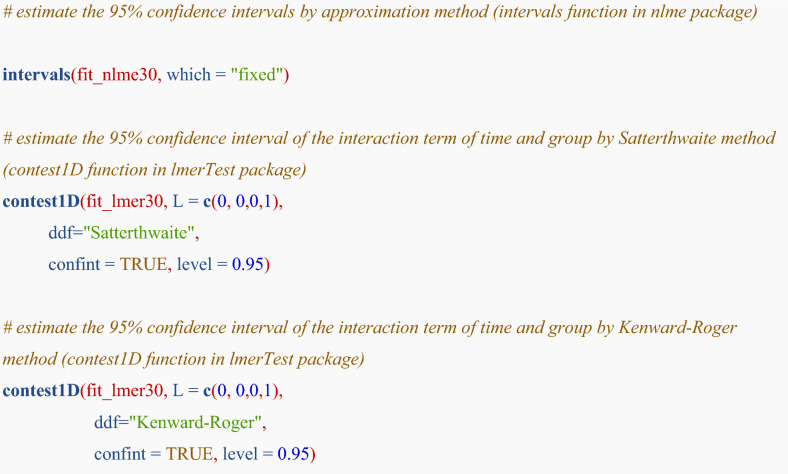 Figure 13
Peer Reviews
No public reviews on file for this paper yet. If you reviewed it on a platform where reviews are public (OpenReview, ICLR, NeurIPS, ICML), you can paste yours below so the community can read it here.
Videos
No videos yet. Explain this paper in a talk, walkthrough, or lecture? Add one.
Taxonomy
TopicsChronic Kidney Disease and Diabetes · Statistical Methods in Clinical Trials · Advanced Causal Inference Techniques