Injury incidence, determinants, and associated burden among children aged 0–17 years: a cross-sectional study in Henan Province, Central China
Bingyuan Wang, Wenjie Yang, Luwei Qin, Pan Pan, Tianfang Xing, Shaofang Li, Xiujuan Di, Zhiwei Han, Linqi Diao

TL;DR
This study examines injury rates and risk factors among children in Henan Province, China, highlighting the need for targeted prevention strategies.
Contribution
The study provides detailed provincial-level data on childhood injury epidemiology and determinants in Henan, China.
Findings
Boys had a significantly higher injury incidence rate (8.23%) compared to girls (5.32%).
Falls were the leading cause of injury, and home was the most common injury location.
Children cared for by grandparents had a higher injury risk compared to those cared for by their mothers.
Abstract
Childhood injury is a major public health issue in China, yet detailed provincial-level data are limited. This study aimed to investigate the epidemiology, determinants, and burden of injuries among children aged 0–17 years in Henan Province. A population-based cross-sectional survey was conducted from June 2022 to May 2023 using a multi-stage stratified cluster random sampling design. Data were collected via face-to-face questionnaires from guardians of 9,859 children aged 0–17 years. Complex sampling weights were applied, and Rao-Scott χ2 tests and logistic regression were used for analysis. The overall injury incidence rate was 6.88%, with a significantly higher rate in boys (8.23%) than in girls (5.32%). Multivariable logistic regression indicated that boys had higher odds of injury compared to girls (OR = 1.58, 95% CI: 1.27–1.97), and day students (returning home daily) had…
Genes, proteins, chemicals, diseases, species, mutations and cell lines named across the full text — each resolved to its canonical identifier and authoritative record.
Click any figure to enlarge with its caption.
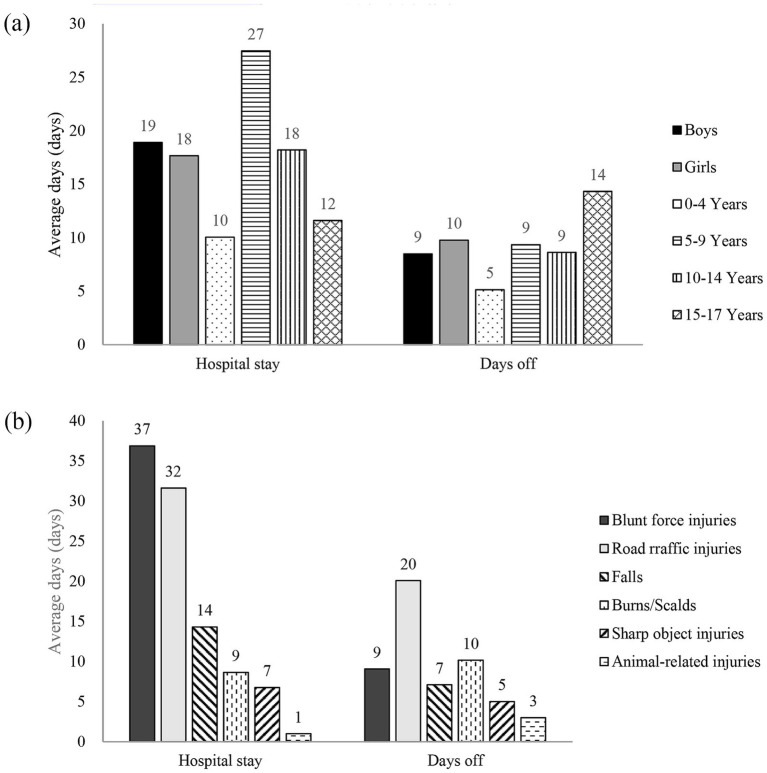 Figure 1
| Groups | No. of injured individuals | Injury incidence rate (%, weighted) | Rao-Scott | |
|---|---|---|---|---|
| Age (years) | 0.70 | 0.873 | ||
| 0–4 | 104 | 6.72 | ||
| 5–9 | 201 | 7.42 | ||
| 10–14 | 209 | 6.48 | ||
| 15–17 | 102 | 6.82 | ||
| Gender | 40.33 | <0.001 | ||
| Boys | 403 | 8.23 | ||
| Girls | 213 | 5.32 | ||
| Residence | 0.01 | 0.924 | ||
| Urban | 230 | 6.99 | ||
| Rural | 386 | 6.74 | ||
| Education level | 11.76 | 0.019 | ||
| Not enrolled | 51 | 4.94 | ||
| Kindergarten | 121 | 8.86 | ||
| Primary school | 241 | 6.55 | ||
| Middle school | 138 | 6.91 | ||
| High school or above | 65 | 6.71 | ||
| Total | 616 | 6.88 |
| Variables | Univariate analysis | Multivariate analysis | ||
|---|---|---|---|---|
| OR (95%CI) | OR (95%CI) | |||
| Age groups (years) | ||||
| 0–4 | 1 | — | — | — |
| 5–9 | 1.11 (0.84–1.48) | 0.394 | — | — |
| 10–14 | 0.96 (0.61–1.53) | 0.852 | — | — |
| 15–17 | 1.02 (0.74–1.40) | 0.908 | — | — |
| Gender | ||||
| Girls | 1 | — | 1 | |
| Boys | 1.60 (1.25–2.05) | 0.003 | 1.58 (1.27–1.97) | <0.001 |
| Ethnicity | ||||
| Han | 1 | — | — | — |
| Hui and others | 0.48 (0.03–8.85) | 0.571 | — | — |
| Education level | ||||
| Not enrolled | 1 | — | — | — |
| Kindergarten | 1.87 (1.30–2.69) | 0.005 | — | — |
| Primary school | 1.35 (1.21–1.51) | <0.001 | — | — |
| Middle school | 1.43 (1.00–2.04) | 0.049 | — | — |
| High school or above | 1.38 (0.93–2.05) | 0.092 | — | — |
| Boarding status | ||||
| Not enrolled | 1 | — | 1 | — |
| Boarding at school | 1.19 (0.79–1.79) | 0.362 | 1.19 (0.78–1.82) | 0.418 |
| Day student (returning home daily) | 1.70 (1.32–2.18) | 0.002 | 1.69 (1.16–2.46) | 0.007 |
| Father’s education | ||||
| Illiterate/semi-literate | 1 | — | — | — |
| Primary school | 2.09 (0.65–6.68) | 0.177 | — | — |
| Middle school | 1.53 (0.62–3.77) | 0.305 | — | — |
| High school | 2.21 (0.83–5.85) | 0.096 | — | — |
| College or above | 2.40 (0.84–6.84) | 0.090 | — | — |
| Unknown | 1.25 (0.71–2.20) | 0.382 | — | — |
| Mother’s education | ||||
| Illiterate/semi-literate | 1 | — | — | — |
| Primary school | 1.03 (0.51–2.09) | 0.923 | — | — |
| Middle school | 0.97 (0.64–1.47) | 0.858 | — | — |
| High school | 1.44 (0.65–3.21) | 0.317 | — | — |
| College or above | 1.45 (0.55–3.83) | 0.396 | — | — |
| Unknown | 1.15 (0.59–2.26) | 0.632 | — | — |
| Primary caregiver | ||||
| Mother | 1 | 1 | — | |
| Father | 1.40 (1.21–1.62) | 0.001 | 1.36 (0.91–2.03) | 0.140 |
| Grandparents | 1.33 (1.03–1.71) | 0.032 | 1.33 (1.06–1.67) | 0.013 |
| Other relatives | 0.94 (0.11–7.98) | 0.944 | 0.94 (0.25–3.56) | 0.932 |
| Others | 0.34 (0.08–1.50) | 0.129 | 0.35 (0.08–1.60) | 0.174 |
| Type of injury | Overall | Boys | Girls | 0–4 Years | 5–9 Years | 10–14 Years | 15–17 Years | |||||||
|---|---|---|---|---|---|---|---|---|---|---|---|---|---|---|
| Proportion | Injury event rate | Proportion | Injury event rate | Proportion | Injury event rate | Proportion | Injury event rate | Proportion | Injury event rate | Proportion | Injury event rate | Proportion | Injury event rate | |
| Falls | 53.90 | 3.86 | 55.39 | 4.78 | 51.18 | 2.80 | 63.82 | 4.46 | 51.73 | 4.08 | 52.05 | 3.47 | 47.56 | 3.30 |
| Animal-related injuries | 22.72 | 1.63 | 21.35 | 1.84 | 25.21 | 1.38 | 17.92 | 1.25 | 29.88 | 2.36 | 19.53 | 1.30 | 19.81 | 1.38 |
| Road traffic injuries | 10.30 | 0.74 | 8.65 | 0.75 | 13.28 | 0.73 | 4.15 | 0.29 | 7.18 | 0.57 | 16.14 | 1.08 | 15.27 | 1.06 |
| Blunt force injuries | 4.84 | 0.35 | 6.30 | 0.54 | 2.20 | 0.12 | 3.57 | 0.25 | 5.32 | 0.42 | 3.49 | 0.23 | 8.26 | 0.57 |
| Burns/scalds | 3.52 | 0.25 | 3.48 | 0.30 | 3.59 | 0.20 | 6.76 | 0.47 | 3.90 | 0.31 | 2.33 | 0.16 | 0.12 | 0.01 |
| Sharp object injuries | 2.67 | 0.19 | 3.53 | 0.30 | 1.11 | 0.06 | 2.23 | 0.16 | 1.81 | 0.14 | 2.94 | 0.20 | 4.77 | 0.33 |
| Other injuries | 2.05 | 0.15 | 1.30 | 0.11 | 3.43 | 0.19 | 1.55 | 0.11 | 0.18 | 0.01 | 3.52 | 0.23 | 4.21 | 0.29 |
| Total | 100 | 7.16 | 100 | 8.62 | 100 | 5.48 | 100 | 6.99 | 100 | 7.89 | 100 | 6.67 | 100 | 6.95 |
| Groups | Overall* | Boys* | Girls* | Rao-Scott | |
|---|---|---|---|---|---|
| Circumstances of injury occurrence | |||||
| Location of injury | 20.96 | <0.001 | |||
| Home | 812,469 (41.73) | 516,337 (41.13) | 296,133 (42.80) | ||
| School/kindergarten/childcare institution | 381,401 (19.59) | 285,618 (22.76) | 95,783 (13.84) | ||
| Road/street | 369,122 (18.96) | 200,608 (15.98) | 168,513 (24.36) | ||
| Public place | 220,805 (11.34) | 122,934 (9.79) | 97,871 (14.15) | ||
| Public residential area | 87,109 (4.47) | 66,000 (5.26) | 21,110 (3.05) | ||
| Other | 76,171 (3.91) | 63,747 (5.08) | 12,424 (1.80) | ||
| Activity at time of injury | 52.46 | <0.001 | |||
| Leisure activity | 1,154,656 (59.30) | 718,318 (57.22) | 436,338 (63.07) | ||
| Sports activity | 225,290 (11.57) | 186,101 (14.83) | 39,189 (5.67) | ||
| Riding/driving vehicle | 163,819 (8.41) | 71,868 (5.73) | 91,951 (13.29) | ||
| Walking | 146,794 (7.54) | 111,214 (8.86) | 35,580 (5.14) | ||
| Studying | 130,965 (6.73) | 91,044 (7.25) | 39,921 (5.77) | ||
| Essential daily activities (e.g., eating, sleeping) | 46,725 (2.40) | 26,945 (2.15) | 19,779 (2.86) | ||
| Housework | 28,850 (1.48) | 21,916 (1.75) | 6,934 (1.00) | ||
| Other | 49,979 (2.57) | 27,837 (2.21) | 22,141 (3.20) | ||
| Clinical characteristics of injuries | |||||
| Nature of injury | 19.47 | 0.007 | |||
| Contusion/abrasion | 729,099 (37.47) | 434,627 (34.62) | 294,472 (42.63) | ||
| Siting/bite/scratch | 429,587 (22.08) | 262,638 (20.92) | 166,949 (24.17) | ||
| Sprain/strain | 220,383 (11.32) | 144,258 (11.49) | 76,126 (11.02) | ||
| Sharp/open wound | 205,525 (10.56) | 172,609 (13.75) | 32,915 (4.77) | ||
| Fracture | 190,296 (9.78) | 138,349 (11.02) | 51,947 (7.52) | ||
| Burn/scald | 68,531 (3.52) | 43,718 (3.48) | 24,813 (3.59) | ||
| Joint dislocation | 25,265 (1.30) | 6,927 (0.55) | 18,338 (2.65) | ||
| Other | 77,318 (3.97) | 52,119 (4.15) | 25,199 (3.65) | ||
| Site of injury | 17.23 | 0.009 | |||
| Lower extremities | 733,724 (37.70) | 460,256 (36.67) | 273,468 (39.59) | ||
| Upper extremities | 594,298 (30.54) | 408,680 (32.56) | 185,617 (26.87) | ||
| Head | 410,615 (21.10) | 289,439 (23.06) | 121,177 (17.54) | ||
| Trunk | 126,388 (6.49) | 48,385 (3.85) | 78,002 (11.29) | ||
| Multiple sites | 36,835 (1.89) | 22,954 (1.83) | 13,880 (2.01) | ||
| Generalized | 12,801 (0.66) | 10,319 (0.82) | 2,482 (0.36) | ||
| Other | 31,342 (1.61) | 15,210 (1.21) | 16,133 (2.34) |
| Categories | Proportion (%, weighted) |
|---|---|
| Was a caregiver present at the time of injury? | |
| Yes | 54.17 |
| No | 44.78 |
| Other | 1.05 |
| Type of caregiver | |
| Adult | 97.56 |
| Minor | 1.73 |
| Unknown | 0.70 |
| Caregiver’s level of attention | |
| Present and closely supervising | 28.86 |
| Present but not attentive | 67.71 |
| Other | 0.50 |
| Unknown | 2.93 |
| Groups | Economic loss per case (CNY) | Out-of pocket cost per case (CNY) | Reimbursed amount per case (CNY) | Other patient-incurred costed per case (CNY)* | Other family-incurred costed per case (CNY)# |
|---|---|---|---|---|---|
| Overall | 2713.13 | 1817.02 | 188.03 | 261.48 | 450.44 |
| Gender | |||||
| Boys | 3087.20 | 2159.59 | 225.04 | 275.02 | 451.11 |
| Girls | 2027.81 | 1189.39 | 122.07 | 236.82 | 449.22 |
| Age groups (years) | |||||
| 0–4 | 1418.87 | 824.54 | 101.95 | 94.94 | 380.70 |
| 5–9 | 2569.00 | 1787.75 | 192.69 | 239.53 | 436.56 |
| 10–14 | 4162.94 | 2816.32 | 300.47 | 382.40 | 581.44 |
| 15–17 | 2580.40 | 1728.30 | 109.33 | 357.40 | 343.46 |
| Major injury type | |||||
| Falls | 1498.56 | 861.94 | 247.58 | 204.18 | 286.42 |
| Animal-related injury | 1598.58 | 1010.62 | 166.71 | 138.37 | 231.37 |
| Road-traffic injury | 8717.74 | 6543.59 | 60.41 | 609.82 | 1353.18 |
| Blunt force injury | 6902.45 | 5121.14 | 120.91 | 568.79 | 918.34 |
| Burns/scalds | 2929.51 | 1624.01 | 97.45 | 104.74 | 894.27 |
| Cuts/sharp object injury | 1121.98 | 714.36 | 87.13 | 170.95 | 177.64 |
Peer Reviews
No public reviews on file for this paper yet. If you reviewed it on a platform where reviews are public (OpenReview, ICLR, NeurIPS, ICML), you can paste yours below so the community can read it here.
Videos
No videos yet. Explain this paper in a talk, walkthrough, or lecture? Add one.
Taxonomy
TopicsInjury Epidemiology and Prevention · Trauma and Emergency Care Studies · Gun Ownership and Violence Research
Introduction
Injury remains a leading global cause of death and a major contributor to morbidity, long-term disability, and healthcare costs in children and adolescents (1–3). During the period from 2010 to 2021, injuries caused more than 4.4 million deaths worldwide on average each year, including over 300,000 deaths annually among children aged 0–14 years (4). Globally, economic losses attributable to injuries from 2015 to 2030 are estimated at approximately US$7.86 trillion. Low- and middle-income countries (LMICs) are anticipated to bear a disproportionate share of this burden, with projected losses nearly 50% greater than those in high-income countries (HICs) (5). As a developing country, China also faces significant challenges in childhood injury prevention. Since 1990, although the mortality rate and disability-adjusted life years (DALYs) due to childhood injuries in China have shown a declining trend, the overall incidence of childhood injuries has been increasing, and injury remains the primary cause of death for children aged 1–14 years (6–8). This suggested that although injury related mortality has declined, the occurrence itself remains a widespread challenge.
In response to this challenge and to safeguard healthy child development, China has prioritized childhood injury prevention at a national level. Key policy documents such as the “Healthy China 2030” blueprint and the “China Children’s Development Program (2021–2030)” explicitly call for reducing injury-related deaths and disabilities and strengthening corresponding prevention and intervention efforts (9, 10). However, translating these national goals into effective local action relies heavily on a thorough understanding of the specific situation on the ground.
Nevertheless, the research on the incidence, characteristics, and associated socioeconomic burden of childhood injuries was limited at the provincial level in China, particularly in Henan, which has a large population. This information gap hinders the development of precise and effective prevention strategies. Therefore, to provide a scientific basis for childhood injury prevention and control in Henan Province, this study utilizes data from the 2022–2023 Henan provincial resident injury survey. It aims to systematically describe and analyze the epidemiological characteristics, clinical profiles, and the multifaceted burden of injuries among children aged 0–17 years in the province, thereby offering evidence to inform targeted interventions.
Materials and methods
Study design and populations
This study was a population-based, cross-sectional study conducted in Henan Province, a central region of China. Participants were recruited using a multi-stage stratified cluster random sampling method from June to October 2023, and were asked to retrospectively report injury events that occurred the 12 months period from during June 1 of 2022 and May 31 of 2023. First, all counties (districts) in Henan Province were stratified into 8 strata based on urbanization rate (high/low), population size (high/low), and mortality rate (high/low), and 14 disease surveillance points (DSPs) were selected using stratified sampling. Second, with each DSP, 3 townships (streets/regimental units) were selected using probability proportional to size (PPS) systematic sampling. Third, from each selected township, 2 villages were selected using PPS systematic sampling. Fourth, within each selected village, one resident group (comprising at least 150 households) was chosen by simple random sampling. Finally, from each resident group, 125 household units were randomly selected using simple random sampling.
Based on this design, the minimum required sample size was 750 households per DSP (3 townships × 2 villages × 125 households), resulting in a provincial minimum of 10,500 households (14 DSPs × 750 households). To ensure representativeness, post-sampling adjustments were applied based on the gender ratio from the Seventh National Population Census of Henan Province. If a DSP failed to meet the gender ratio requirement, additional households were sequentially recruited from the remaining households in the corresponding resident group until the requirement was satisfied. Ultimately, we recruited 10,988 households, comprising a total of 39,300 participants with no age restrictions, and the questionnaire response rate was 98.18%, defined as the proportion of eligible sampled households that completed the survey.
Participants were excluded if they refused to answer the questionnaire or sign the informed consent form. The study protocol was reviewed and approved by the Medical Ethics Committee of the Henan Center for Disease Control and Prevention (Approval No.: 2023-KY-003-02). Written informed consent was obtained from all participants prior to the survey. For the present study, we included data from 9,859 children aged 0–17 years, following the definition of a child established by the United Nations Convention on the Rights of the Child (11).
Sample size calculation
The sample size was calculated using the formula recommended in the Guidelines for Conducing Community Surveys on Injuries and Violence: (12), where r is the expected injury incidence rate for this survey. This was set at 5.6%, based on the non-fatal injury incidence rate reported among residents of Jiangxi Province (13); n is the average number of persons per household. According to the 2020 population census data of Henan Province, the average urban resident household size was 3.24; f = 2, e = 3%, p = 1. Using the above parameter values, the calculated number of households required per stratum was approximately 160. Considering the three stratification factors-urban/rural residence (2 levels), gender (2 levels), and age (16 strata); the total minimum number of households for the survey was determined as: 160 × 2 × 2 × 16 = 10,240 households. Therefore, the sample size of this study was sufficient.
Baseline examination and data collection
A standardized questionnaire was developed based on the National Injury Surveillance System (NISS) of China (14) and Guidelines for Conducing Community Surveys on Injuries and Violence (12). The questionnaire comprised demographic information, household risk factors, injury occurrence, clinical details of injuries, and the burden of injuries. Trained professionals from disease prevention and control agencies conducted the surveys. Data on injury incidents among residents from June 1, 2022 to May 31, 2023, were collected through face-to-face questionnaire interviews, supplemented by a review of medical records from village clinics, township health centers, and emergency/outpatient departments of local hospitals, as well as health insurance claim information. Within each household, the senior or eldest female member present at the time of the interview was generally designated as the respondent. Whenever possible, the head of the household along with other available members were encouraged to be present to corroborate or elaborate on the provided information. In cases involving a child’s injury event, the respondent was specifically the primary caregiver, most often the mother.
Household members were presented with a comprehensive list of injury types-including falls, road traffic injuries, blunt force injuries, firearm injuries, sharp object injuries, burns or scalds, suffocation, drowning, poisoning, animal-related injuries, and sexual assault-and asked whether any such event had resulted in injury or death during the preceding year.
Injury definition and classification
Injury was defined according to the World Health Organization (WHO) and the China National Injury Surveillance System (NISS) as physical damage to the human body resulting from acute exposure to energy or a lack of a vital element (12, 14). For the purpose of this population-based survey, an operational case definition was adopted in accordance with the injury definition established by the Injury Prevention and Control Branch of the Chinese Medical Association (15, 16), an injury case was defined as meeting either of the following two criteria: (1) having received a medical diagnosis for the injury at a healthcare facility; or (2) having taken one or more days off from work, school, or usual activities due to the injury.
Injury types were classified according to the NISS framework and included: falls, road traffic injuries, blunt force injuries, sharp object injuries, animal-related injuries, burns/scalds, and other injuries (14). Injury intent was also categorized following NISS standards into four groups: unintentional, self-harm/suicide, intentional, and unclear (14).
Quality control
A standardized quality control protocol was implemented across all survey sites. The study protocol, manual, and questionnaire were uniformly specified. All investigators received centralized training and certification; eligible investigators held a background in public health or medicine, at least 1 year of epidemiological research experience, and familiarity with local dialects. Data were collected using an electronic questionnaire system with audio recording. Completed questionnaires and audio files were uploaded daily. County/district and municipal CDCs each randomly sampled 20% of electronic questionnaires for audio verification, identified errors were promptly corrected or re-investigated.
Statistical analysis
This study employed a multi-stage complex sampling design, and all analytical results were adjusted using weighting methods appropriate for complex survey designs. The complex sampling weights comprised the design weight, the non-response weight, and the post-stratification weight (17). The design weight was calculated as the product of the sampling weights from each stage. Upon completion of the survey, the non-response and post-stratification weights were computed based on the actual response rates and the demographic structure of the sample. The non-response weight for a household was defined as the total number of eligible individuals in the household divided by the total number who actually completed the personal questionnaire. The post-stratification weight was calculated by cross-classifying the sample with data from the Seventh National Population Census of Henan Province into strata defined by age group (18 categories), sex (2 categories), and urban–rural residence (2 categories).
Injury occurrence was evaluated using the injury incidence rate and the injury event rate. The injury incidence rate was calculated as the number of injured individuals divided by the total surveyed population, while the injury event rate was calculated as the total number of injury events divided by the total surveyed population. Weighted incidence of injuries in the children and different strata of children was calculated. Differences in proportions between groups were tested using the Rao-Scott chi-squared test for weighted incidence (18, 19). For the weighted incidence estimations and weighted logistic regression analyses, the STRATA, CLUSTER, and WEIGHT statements in survey procedure were used to produce provincial representative estimates. The burden of childhood injuries was assessed using indicators related to medical treatment, hospitalization, days off due to injury, and economic losses (20, 21).
All data cleaning and analyses were performed using SAS 9.4 (SAS Inst., Cary, NC, USA), Two-sided p < 0.05 was considered statistically significant.
Results
Overall injury incidence and distribution by demographic characteristics
A total of 9,859 children aged 0–17 years were surveyed, with an overall injury incidence rate of 6.88%. The injury incidence rate was significantly higher in boys (8.23%) than in girls (5.32%) (χ^2^ = 40.33, p < 0.001). Analysis by age group showed no statistically significant difference in injury incidence among children aged 0–4, 5–9, 10–14, and 15–17 years (p = 0.873). However, significant differences were observed by education level: kindergarten children had the highest injury incidence rate (8.86%), followed by middle school students (6.91%), high school or above students (6.71%), primary school students (6.55%), and children not enrolled in kindergarten/school who had the lowest rate (4.94%) (χ^2^ = 11.76, p = 0.019). No statistically significant difference was found between urban and rural children (p = 0.924) (Table 1).
Logistic regression analyses of factors associated with injury among children
Using the occurrence of injury as the outcome variable, a univariate logistic regression analysis was performed to identify factors associated with childhood injuries. Compared to girls, boys were at a higher risk of injury (OR = 1.60, 95% CI: 1.25–2.05, p = 0.003). Children attending kindergarten, primary, or middle school, showed elevated risk compared to non-enrolled children. Day students (those returning home daily) had a significantly higher injury risk compared to non-enrolled children (OR = 1.70, 95% CI: 1.32–2.81, p = 0.002). Regarding the primary caregiver, children whose primary caregiver was their father (OR = 1.40, 95% CI: 1.21–1.62, p = 0.001) or their grandparents (OR = 1.33, 95% CI: 1.03–1.71, p = 0.032) had a higher injury risk compared to those whose primary caregiver was their mother. Age, ethnicity, and the parental education showed no statistically significant association with injury occurrence (p > 0.05) (Table 2).
Variables identified as significant in the univariate analysis (gender, education level, boarding status, primary caregiver) were included in a multivariate logistic regression model. The results showed that boys remained a high-risk group for injury compared to girls (OR = 1.58, 95% CI: 1.27–1.97, p < 0.001). Day students (returning home daily) continued to have a higher injury risk compared to non-enrolled children (OR = 1.69, 95% CI: 1.16–2.46, p = 0.007). Children whose primary caregiver was their grandparents had a higher injury risk compared to those cared for primarily by their mother (OR = 1.33, 95% CI: 1.06–1.67, p = 0.013) (Table 2).
Distribution of major injury causes by gender and age groups
Overall, falls (3.86%), animal-related injuries (1.63%), and road traffic injuries (0.74%) were the top three causes of injuries among children aged 0–17 years in Henan Province, accounting for 86.92% of all injuries, with falls alone contributing 53.90%. This ranking was consistent across genders.
By age group, falls, animal-related injuries, and road traffic injuries remained the top three causes for children aged 5–9, 10–14, and 15–17 years, while in the 0–4 years group, burns/scalds (0.47%) replaced road traffic injuries as the third leading cause. Falls were the predominant cause across all age groups, with the highest proportion in children aged 0–4 years (63.82%) and the lowest in those aged 15–17 years (47.56%). Animal-related injuries peaked in the 5–9 years group (29.88%), road traffic injuries in the 10–14 years group (16.14%), and blunt force or sharp object injuries were most common among adolescents aged 15–17 years (Table 3).
Characteristics of childhood injuries by gender
The most common location for childhood injuries was at home (41.73%), followed by school/kindergarten/childcare institutions (19.59%), roads/streets (18.96%), public places (11.34%), public residential areas (4.47%), and other locations (3.91%). The distribution of injury locations differed significantly between boys and girls (χ^2^ = 20.96, p < 0.001). Leisure activities were the predominant associated circumstance (59.30%), with significant gender differences (χ^2^ = 52.46, p < 0.001) (Table 4).
Regarding clinical features, contusion/abrasion was the most common injury type (37.47%), followed by sting/bite/scratch (22.08%), sprain/strain (11.32%), sharp/open wound (10.56%), fracture (9.78%), burn/scald (3.52%), and joint dislocation (1.30%). The distribution of injury nature differed significantly between boys and girls (χ^2^ = 19.47, p = 0.007). The lower extremities were the most frequently injured body site (37.70%), followed by the upper extremities (30.54%), head (21.10%), trunk (6.49%), multiple sites (1.89%), and generalized injury (0.66%). Although the ranking of top three sites was identical for both genders, the overall distribution between boys and girls was statistically significant (χ^2^ = 17.23, p = 0.009) (Table 4).
Among injured children aged 0–17 years, unintentional injuries accounted for 98.96% of cases, followed by self-harm/suicide (0.22%), intentional injuries (0.37%), and injuries of unknown intent (0.45%) (data not shown in the table).
Supervision status at the time of childhood injury occurrence
Among children aged 0–17 years who were injured, a caregiver was present in 54.17% of cases, while no caregiver was present in 44.78%. When a caregiver was present, adults accounted for 97.56% of supervisors, and minors accounted for 1.73%. Notably, in 67.71% of cases where a caregiver was present, the caregiver was not closely monitoring the child’s activity; only 28.86% of caregivers were both present and attentively supervising the child at the time of injury (Table 5).
Hospitalization and days off due to injuries
Among children aged 0–17 years who sustained injuries, 82.60% received outpatient or emergency treatment, while 10.71% rested without seeking medical care due to minor injuries. The proportion hospitalized was 6.61, and 0.08% could not access medical care due to reasons such as the distance to healthcare facilities or financial constraints. The average length of hospital stay for childhood injuries was 18 days, and the average number of days off (rest) due to injury was 9 days, with variations by gender and age group.
Regarding specific injury types, blunt force injuries and road traffic injuries had the longest average hospital stays, exceeding 30 days (37 and 32 days, respectively). The average hospital stay for falls was 14 days, while for burns/scalds and cuts/sharp object injuries it was 9 and 7 days, respectively. Road traffic injuries also resulted in the highest average number of days off (20 days). This was followed by burns/scalds (10 days), blunt force injuries (9 days), falls (7 days), cuts/sharp object injuries (5 days), and animal-related injuries (3 days) (Figure 1).
Average hospital stay and days off due to injury by demographic group (a) and injury type (b). Data are presented as weighted mean days. “Hospital stay” refers to the average length of inpatient care following an injury; “days off” indicates the mean number of days of restricted activity or absence from regular routines due to injury. Values are stratified by sex, age group, and major injury type. All estimates were adjusted for the complex sampling design.
Economic loss due to childhood injuries
The average cost per injury case among children aged 0–17 years was 2,713.13 Chinese Yuan (CNY). The average cost for boys (3,087.20 CNY) was higher than that for girls (2,027.81 CNY). Across different age groups, children aged 10–14 years incurred the highest average cost per case (4,162.94 CNY), followed by the 15–17 age group (2,580.40 CNY), the 5–9 age group (2,569.00 CNY), and the 0–4 age group (1,418.87 CNY).
Among major injury types, road traffic injuries resulted in the highest average cost per case (8,717.74 CNY), followed by blunt force injuries (6,902.45 CNY), burns/scalds (2,929.51 CNY), animal-related injuries (1,598.58 CNY), and falls (1,498.56 CNY). Other details regarding economic losses are presented in Table 6.
Discussion
This population-based cross-sectional study during 2022–2023 suggested that the injury incidence rate among children aged 0–17 years in Henan province of China was 6.88%, and the injury event rate was 7.16%. Using the same injury diagnostic criteria and age-group classifications, our results are higher than those reported in previous surveys conducted in six other provinces in China (4.83%) (22). Henan has long been a major province for labor export in China, resulting in a substantial population of left-behind children and migrant children due to the mobility of their parents. Previous researches indicated that left-behind children have a significantly higher injury incidence rate compared to non-left-behind children (23, 24), which may be an important contributing factor to the higher overall childhood injury rate observed in Henan Province relative to other regions.
The injury incidence rate was significantly higher in boys than that in girls, with boys being at a high-risk group for injury compared to girls (OR = 1.58, 95% CI: 1.27–1.97, p < 0.001); this finding was consistent with previous studies (25, 26). The higher injury incidence observed in boys compared to girls may be associated with gender-based differences in activity levels and behavioral patterns. Boys generally engage in more active and risk-prone behaviors, which can increase their exposure to hazardous situations and elevate the likelihood of injury (26). Among children at different education levels, kindergarten children had the highest injury incidence rate (8.66%), and univariate logistic regression analysis indicated that compared to children not enrolled in kindergarten/school, those attending kindergarten were at a significantly higher risk of injury (OR = 1.87, 95% CI: 1.30–2.69, p = 0.005). This elevated risk may be attributed to the ongoing development of cognitive and motor skills in younger children, which can increase their susceptibility to injuries-such as falls or collisions during play (27).
Day students (those returning home daily) showed a significantly higher injury risk compared to children not enrolled in school (OR = 1.69, 95% CI: 1.16–2.46, p = 0.007). This may be related to their daily exposure to multiple environments-transitioning between home, school, and the community-which increases opportunities for injuries, especially during transportation or unstructured time outside supervised settings (28). This finding is supported by a large cross-sectional study of Canadian school-aged children (n = 20,076), which reported that regular active transportation to school over longer distances (approximately >1.6 km) was associated with a 52% higher risk of sustaining a commuting-related injury (OR = 1.52, 95% CI: 1.08–2.15), with evidence of a dose–response relationship. Furthermore, school-age children often engage in more peer-influenced and physically active behaviors, which may involve greater risk-taking without adequate adult oversight during commuting or after-school periods (29).
Children whose primary caregiver was their grandparents were at a higher injury risk compared to those primarily cared for by their mother. The elevated risk in grandparental care may be linked to differing supervisory attitudes. Studies from Hong Kong suggested that, unlike parental caregivers, grandparents who hold a fatalistic worldview and perceive domestic injuries as uncontrollable are likely to have a lower intention to engage in injury prevention practices (30, 31). The disparity in injury risk may also be attributed to differences in the quality of on-the-spot supervision. Furthermore, in Henan, a significant proportion of left-behind children are cared for by their grandparents, a group known to have a higher incidence of injuries compared to non-left-behind children (32–34). Our data reveal a crucial gap: although a caregiver was physically present in 54.17% of injury incidents, effective supervision-defined as close, constant, and undivided attention-was absent in 67.71% of those cases. This suggests that mere physical presence is insufficient. Evidence from a community-based cohort study in China indicates that children under exclusive grandmaternal care tend to have lower cognitive and social–emotional development scores (35). This suggests that grandparents may provide less cognitive stimulation and responsive engagement during supervision. Such a less interactive caregiving style might not only affect child development but also fail to effectively teach safety rules, monitor risk-taking behaviors in real-time, and thus prevent injuries, potentially explaining the elevated injury risk we observed.
Falls were identified as the most common type of childhood injury in this study, which consistent with prior researches (36, 37). This further underscores the importance of maintaining a strong focus on fall prevention within broader, comprehensive strategies for injury control. This study identified the home environment as the most common location for childhood injuries (41.73%), with leisure activities being the most frequently associated circumstance (59.30%). The predominant injury type was contusion/abrasion (37.47%), and the lower extremities were the most frequently injured body site (37.70%). This pattern of injury epidemiology is consistent with the findings from surveys conducted in six other provinces in China (22). The predominance of home as the injury location aligns with both domestic and international evidence, which shows the home environment as the primary setting for childhood injuries (38, 39). In addition, our results indicated that injuries are not merely random accidents but often occur during predictable routines of childhood development. Therefore, prevention strategies should aim to make these necessary and beneficial leisure activities safer, rather than merely restrictive. The consistency of this pattern across multiple provinces suggested (39) that it may represent a public health concern not uncommon in similar regional contexts, and the development and implementation of standardized, evidence-based home safety and active supervision programs should be considered.
The prolonged average hospital stay and substantial hospitalization costs quantified in this study underscore the health consequences and economic burden of childhood injuries, which consist with other studies (40, 41). This burden is not evenly distributed; injuries from mechanisms like road traffic crashes consistently incur the highest medical costs in this study. Therefore, preventing childhood injuries is not only crucial for health but also represents a cost-effective strategy from a health economics perspective.
This study has several limitations. First, it focused on obtaining the overall prevalence, influencing factors, and burden of injuries for 0–17 years children in Henan Province. Because the influencing factors differ significantly across different types of injuries, other factors and those influencing the occurrence of specific injury types were not investigated. Second, the proportion of injury-related disabilities and deaths in the survey was small. This is likely because such events involve psychological trauma for patients and their families, making effective detailed questionnaire surveys difficult. Therefore, the assessment of child injury-related mortality and disability was limited. Third, the use of an operational definition for injury events may have led to an underestimation of the true incidence. This could be due to minor injuries not receiving medical treatment, low healthcare-seeking rates among populations in economically disadvantaged or medically underserved areas, and reliance on informal medical care. Fourth, the retrospective survey design may be affected by recall bias, particularly for minor injuries or specific details such as associated costs. Additionally, injuries among older children and adolescents occurring outside the home may not have been fully captured, as such events were not always known to their caregivers.
Despite these limitations, this study provides the first population-based, provincially representative estimates of childhood injury incidence in Henan Province. The identification of high-risk groups (boys, school-aged children, day-time students, those in specific caregiving arrangements) and high-risk contexts (home, leisure time) allows for targeted interventions. Prevention programs should prioritize fall prevention, enhance home safety assessments, and promote active supervision during play. School-based safety education could be tailored differently for boys and girls based on their predominant injury patterns. Future research should move from descriptive epidemiology to intervention studies, testing the effectiveness of specific home-visit safety programs, community-based awareness campaigns, or school curriculum changes in the local context. Longitudinal studies are also needed to understand the long-term consequences of childhood injuries and to evaluate the sustainability of prevention efforts.
In conclusion, this study identified demographic risk factors, characterize the predominant injury profile, and quantify the associated health and economic costs or children 0–17 years in Henan province of China. This evidence underscores the necessity of moving from general awareness to targeted action. Effective prevention strategies should prioritize home safety interventions, promote supervision during unstructured play, and address the specific risks associated with caregiving by fathers and grandparents. Implementing such evidence-based, context-specific measures is essential to reduce the incidence of childhood injuries and mitigate their long-term impact on children’s health and development.
The reference list from the paper itself. Each links out to its DOI / PubMed record.
- 1Li C Jiao J Hua G Yundendorj G Liu S Yu H . Global burden of all cause-specific injuries among children and adolescents from 1990 to 2019: a prospective cohort study. Int J Surg. (2024) 110:2092–103. doi: 10.1097/JS 9.0000000000001131, 38348839 PMC 11020088 · doi ↗ · pubmed ↗
- 2Ward JL Azzopardi PS Francis KL Santelli JS Skirbekk V Sawyer SM . Global, regional, and national mortality among young people aged 10–24 years, 1950–2019: a systematic analysis for the global burden of disease study 2019. Lancet. (2021) 398:1593–618. doi: 10.1016/S 0140-6736(21)01546-4, 34755628 PMC 8576274 · doi ↗ · pubmed ↗
- 3Lee LK Porter JJ Mannix R Rees CA Schutzman SA Fleegler EW . Pediatric traumatic injury emergency department visits and management in US children’s hospitals from 2010 to 2019. Ann Emerg Med. (2022) 79:279–87. doi: 10.1016/j.annemergmed.2021.10.008, 34839942 · doi ↗ · pubmed ↗
- 4World Health Organization. Global Health estimates 2021: deaths by cause, age, sex, by country and by region, 2000–2021. (2024). Available online at: https://www.who.int/data/gho/data/themes/mortality-and-global-health-estimates/ghe-leading-causes-of-death (Accessed May 28, 2025)
- 5Graham SM Chokotho L Mkandawire N Laubscher M Maqungo S Haonga B . Injury: a neglected global health challenge in low-income and middle-income countries. Lancet Glob Health. (2025) 13:e 613–5. doi: 10.1016/S 2214-109X(25)00074-940155097 · doi ↗ · pubmed ↗
- 6Institute for Health Metrics and Evaluation Global burden of disease data visualizations. (2015). Available online at: http://vizhub.healthdata.org/gbd-compare (Accessed April 25, 2025)
- 7Ye PP Jin Y Duan LL. Trends of injury mortality among children in different stages of the China children’s development outlines. Zhonghua Liu Xing Bing Xue Za Zhi. (2019) 40:1356–62. doi: 10.3760/cma.j.issn.0254-6450.2019.11.00431838804 · doi ↗ · pubmed ↗
- 8Leilei D Pengpeng Y Haagsma JA Ye J Yuan W Yuliang E . The burden of injury in China, 1990-2017: findings from the global burden of disease study 2017. Lancet Public Health. (2019) 4:e 449–61. doi: 10.1016/S 2468-2667(19)30125-2, 31493842 PMC 6739690 · doi ↗ · pubmed ↗