CAZome comparison in relation to host plant for selected Sordariomycete and Dothidiomycete plant pathogenic fungi
Hazal Kandemir, Mao Peng, Max Koster, Johannes Z. Groenewald, Pedro W. Crous, Andrei S. Steindorff, Ronald P. de Vries

TL;DR
This study compares the enzyme sets of fungi that break down plant cell walls, finding that these enzymes evolve separately from the rest of the genome and adapt to specific host plants.
Contribution
The study reveals that CAZome evolution in plant pathogenic fungi is driven by host plant adaptation rather than phylogenetic relationships.
Findings
CAZy content in fungi does not correlate with genome-based phylogeny.
Adaptation to host plant polysaccharides is evident, with signs of parallel evolution.
Intergeneric variation in CAZome is more prominent than intrageneric diversity.
Abstract
While most studies focus on the effectors involved in plant infection, another important aspect is the degradation of the plant cell wall, as this is the main physical barrier protecting the plant from pathogens. The plant cell wall mainly consists of polysaccharides, proteins and the aromatic polymer lignin, but the type of polysaccharide differs significantly between plant types, species and tissues. It can therefore be expected that pathogens of specific plants have evolved to produce those plant polysaccharide degrading enzymes that match the polysaccharides in the cell wall of their host plant. In this study, we compared the plant polysaccharide degradation potential of 56 Dothideomycetes and 42 Sordariomycetes species to identify evolutionary patterns related to either host plant or phylogenomic classification of the fungal species. Our results show that the CAZy content of…
Genes, proteins, chemicals, diseases, species, mutations and cell lines named across the full text — each resolved to its canonical identifier and authoritative record.
Click any figure to enlarge with its caption.
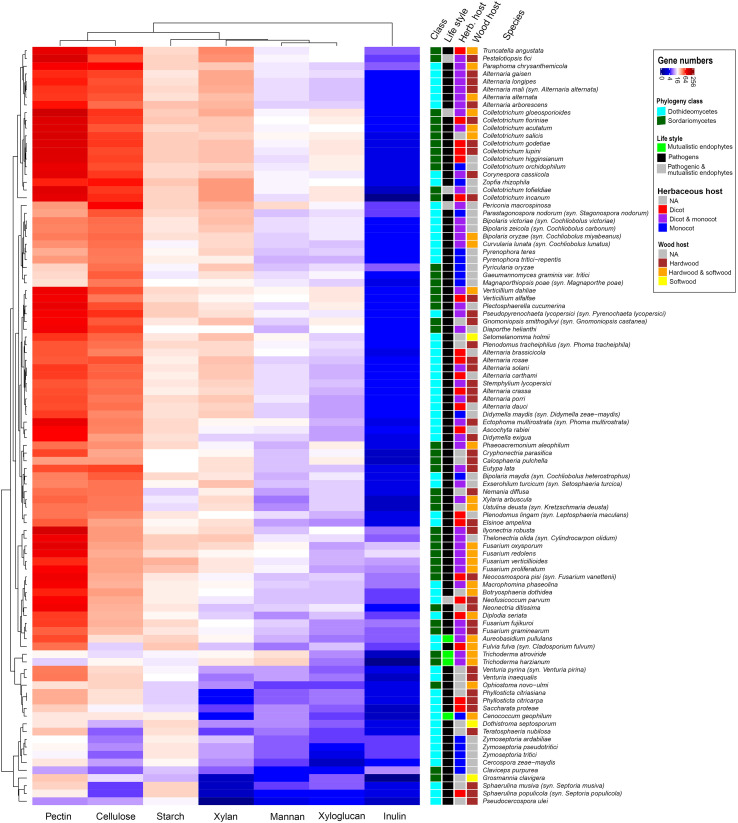 Figure 1
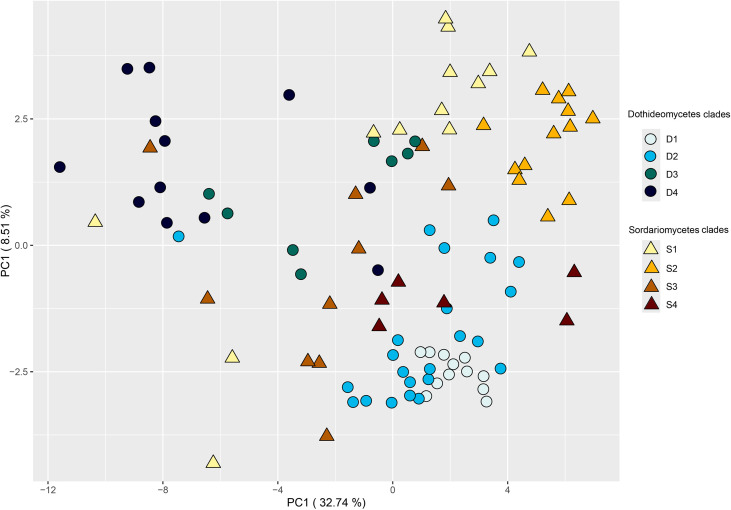 Figure 2
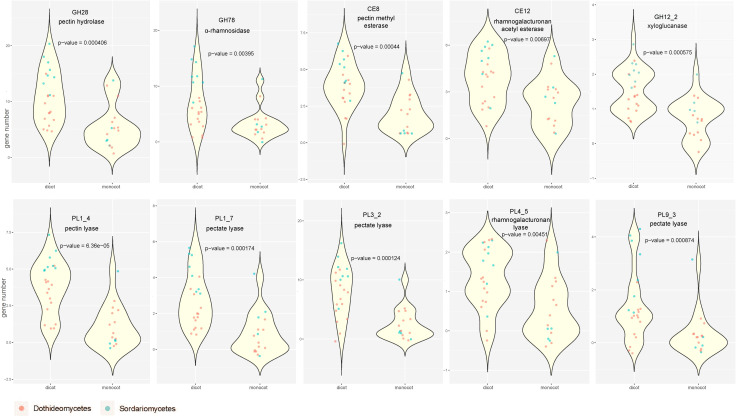 Figure 3
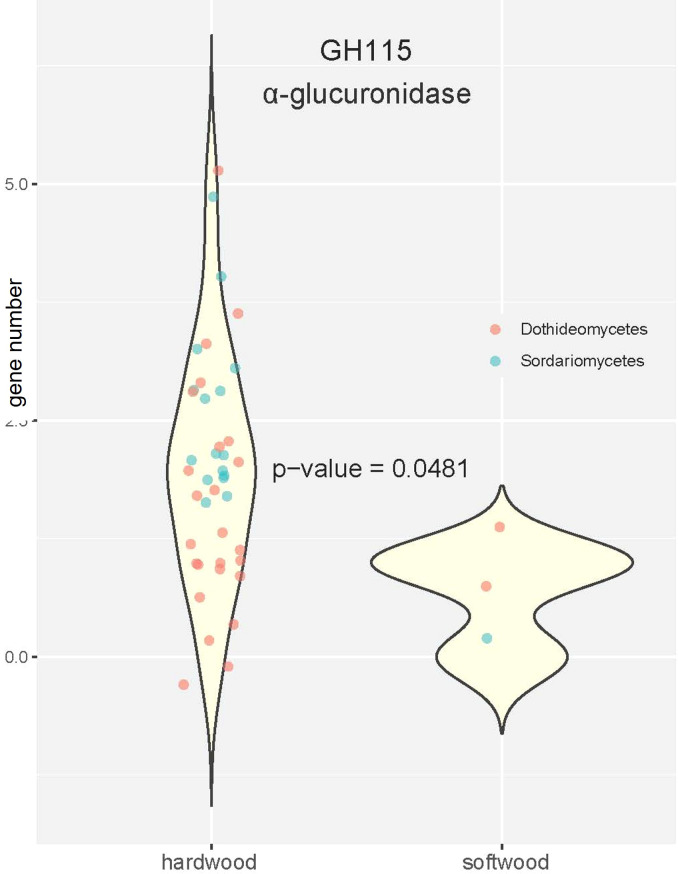 Figure 4
| Plant type | Main cell wall polysaccharides | Minor cell wall polysaccharides |
|---|---|---|
| Monocots | Cellulose, arabinoxylan | |
| Dicots | Cellulose, pectin, xyloglucan | Xylan, (galacto-) mannan |
| Hardwood | Cellulose, glucuronoxylan | Galactomannan, pectin |
| Softwood | Cellulose, galactomannan | Glucuronoxylan, pectin |
Peer Reviews
No public reviews on file for this paper yet. If you reviewed it on a platform where reviews are public (OpenReview, ICLR, NeurIPS, ICML), you can paste yours below so the community can read it here.
Videos
No videos yet. Explain this paper in a talk, walkthrough, or lecture? Add one.
Taxonomy
TopicsPlant-Microbe Interactions and Immunity · Fungal and yeast genetics research · Plant Pathogens and Fungal Diseases
Introduction
1
Plant pathogenic fungi have a significant impact on crop production and global food supply. They threaten global food security, causing major pre- and post-harvest crop losses, and affect all plant species on Earth (Savary et al., 2012).
While some plant pathogenic fungi are highly specific to a single plant species or group, others can cause diseases across a wide range of plants, demonstrating different abilities to adapt to the plant structure and defense mechanisms. These adaptations are closely related to the plant cell wall composition since the plant cell wall is the first physical barrier that fungi must overcome to cause infection. It is also a major source of carbon for fungi with its polysaccharide components (several hemicelluloses, cellulose, and pectin). The relative amounts and detailed structures of these polysaccharides differ per plant species and tissues (Benatti et al., 2012). Moreover, major differences in cell wall structure can be identified between monocots and dicots and between hardwood and softwood plant hosts (Table 1).
Fungi use carbohydrate active enzymes to degrade complex polysaccharides in the plant cell wall and biosynthesize or modify various carbohydrates. These enzymes have been catalogued in the Carbohydrate Active enzyme (CAZy) database (www.cazy.org) (Drula et al., 2022) in amino acid sequence-based families and subfamilies. This system allows an efficient evaluation of the genomic ability of a fungus to degrade complex substrates by analyzing the number of genes belonging to CAZy families associated with the degradation of a specific polysaccharide. Combining this analysis with growth profiling of plant biomass-based polysaccharides demonstrated that fungal genomes are often enriched in enzymes acting on the plant cell wall polysaccharides they typically encounter in their biotope. Two examples of this are the dung fungus Podospora anserina and the plant pathogenic fungus Botrytis cinerea. The genome of P. anserina has a strongly increased set of genes encoding cellulases and xylanases and a reduced set of pectinases, which matches the recalcitrant polysaccharides present in herbivore dung. It is supported by good growth of this species on xylan and cellulose and poor growth on pectin (Espagne et al., 2008). In contrast, B. cinerea shows good growth on pectin as well as an increased number of pectinase-encoding genes in its genome, matching the high pectin content in several of its host plants, such as tomato and strawberry (Amselem et al., 2011). The ability to degrade or alter specific carbon sources is therefore a beneficial trait for fungi, allowing them to compete and survive in their habitats. Therefore, fungal CAZy profiles provide information on the ecological capacity of fungi. They are particularly important in plant-associated fungi for establishing a link between their lifestyles and host ranges (Molina et al., 2024).
Most research on plant pathogenic fungi focuses on effector molecules and genes/proteins involved in or affecting the infection process, while fungal CAZy have been studied in terms of their defensive roles in fungal diseases in plants (Mafa et al., 2023) and habitat adaptation of fungi (Barrett et al., 2020; Baroncelli et al., 2024). These studies consisted of closely related plant pathogenic species with similar lifestyles across different hosts. However, there is limited data on whether phylogeny correlates with CAZy profiles at higher taxonomic levels in these fungi, and no definite answer on how to evaluate plant cell wall and fungal CAZy profiles together in plant pathogenic fungi. Studies have been performed within sets of Dothideomycetes (Ohm et al., 2012; Haridas et al., 2020) and sets of Sordariomycetes (Ledo Doval et al., 2025) which included comparisons of CAZy content of the respective genomes. However, no studies thus far evaluated whether species of these two fungal groups that infect the same host plants have similar CAZy profiles. In this study, we investigated the relationship between CAZy profiles of selected plant pathogenic Dothideomycetes and Sordariomycetes fungi, and related this to their taxonomic relationships as well as their host plant types.
Methodology
2
Selection of fungal genomes and phylogenetic analysis
2.1
In total, 98 fungal genomes of 56 species from Dothideomycetes and 42 species from Sordariomycetes were selected from the Joint Genome Institute (JGI) MycoCosm database (Grigoriev et al., 2014) based on the lifestyles (pathogens, latent pathogens, and endophytes) of the fungal species (Supplementary Table 1). Using the GenBank, USDA, and MycoCosm databases, reported host information has been recorded (last accessed October 10th, 2025). This information included the host plant name and plant type (dicot, monocot, hardwood, or softwood). All but three of the species have published genomes (see Supplementary Table 1 for references), while for the other three, permissions were obtained from the data owners. The current names of the species were validated through the Index Fungorum and MycoBank databases.
Orthologous groups of 98 species were identified using OrthoFinder v2.5.5.2 (Emms and Kelly, 2019). A total of 165 single-copy orthologs were aligned independently using MAFFT v7.427 (Katoh and Standley, 2013) (option –maxiterate 1000). A maximum likelihood phylogeny from the concatenated amino acid alignments of the single-copy orthogroups was constructed with 1000 fast bootstrap replicates and selecting the best amino acid model for each gene partition using iqtree v3.0.0 (Wong et al., 2025) (options -m MFP -bb 1000 -safe). The phylogenetic tree was rooted to the midpoint and visualized using FigTree v1.4.4 (Girio et al., 2010).
The single-copy orthologs were identified in all genomes using OrthoFinder (Emms and Kelly, 2019). Reference protein sequences for each strain were obtained from the CAZy database (Drula et al., 2022) and aligned using Clustal Omega (Madeira et al., 2022).
CAZy annotation and statistical analysis
2.2
Gene copy data for the relevant CAZy were obtained from the JGI MycoCosm database (Emms and Kelly, 2019), which includes annotation of their CAZy content according to the CAZy annotation pipeline (Espagne et al., 2008), and exported via its Application Programming Interface (API). From these annotations, the numbers of genes were extracted in families that can be specifically assigned to degradation of either cellulose, xylan, mannan, xyloglucan, pectin, starch or inulin (Supplementary Table 2) based on previously published plant cell wall composition data (Vogel, 2008; Girio et al., 2010). Only families that could be assigned to specific polysaccharides were included in the analysis, while the families with activities against multiple polysaccharides (e.g., GH2, GH3) were excluded to allow a more specific comparison of the degradation potential for specific polysaccharides. In total, 59 CAZy families from four different CAZy groups (Auxiliary Activities (AA), n=3; Carbohydrate Esterases (CE), n= 3; Glycoside Hydrolases (GH), n=39; and Polysaccharide Lyases (PL), n=14) were included in the study (Supplementary Table 1). The CAZy families were divided into subfamilies and integrated into the dataset based on their substrates, except for the β-glucosidases of GH2. The β-glucosidases were split into extra- and intracellular enzymes using SignalP v5.0 (Nielsen et al., 1997).
Statistical comparison of CAZy content between different pathogen groups were performed with R (v 4.5.2) software. The p-value was calculated by non-parametric rank test using the default R function wilcox.test(). The principal component analysis was performed with R package “FactoMineR” and visualized with “ggplot2” package. Heatmap was drawn with R package “ComplexHeatmap”, using the default clustering parameters (“euclidean distance” and “complete clustering”).
Results
3
Differences in CAZome profiles are only partially based on taxonomic relationships of the fungal species
3.1
This study includes 56 Dothideomycetes (34 genera) and 42 Sordariomycetes (26 genera), which are mainly plant pathogenic fungi, but also four mutualistic endophytes and five species that can be found as both pathogen and mutualistic endophyte in different plants (Supplementary Table 1). The pathogens of both classes cover a wide range of host plants, including mono- and dicots, as well as hard- and softwoods (Supplementary Table 1). The clustered heatmap of the gene numbers related to the different polysaccharides revealed similarities between species from the two classes with similar host plants (Figure 1). This was particularly clear for a subgroup consisting of three Sordariomycetes (Magnaporthiopsis poae, Pyricularia oryzae, Gaeumannomyces graminis) and eight Dothideomycetes (Pyrenophora tritici-repentis, Pyrenophora teres, Curvularia lunata, Bipolaris oryzae, Bipolaris zeicola, Bipolaris victoriae, Parastagonospora nodorum, Periconia macrospinosa). All these species are associated with monocots and all show a strong reduction in putative pectinases (Figure 1), which matches the low pectin content of monocots.
Clustered heatmap revealing similarity on overall CAZome content of fungal species related to the degradation of specific plant polysaccharides.
When the number of genes relating to degradation of plant polysaccharides was plotted on the genome-based phylogenetic tree (Supplementary Figure 1), this revealed that in most cases, closely related species had similar CAZy profiles. However, a large diversity, in terms of variation in gene copy numbers, was observed in both fungal classes, also within the four main branches of the genome-based phylogenetic tree of each class (denoted as D1–D4 and S1–S4 in Supplementary Figure 1). This already indicates that the CAZome of these species has evolved separately from the overall genome. A principal component analysis (PCA) of the CAZome content revealed differences in species diversity of these branches (Figure 2). Species from branches D1 and S2 clustered closely, while species from the other branches showed a more diverse distribution. This is likely due to D1 consisting only of Alternaria species and S2 mainly of Colletotrichum species, while the other branches contain a broader range of genera. It therefore indicates relatively low diversity of the CAZome within a genus, while the diversity between genera (even if they are closely related) is much higher.
PCA plot of the CAZome content of the fungi of this study. The clades refer to the branches identified in the genome-based phylogenetic tree (Supplementary Figure 1).
Host plant adaptation in CAZome content is apparent when evaluating specific CAZy families
3.2
Analysis of the variation within specific CAZy families confirms the low diversity within several genera (e.g., Alternaria, Bipolaris, Colletotrichum, and Fusarium), as species from these genera cluster together in a heatmap based on the number of genes per individual CAZy family (Supplementary Figure 2). According to the data presented in Supplementary Figure 2, Supplementary Table 1, not all genera with low CAZy diversity revealed a clear link between low CAZome diversity and specific host categories. For example, Bipolaris maydis is associated only with monocots, whereas all other Bipolaris species in our dataset were reported from multiple host types; yet these fungi clustered together based on their CAZome content. On the other hand, in Fusarium, F. fujikuroi and F. graminearum have been reported from monocots, dicots, and softwoods, and they clustered separately from the other Fusarium species, which have been reported from all four host plant types. In Alternaria, the species related to three or more host types, except A. solani and A. porri, clustered separately from other Alternaria species related to one or two host types (Supplementary Figure 2). Similar to the clustering based on overall genes involved in a specific polysaccharide, no taxonomic distinction was visible when the clustering was based on the individual CAZy families. This demonstrates that similar CAZy content was present in both Dothideomycetes and Sordariomycetes, suggesting an evolutionary development for CAZy genes that is different from the genome as a whole.
This pattern becomes even more apparent when the number of genes is compared between fungi that have monocots or dicots, respectively, as host plants. A major difference in the cell wall composition of monocots and dicots is the presence of pectin, which is zero to low in monocots, while it is high in most dicots. When the number of genes in pectin-related CAZy families was compared between dicot and monocot-specific plant pathogens (see Supplementary Table 1 for details) using violin plots (Figure 3), a clear increase in pectinolytic genes was observed for dicot pathogens for most pectin-specific CAZy families. More detailed comparison showed that most of these pectinolytic genes expanded in dicot pathogens of both Sordariomycete and Dothideomycetes, except that GH78 and PL4_5 only significantly (P-value < 0.05) increased in Sordariomycete (Supplementary Figure 3).
Violin plots comparing the number of genes in 10 pectin-related CAZy families between monocot and dicot pathogens. The p-values were calculated with Wilcoxon rank test based on genes in pathogens uniquely attacking herbaceous monocot and dicot plants.
In contrast, no clear differences in pathogens of softwood or hardwood could be found, with the exception of CAZy family GH115 (Figure 4). This family contains α-glucuronidases that remove (4-O-methyl)-D-glucuronoyl residues from xylan. The main hemicellulose in hardwood is glucuronoxylan, while it is galactomannan in softwood (Vogel, 2008), suggesting that the expansion of this family could be an adaptation to the cell wall composition of hardwood pathogens. However, there may be a possible bias in our analysis caused by small size of softwood pathogens in our statistical comparison. Therefore, the detailed function of α-glucuronidases for hardwood pathogens requires further examination.
Violin plots comparing the number of genes in the α-glucuronidase containing GH115 family. The p-value was calculated with Wilcoxon rank test based on copies of GH115 genes in pathogens uniquely attacking softwood and hardwood.
A broad host plant range does not consistently result in a larger CAZy gene set
3.3
In the current study, Dothideomycetes were associated with 85 plant species, whereas Sordariomycetes were reported from 82 plant species. Among those, 48 were common in two classes (Supplementary Table 1). Higher variability in host plant preference did in general not correlate with higher CAZy numbers in the genomes of these species. Only Fulvia fulva and Macrophomina phaseolina had a higher total number of CAZy copies and broader host ranges than other taxa in Dothideomycetes (Figure 1; Supplementary Table 1). This link was not detected across other fungal groups and in some cases; species that are associated with fewer plant types had more CAZy gene copies (e.g., among Alternaria, Bipolaris, and Fusarium species) (Figure 1; Supplementary Table 1). Interestingly, some monocot and wood associated fungi had an overall reduction in CAZy genes (Figure 1, bottom clade). This could indicate that these species use other wood components as a carbon source or that they produce very high levels of the few enzymes they possess. The latter strategy is well described for Trichoderma reesei, which is a very efficient cellulose degrader despite having a modest set of cellulolytic genes in its genome (Martinez et al., 2008). It contrasts to other good cellulose degraders, such as Podospora anserina, which possesses a highly expanded set of cellulolytic genes (Espagne et al., 2008).
Discussion
4
In this study, we investigated whether the CAZome composition of a set of Dothideomycetes and Sordariomycetes plant pathogens correlates with the polysaccharide composition of the cell wall of their host plants. The plant cell wall is a physical barrier that pathogens need to overcome, and its composition differs significantly in different plant types (Vogel, 2008; Benatti et al., 2012). Therefore, it is conceivable that adaptation of fungi to their host plant would include genomic evolution towards a set of enzymes tailored towards the prevalent polysaccharides in the host cell wall. This would then suggest that distantly related fungi with the same host plant would have more similar CAZomes than closely related fungi with different host plants. Alternatively, if the evolution of these species did not include adaptive alterations in their CAZome, the similarity in their CAZome would decrease with increasing taxonomic distance. Our study demonstrated that CAZomes evolve partially based on adaptation, as clustering of the fungal species based on their CAZy gene composition (Figures 1, 2; Supplementary Figure 2) does not match their genome-based phylogeny (Supplementary Figure 1). In fact, in several cases Dothideomycetes and Sordariomycetes fungi cluster together, despite their taxonomic distance. Previous studies comparing 18 (Ohm et al., 2012) and 101 (Haridas et al., 2020) Dothideomycetes also indicated that, within this fungal class, the differences in CAZome composition did not correlate with the taxonomic distance of the species, and suggested adaptation to life style (saprobe or pathogen) and host plant (for pathogens). Similarly, a study comparing nine Sordariomycetes fungi showed no correlation between the difference in CAZome and their taxonomic distance (Ledo Doval et al., 2025).
Interestingly, this absence of correlation is mainly observed at the genus level, while species within the genus have largely similar CAZomes, suggesting that these adaptations are mostly not recent. In our study, we saw close clustering of multiple species of Zymoseptoria (n=3;clade D4), Sphaerulina (n=2; clade D4), Phyllosticta (n=2; clade D3), Trichoderma (n=2; clade S1), Venturia (n=2; clade D3), Fusarium (n=6; clade S1), Verticillium (n=2; clade S2), Pyrenophora (n=2; clade D2), Magnaporthiopsis/Pyricularia (n=2; clade S3), Bipolaris (n=3; clade D2), Colletotrichum (n=10; clade S2) and Alternaria (n=11; clade D1) based on the number of genes in individual CAZy families (Supplementary Figure 2). This similarity is maintained when the clustering was based on the number of genes related to a specific polysaccharide (Figure 1), except for Alternaria, where the species are split into two groups of seven and four species each.
Similarity of CAZomes within fungal genera has been reported before for Colletotrichum (Baroncelli et al., 2024), but differential gene expression of CAZy genes suggested that the adaptation within the genus may be largely at the post-genomic level. This is consistent with studies in the genus Aspergillus where the CAZome similarity was high within each section (Vesth et al., 2018; Theobald et al., 2024; Nybo et al., 2025; Theobald et al., 2025), with more variation between the sections, likely due to the taxonomic breadth of this genus. Functional studies demonstrated that within each section, variation between the species could be observed in secreted protein profiles (Meijer et al., 2011; Benoit et al., 2015; Mäkelä et al., 2018), suggesting that also in this genus, recent adaptations are predominantly at the level of gene expression rather than in genome content.
However, the diversity in CAZomes can only be partially linked to the host plant cell wall composition. The clustering of subsets of Sordariomycetes and Dothideomycetes species based on their CAZome suggests parallel evolution in species of these two fungal classes, but only in some cases the clustered species attack a similar host plant. The clearest example of parallel evolution of CAZomes was observed in three Sordariomycetes (Pyricularia oryzae, Gaeumannomyces graminis var. tritici, and Magnoporthiopsis poae) and two Dothideomycetes (Pyrenophora teres and P. tritici-repentis) monocot pathogens that all showed a significant reduction of pectin-related CAZy genes (Figure 1). We should however consider that many of the species included in our study can attack multiple hosts, often including both monocots and dicots (Supplementary Table 1), widening the range of cell wall polysaccharides they would be expected to degrade. In addition, as mentioned above, genome content is only part of the story. Adaptations also occur at the post-genomic level and especially if species have more recently expanded or reduced their host plant range, this may be more at the level of gene expression profiles than genome content.
In our dataset, some hemibiotrophic fungi (e.g., Colletotrichum species) showed CAZy content similar to or higher than that of most necrotrophic fungi, such as Fusarium, Alternaria, and Curvularia species. One necrotrophic fungus, Grosmannia clavigera, had the lowest CAZy content. This indicates that the functional relevance of CAZome may be species-dependent rather than solely attributable to the lifestyle of the species.
The results show that taxonomically distant fungi that infect similar host plants can have similar CAZy profiles, indicating that these enzyme sets may have evolved independently during the evolution of these fungi. Therefore, sharing a host can lead to the presence of similar CAZy families across different fungi. However, in some taxa, regardless of their phylogenetic closeness, the CAZy profile showed differences even though they infect the same plant types. This suggests that these fungi may target different components of the cell wall and/or use different enzymes to degrade the same plant polysaccharide.
Conclusions
5
We evaluated the evolution of the CAZome of a large set of Dothideomycetes and Sordariomycetes plant pathogenic fungi. The absence of correlation between the clustering of the species based on their CAZome and their genome-based phylogeny indicated that the CAZy content of these species has evolved separately from their overall genome. Overall comparison of the Dothideomycetes and Sordariomycetes species used in this study suggests that the evolution of the CAZy content followed both lineage-specific and plant-host-specific evolutionary patterns.
It should be noted that the results of this study indicate the “potential” of the selected plant pathogenic fungi for degradation of plant polysaccharides and have not yet taken into account the expression of these genes during plant infection. Gene expression can vary significantly, even among closely related species, as previously reported for Aspergillus and Colletotrichum (De Vries et al., 2017; Mäkelä et al., 2018; Baroncelli et al., 2024), and appears to be the initial adaptation of the species in their polysaccharide degradation approach. Future studies into the transcriptomic profile of a large set of plant pathogenic fungi during plant infection would provide additional insights into species-specific adaptations in cell wall degradation.
The reference list from the paper itself. Each links out to its DOI / PubMed record.
- 1Amselem J. Cuomo C. A. van Kan J. A. Viaud M. Benito E. P. Couloux A. . (2011). Genomic analysis of the necrotrophic fungal pathogens Sclerotinia sclerotiorum and Botrytis cinerea. Plo S Genet. 7, e 1002230. doi: 10.1371/journal.pgen.1002230, PMID: 21876677 PMC 3158057 · doi ↗ · pubmed ↗
- 2Baroncelli R. Cobo-Diaz J. F. Benocci T. Peng M. Battaglia E. Haridas S. . (2024). Genome evolution and transcriptome plasticity is associated with adaptation to monocot and dicot plants in Colletotrichum fungi. Gigascience 13, giae 036. doi: 10.1093/gigascience/giae 036, PMID: 38940768 PMC 11212070 · doi ↗ · pubmed ↗
- 3Barrett K. Jensen K. Meyer A. S. Frisvad J. C. Lange L. (2020). Fungal secretome profile categorization of CA Zymes by function and family corresponds to fungal phylogeny and taxonomy: Example Aspergillus and Penicillium. Sci. Rep. 10, 5158. doi: 10.1038/s 41598-020-61907-1, PMID: 32198418 PMC 7083838 · doi ↗ · pubmed ↗
- 4Benatti M. R. Penning B. W. Carpita N. C. Mc Cann M. C. (2012). We are good to grow: dynamic integration of cell wall architecture with the machinery of growth. Front. Plant Sci. 3, 187. doi: 10.3389/fpls.2012.00187, PMID: 22936938 PMC 3424494 · doi ↗ · pubmed ↗
- 5Benoit I. Culleton H. Zhou M. Di Falco M. Aguilar-Osorio G. Battaglia E. . (2015). Closely related fungi employ diverse enzymatic strategies to degrade plant biomass. Biotechnol. Biofuels 8, 107. doi: 10.1186/s 13068-015-0285-0, PMID: 26236396 PMC 4522099 · doi ↗ · pubmed ↗
- 6De Vries R. P. Riley R. Wiebenga A. Aguilar-Osorio G. Amillis S. Uchima C. A. . (2017). Comparative genomics reveals high biological diversity and specific adaptations in the industrially and medically important fungal genus Aspergillus. Genome Biol. 18, 28. doi: 10.1186/s 13059-017-1151-0, PMID: 28196534 PMC 5307856 · doi ↗ · pubmed ↗
- 7Drula E. Garron M. L. Dogan S. Lombard V. Henrissat B. Terrapon N. (2022). The carbohydrate-active enzyme database: functions and literature. Nucleic Acids Res. 50, D 571–D 577. doi: 10.1093/nar/gkab 1045, PMID: 34850161 PMC 8728194 · doi ↗ · pubmed ↗
- 8Emms D. M. Kelly S. (2019). Ortho Finder: phylogenetic orthology inference for comparative genomics. Genome Biol. 20, 238. doi: 10.1186/s 13059-019-1832-y, PMID: 31727128 PMC 6857279 · doi ↗ · pubmed ↗