The magnitude of the pharmacodynamic index for NOSO-502: pathogen clearance, emergence of resistance and human dose predictions
Sanne van den Berg, Marie Attwood, Pippa Griffin, Alan Noel, Shampa Das, Markus Zeitlinger, Emilie Racine, Xavier Boulenc, Anouk E Muller, Sebastiaan D T Sassen, Soma Bahmany, Marian T ten Kate, Alasdair MacGowan, Joseph Meletiadis

TL;DR
This paper studies the effectiveness of a new antibiotic, NOSO-502, in clearing infections and predicting human doses based on pharmacodynamic data.
Contribution
The paper introduces a novel approach combining pharmacodynamic indices and human dose predictions for a new antimicrobial class.
Findings
The in vitro activity of NOSO-502 was higher in 100% Mueller–Hinton Broth II compared to 50%.
In vivo, the fAUC0–24/MIC for bacteriostatic effect and 1-log10 reduction in E. coli were 10.7 and 18.2, respectively.
Human doses to achieve bacteriostatic effects for E. coli ranged from 149 to 1717 mg/day.
Abstract
NOSO-5O2 is the first clinical candidate of a new antimicrobial class, the odilorhabdins. The pharmacodynamics of NOSO-502 was studied to establish the magnitude of the pharmacodynamic index (PDI) and make human dose predictions. In vitro experiments using different types of media were performed in time–kill curves and a pharmacokinetic model. In vivo experiments were conducted in the neutropenic murine thigh infection model. Six E. coli (MIC 1–8 mg/L) and two K. pneumoniae (MIC 1–2 mg/L) strains were used. 24 h bacteriostatic and 1- and 2-log10 kill effects were related to fAUC0–24/MIC and fAUC0–24/MIC per length of dosing interval (fAUC0–24/MIC·1/tau). Human pharmacokinetic parameters were predicted using interspecies allometric scaling and used to simulate the dose needed to reach the bacteriostatic PDI target for E. coli. The in vitro activity of NOSO-502 was dependent on the…
Genes, proteins, chemicals, diseases, species, mutations and cell lines named across the full text — each resolved to its canonical identifier and authoritative record.
Click any figure to enlarge with its caption.
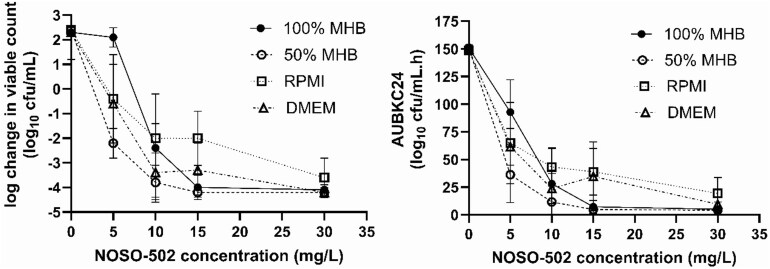 Figure 1
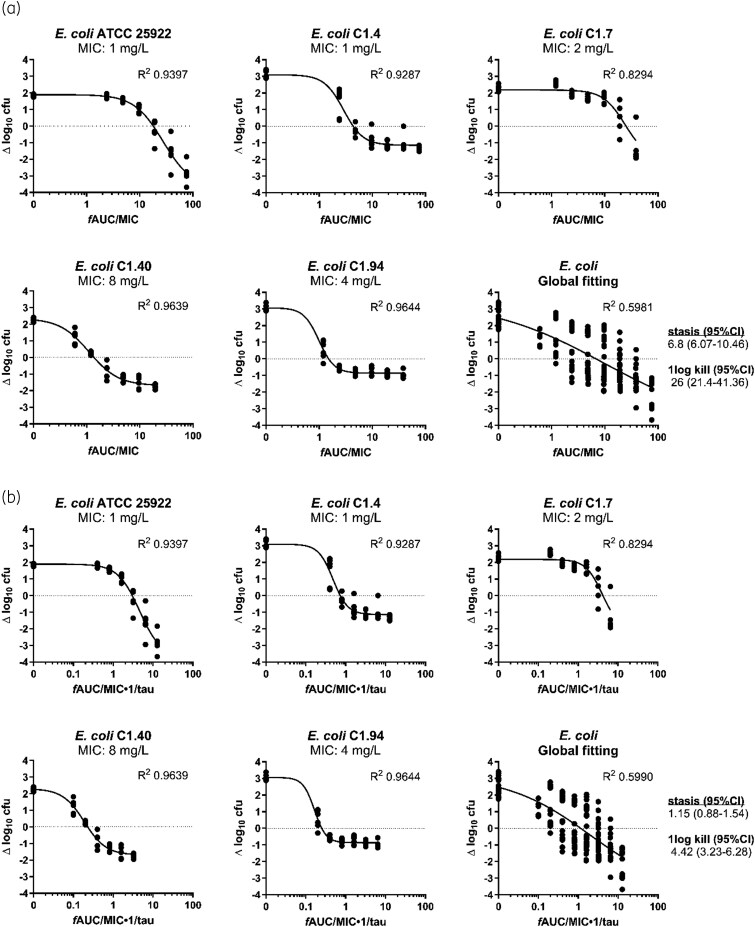 Figure 2
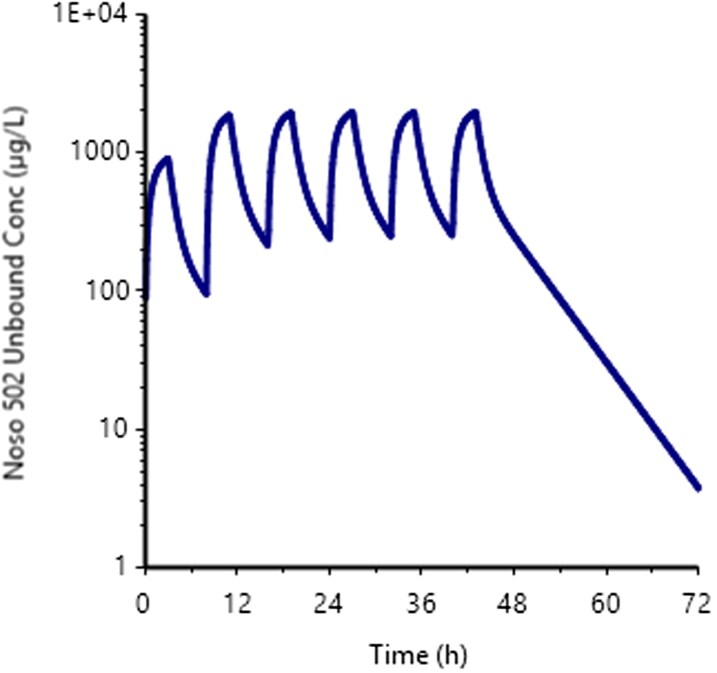 Figure 3
| Species | Isolate or data measure | MIC (mg/L) | Mean ± SD bacterial burden at start of exposure (log10 cfu/mL) | Mean ± SD increase of bacterial burden (log10 cfu/mL) with 24 h growth in growth controls | Mean ± SD maximum kill at the end of exposure (log10 cfu/mL) |
|
|
|
|---|---|---|---|---|---|---|---|---|
|
| ATCC 25922 | 1 | 6.0 ± 0.1 | 2.6 ± 0.1 | >−4.2 | 11.7 | 17.7 | 25.2 |
| C1.94 | 4 | 6.5 ± 0.1 | 2.1 ± 0.1 | −3.8 ± 0.1 | 31.0 | 51.0 | 83.0 | |
| 1135 | 1 | 6.1 ± 0.1 | 2.5 ± 0.1 | >−4.2 | 37.5 | 73.4 | 146.8 | |
| Mean | 6.2 | 2.4 | NC | 26.7 | 47.4 | 85.0 | ||
| Median | 6.2 | 2.5 | >−4.2 | 31.0 | 51.0 | 83.0 | ||
| SD | 0.2 | 0.2 | NC | 13.4 | 28.0 | 60.8 | ||
|
| ATCC 700603 | 2 | 6.3 ± 0.1 | 2.0 ± 0.1 | −4.2 ± 0.1 | 16.2 | 21.7 | 27.8 |
| Species | Isolate or data measure | MIC (mg/L) | Mean ± SD bacterial burden at start of treatment (log10 cfu/thigh) | Mean ± SD increase of bacterial burden (log10 cfu/thigh) with 24 h growth in placebo treated controls | Mean ± SD maximum kill at the end of therapy (log10 cfu/thigh) | Targets for stasis | Targets for 1-log10 kill | ||
|---|---|---|---|---|---|---|---|---|---|
|
|
|
|
| ||||||
|
| ATCC 25922 | 1 | 7.70 ± 0.16 | 1.84 ± 0.19 | −2.85 ± 0.59 | 17.99 | 3.00 | 28.48 | 4.75 |
| C1.4 | 1 | 6.85 ± 0.12 | 3.08 ± 0.30 | −1.74 ± 0.13 | 4.37 | 0.73 | 11.67 | 1.94 | |
| C1.7 | 2 | 7.34 ± 0.04 | 2.29 ± 0.21 | −0.96 ± 0.20 | 25.11 | 4.19 | 41.82 | 6.97 | |
| C1.94 | 4 | 6.35 ± 0.11 | 3.06 ± 0.28 | −1.38 ± 0.96 | 1.50 | 0.25 | 5.81 | 0.97 | |
| C1.40 | 8 | 7.02 ± 0.04 | 2.25 ± 0.10 | −1.34 ± 0.14 | 1.36 | 0.23 | 2.99 | 0.50 | |
| Mean | 7.05 | 2.51 | −1.60 | 10.07 | 1.68 | 18.16 | 3.03 | ||
| Median | 7.04 | 2.39 | −1.30 | 4.37 | 0.73 | 11.67 | 1.94 | ||
| SD | 0.46 | 0.52 | 0.73 | 10.85 | 1.81 | 16.52 | 2.75 | ||
|
| ATCC 43816 | 1 | 7.93 ± 0.12 | 1.55 ± 0.57 | −1.80 ± 0.15 | 2.95 | 4.00 | 0.49 | 0.67 |
| Parameter | Estimate | CV% |
|---|---|---|
| V (L) | 21.8 | 19 |
| V2 (L) | 28.8 | 8.9 |
| Cl (L/h) | 17 | 7.8 |
| Cl2 (L/h) | 8.1 | 12 |
|
| MIC (mg/L) |
| Daily dose (mg) |
|
|---|---|---|---|---|
| ATCC 25922 | 1 | 17.99 | 615 | 17.99 |
| C1.4 | 1 | 4.37 | 149 | 4.37 |
| C1.7 | 2 | 25.11 | 1717 | 50.20 |
| C1.40 | 8 | 1.36 | 372 | 10.88 |
| C1.94 | 4 | 1.50 | 205 | 6.00 |
| Mean | 612 | 17.89 | ||
| Median | 372 | 10.88 |
- —Innovative Medicines Initiative10.13039/501100010767
- —European Union’s Horizon 2020 research and innovation programme
- —EFPIA10.13039/100013322
Peer Reviews
No public reviews on file for this paper yet. If you reviewed it on a platform where reviews are public (OpenReview, ICLR, NeurIPS, ICML), you can paste yours below so the community can read it here.
Videos
No videos yet. Explain this paper in a talk, walkthrough, or lecture? Add one.
Taxonomy
TopicsAntibiotics Pharmacokinetics and Efficacy · Pharmacogenetics and Drug Metabolism · Carcinogens and Genotoxicity Assessment
Introduction
Enterobacterales, such as Escherichia coli and Klebsiella pneumoniae, have the dubious honour of leading the list of antibiotic-resistant bacterial priority pathogens published by the WHO.^1^ This most critical group of pathogens includes multidrug-resistant bacteria that pose a threat in hospitals, nursing homes and among patients who are dependent on devices such as intravenous catheters, prosthetic implants and ventilators. These pathogens can cause severe and often deadly infections and have become resistant to many antibiotics. The development of new antimicrobials is key to fight the increasing antibiotic resistance in such high-grade pathogens,^2^ which was estimated to have resulted in 1.27 million deaths in 2019,^3^ with numbers rising.
Odilorhabdins are a novel class of peptide antibiotics that bind to the decoding centre of the 16S subunit of the bacterial ribosome at a site not exploited by any known ribosome-targeting antibiotic.^4^ A lead optimization programme using medicinal chemistry has led to the development of promising lead odilorhabdin candidate, NOSO-502. Its antimicrobial activity against E. coli and K. pneumoniae has been shown both in in vitro time–kill experiments and in murine infection models.^5^ Its pharmacodynamics (PD) have been studied in the neutropenic murine thigh infection model with E. coli and K. pneumoniae strains, which suggested fAUC/MIC as the dominant PD index (PDI).^6^ In our recent study,^7^ we have shown in the same murine model as well as in the in vitro pharmacokinetic model that NOSO-502 efficacy was best described by the fAUC/MIC but also time of drug exposure.^8^ In the present study, we determined the magnitude of both fAUC_0–24_/MIC and a modified pharmacodynamic index which incorporates both AUC and time of exposure (fAUC_0–24_/MIC·1/tau) which were associated with stasis and bactericidal outcomes in an in vitro pharmacokinetic and neutropenic murine thigh infection model. These values were subsequently used to make predictions of the effective human dose.
Materials and methods
Bacteria, media and antibiotics
Six E. coli and two K. pneumoniae isolates were used for these studies (Table S1, available as Supplementary data at JAC Online). The MICs of NOSO-502 and eight commonly used antibiotics against the bacterial isolates used in this study were determined before by broth microdilution according to the ISO guidelines.^9,10^ Strains were representatives of the NOSO-502 MIC range 1–8 mg/L, MIC_90_ 4 mg/L against E. coli, and varying resistance patterns including ATCC wild-type isolates.^10^ Isolates grew well in in vitro and in vivo infection models. Cation adjusted Mueller–Hinton broth II (MHBII, BBL Le Pont de Claix, France) and agar (MHA, ThermoFisher, UK) was used for subculturing and quantification. Nosopharm SAS (Nîmes, France) supplied NOSO-502. The compound was reconstituted in sterile phosphate buffer (pH 7.4). All dose levels are presented as net peptide.
In vitro time–kill curves in different media
Overnight cultures of E. coli ATCC 25922 were diluted into fresh 100% MHBII, 50% MHBII, RPMI and DMEM to yield an inoculum of 1 × 10^6^ cfu/mL in a total volume of 10 mL. Drug was added at 0, 5, 10, 15 and 30 mg/L and cultures were incubated at 37°C in air for 24 h. One millilitre samples were taken at t= 0, 2, 4, 6, 8, 12, 24 h; aliquots (100 μL of neat and 10^−3^ dilution) were plated onto nutrient agar plates using a spiral plater (Don Whitley Scientific, Yorkshire, UK) and incubated for 24 h before counting.
In vitro pharmacokinetic model
A Fermac 301 Fermentation System (Electrolab, Tewkesbury, UK) in vitro PK model was used to simulate concentrations of NOSO-502 administered every 8 h as described previously.^7^ The model has been validated in comparison to other in vitro pharmacokinetic models^11^ and a fuller description is given in MacGowan et al.^12^ NOSO-502 exposures were simulated using a t1/2 of 4 h and Cmax up to 24.1 mg/L. Two isolates (E. coli ATCC 25922 and K. pneumoniae 700603) were initially tested and PK/PD targets were subsequently determined for another two E. coli strains. Samples were taken throughout the sampling period up to 24 h for quantification of viable counts. Bacteria were counted by a spiral plater (Don Whitley Systems, Shipley, West Yorkshire, UK). Aliquots were also taken at 0, 24 and 48 h and plated on to nutrient agar plates containing 4× and 8× NOSO-502 MIC to study emergence of resistance. Plates were incubated for a minimum of 18 h in air at 36°C and the viable counts determined. The minimum level of detection was 10^2^ cfu/mL. Aliquots were stored at −70°C for NOSO-502 assay.
Ethical approval
All pre-clinical studies described in this study were conducted in accordance with the recommendations of the European Community (EU Animal Directive 2010/63/EU 2010 directive) and approved by the Institutional Animal Care and Use Committees of Erasmus MC (IRN 2019–0018) and Aptuit Committee on Animal Research and Ethics (Experimental Project internal code: 36101).
In vivo thigh infection model
Female outbred CD-1 mice (Charles River Germany), 7–8 weeks old, weight (mean ± SD) 25.0 ± 1.5 g, specified pathogen-free, were used. These were housed under standard conditions with food and water supplied ad libitum and allowed to acclimatize at least 1 week in the facility.
NOSO-502 efficacy was determined in the neutropenic thigh infection model as described before.^7^ Briefly, neutropenic mice were infected with 6–60 × 10^5^ cfu/50 µL in each lateral thigh muscle using E. coli strain ATCC 25922, C1.4, C1.7, C1.94 or C1.40, or K. pneumoniae strain ATCC 43816 (one strain in both thighs). NOSO-502 was dosed subcutaneously every 6 h, starting 2 h after infection, 11–352 mg/kg (E. coli ATCC 25922, C1.4, C1.7), 22–705 mg/kg (E. coli C1.94, C1.40) or 5.5–705 mg/kg (K. pneumoniae ATCC 43816) net peptide total daily dose, three mice per dosing group. Phosphate buffer was used as placebo treatment. Mice were randomly allocated to experimental groups. At t = 24 h, mice were humanely killed, unless the welfare of the animals indicated earlier termination was necessary, following animal welfare regulations. Bacterial load in thigh muscles at t = 0 and t = 24 h was determined, and expressed as the difference between the log_10_[cfu/thigh] values ‘Δlog_10_ cfu’.
Murine NOSO-502 plasma levels were determined using LC–MS/MS analysis as previously described.^7^ Free plasma levels were calculated based on 83% plasma protein binding, and PK was described in a population PK model.
PK/PD analyses
The in vitro and in vivo exposure–response relationships Δlog_10_ cfu versus fAUC_0–24_/MIC and fAUC_0–24_/MIC·1/tau were quantified and the relationships were analysed with nonlinear regression analysis using the sigmoid Emax (hill) model (GraphPad Prism v.8.0, San Diego, CA, USA). The PK/PD indices required for a static, 1- and 2-log_10_ kill effect for E. coli and K. pneumoniae isolates were determined. The coefficient of determination (R^2^) from this model was used to numerically quantify the strength of this relationship.
Human dose prediction
Human pharmacokinetic parameters of NOSO-502 (Cl, Vd_ss_, t1/2) were assessed using interspecies allometric scaling of the observed pharmacokinetic parameters from animal studies.
Mouse, rat, dog and non-human primate PK parameters were factorized to predict human PK parameters, as described hereafter for each PK parameter.
In addition, the human PK profile was predicted using the Wajima method, on the basis of the normalized PK profile of each species.^13^
The prediction of clearance (Cl) and volume of distribution at steady state (Vd_ss_) can be achieved by either scaling from animal PK data or in vitro microsomal/hepatocyte Cl (that is, in vitro–in vivo extrapolation, IVIVE).^14,15^ NOSO-502 was found to be metabolized in blood and hepatocytes in vitro in human and pre-clinical species.^5^ However, because hydrolases are ubiquitous, it is likely that multiple organs are responsible of the clearance of the compound. Thereby, no IVIVE was investigated to predict human clearance. Three methods were selected for clearance prediction: simple allometry, simple allometry with Fup correction and fraction unbound corrected intercept (i.e. FCIM) correction.
Three methods were selected for Vd_ss_ prediction: Oie–Tozer, allometry with plasma fraction unbound (i.e. Fup) correction and individual species extrapolation with Fup correction. For both, Vd_ss_ and Clearance, the methods selected are fully described elsewhere.^14–17^
Sophisticated human dose projection requires the prediction of time–concentration profile targeting Cmax or Ctrough to achieve the desired efficacy, in addition to the human PK parameters (see previous paragraph). A widely adopted approach was proposed by Wajima et al.^13^ using intravenous (i.v.) predicted human PK parameters (Cl and Vd_ss_) and the time–concentration profiles generated from pre-clinical animal species. This approach yields a normalized time–concentration plot with new combined (dimensionless) data points by dividing the concentration by steady-state concentration (Css; dose/Vd_ss_) and the time by mean residence time (Vd_ss_/Cl), respectively, for each species. By so doing, one predicted human PK profile is generated for each pre-clinical species, as described in Lombardo et al.^14^ and Vuppugalla et al.^17^ However, if the profiles are not fully superimposed, they reflect uncertainty in the method. All normalized humanized PK profile were fitted in one shot in Phoenix software with naïve pooled data option to estimate the average human PK parameters, and their associated uncertainty (reflected by the CV) from all the PK profile (Phoenix Certara, NLME version 8.3.5.340). The naïve pooled data function, when applied to population data, treats all observations as if they came from a single individual (average human in this case) in that it ignores inter-individual variations.
PK human parameters were then used to simulate the appropriate doses (for a human body weight of 70 kg) to assess the dose needed to reach fAUC_0–24_/MIC PDI target for each strain, previously assessed in the neutropenic murine thigh infection model.
Results
In vitro dose responses
Time–kill curves with E. coli ATCC 25922 across a range of concentrations of NOSO-502 in different media are shown on Figure 1. The strength of MHB used impacted on bacterial kill with greater kill found in 50% MHB compared with 100% MHB particularly at low NOSO-502 concentrations e.g. 5 mg/L resulted in −2, −0.5, −0.6 and +2 log_10_ cfu/mL change from initial inoculum in 50% MHB, RPMI, DMEM and 100% MHB, respectively.
Effect of 100% MHB, 50% MHB, RPMI and DMEM on the activity of NOSO-502 against E. coli ATCC 25922 (means and standard deviations are shown).
In the in vitro pharmacokinetic model, exposure–response experiments in 50% and 100% MHB with E. coli ATCC 25922 and K. pneumoniae 700603 showed that PK/PD targets for stasis, 1-log_10_ and 2-log_10_ kill were lower in 50% MHB compared with 100% MHB particularly for E. coli (11.7, 17.7 and 25.2 versus 90.4, 109.6 and 130.3, respectively) and less for K. pneumoniae (16.2, 21.7 and 27.8 and 19.3, 34.0 and 56.3, respectively) (Figure S1). Subsequently three strains of E. coli and K. pneumoniae 700603 strains were tested in the in vitro infection model with 50% MHB and the fAUC_0–24_/MIC ratios for stasis, 1-log_10_ kill and 2-log 10 kill together with bacterial load in controls and maximum kill are shown in Table 1. For all the strains a static, 1-log_10_ kill and 2-log 10 kill effect was achieved at mean fAUC_0–24_/MIC 26.7, 47.4 and 85 for E. coli and 16.2, 21.7 and 27.8 for the K. pneumoniae. The fAUC_0–24_/MIC·1/tau were not calculated as in all the exposure ranging experiments NOSO-502 was given 8 hourly.
Population profile changes at fAUC_0–24_/MIC ratios from 0 to >35 for E. coli and 0 to >45 for K. pneumoniae are shown in Table S2. Suppression of population changes occurred at fAUC_0–24_/MIC of ≥25 for E. coli and ≥45 for K. pneumoniae.
In vivo dose responses
In thigh infected mice, at start of treatment, the average bacterial thigh load was 7.05 (range 6.35–7.70) and 7.93 log_10_ cfu for E. coli and K. pneumoniae, respectively. In placebo treated mice, bacteria grew on average 2.51 (range 1.84–3.08) and 1.55 log_10_ cfu/thigh in E. coli and K. pneumoniae infected mice, respectively (Table 2).
For all isolates, a static and 1-log_10_ kill effect was achieved; for two of six strains (E. coli ATCC 25922 and K. pneumoniae ATCC 43816), a 2-log_10_ kill effect was observed at the doses tested. The Emax model well described the exposure–response relationship of all isolates, and the static and 1-log_10_ kill fAUC_0–24_/MIC and fAUC_0–24_/MIC·1/tau targets were calculated (Table 2, Figure 2). For E. coli (five strains), the mean fAUC_0–24_/MIC targets associated with stasis and 1-log_10_ kill were 10.07 and 18.16, and fAUC_0–24_/MIC·1/tau targets associated with stasis and 1-log_10_ kill were 1.68 and 3.03, respectively. For K. pneumoniae (1 strain), the fAUC_0–24_/MIC target associated with stasis and 1-log_10_ kill were 2.95 and 4.00, and fAUC_0–24_/MIC·1/tau targets associated with stasis and 1-log_10_ kill were 0.49 and 0.67, respectively.
Exposure–response relationships of NOSO-502 fAUC0–24/MIC (a) and fAUC0–24/MIC·1/tau (b) for each strain individually and for all strains together. Each dot represents a therapy response in one mouse thigh. The line is the best-fit line based on the sigmoidal Emax model.
Human dose prediction
Pre-clinical PK parameters in mice, rats, dogs and non-human primates (cynomolgus monkeys) are shown in the Table S3. NOSO-502 is moderately bound to plasma proteins, with no major species differences. The maximum difference is observed in rat 0.13 versus human 0.25 (Table S4). Blood plasma partitioning ratios (B/P ratios) are consistent between the species. B/P ratios being low, reflecting a low distribution in blood cells (Table S5).
Human PK predicted Vd_ss_ and Cl parameters are shown in Tables S6 and S7, and Figure S2. The methods used exhibit a good consistency to each other for both Vd_ss_ (0.5–0.9 L/kg, overall predicted values 0.7 L/kg) and Cl (14–19.2 L/h, overall predicted value 16.5 L/h). The average values were used as input parameters to generate the human PK parameter prediction (Wajima method). Combining predicted human clearance and volume of distribution, a humanized PK profile was generated for each pre-clinical species. A two-compartment model was used to fit the four PK profiles, through the naïve pooled data option in Phoenix software. Observed versus predicted NOSO-502 individual concentrations are shown in Figure S3, indicating an appropriate fitting of the individual PK profiles.
Predicted human PK parameters, with their associated CV are reported in Table 3, showing a reasonable level of uncertainty reflected by a narrow CV (<20%). These human PK parameters were used to simulate PK profiles at different doses after 3 h infusion in human for a body weight of 70 kg, as exemplified in Figure 3 after 372 daily mg (median value from Table 4), every 8 h for six administrations. A non-compartmental analysis was conducted to assess the size of the exposure parameter (that is, fAUC at steady state), for a given dose, to reach the 24 h bacteriostatic fAUC/MIC target (Table 2), for each E. coli strain (Table 4). Table 2 presents the target fAUC to be reached and the corresponding daily dose.
Simulated human PK plasma profile (unbound concentrations) after six repeated administrations of a 372 mg daily dose. This dose is the median predicted human dose required to attain the in vivo static PK/PD target, as presented in Table 4.
Discussion
Pre-clinical studies to establish the pharmacokinetic/pharmacodynamic (PK/PD) characteristics of developmental antibacterials are an essential step in establishing effective dosing regimens for clinical trials and ultimately use in infected patients. This is especially the case with classes of drug that have not been previously studied in man.^18^ In this regard, use of several PK/PD modelling approaches is important in understanding how established models can be used to assess drugs with previously unexploited modes of action. NOSO-502, a novel peptide antimicrobial, as the lead compound of the odilorhabdin class, is such an example.
The pharmacodynamics of NOSO-502 against Enterobacterales have been previously studied in vivo by Zhao et al.^6^ and in vitro and in vivo by Van den Berg et al.^7^ In both these studies fAUC/MIC was the dominant pharmacodynamic index although Van den Berg et al. also described a time dependent element to NOSO-502s antibacterial effect, which would imply multiple dosing in a 24 h period would be preferred in human therapy.
In vitro evaluation of NOSO-502 killing effect and the magnitude of the fAUC_0–24_/MIC to produce bacteriostatic and bactericidal effects against E. coli and K. pneumoniae using time–kill curves and a pharmacokinetic model indicated that the antibacterial effect of NOSO-502 was dependent on the media used being greater in RPMI and DMEM than MHBII and greater in 50% MHBII than full strength. This is probably related to inhibitory peptones in MHBII that antagonize the activity of peptide antimicrobials such as NOSO-502.^19,20^ However, the use of alternative media must be balanced by their ability to sustain bacterial growth. Here we selected 50% MHBII as the media, which allowed the growth of E. coli and K. pneumoniae strains while partly negating the inhibitory effect of 100% MHBII. This was partly successful in that fAUC_0–24_/MIC targets for E. coli ATCC 25922 were similar in vitro and in vivo but not for E. coli strain C1.94.
Using six strains of E. coli, Zhao et al.^6^ reported fAUC_0–24_/MIC values of 10.4 ± 6.32 for static effect but were not able to quantify the exposures for a 1-log_10_ kill. Here we found that for 4 E. coli strains the fAUC_0–24_/MIC for stasis was 10.7 ± 10.9 and for 1-log_10_ kill 18.2 ± 16.5, therefore there was good agreement in terms of fAUC_0–24_/MIC static effect target and also in the variability between E. coli strains tested. Zhao et al.^6^ also reported fAUC_0–24_/MIC static effect targets for K. pneumoniae to be 4.22 ± 4.73 (range 0.75–12.69), which was comparable to the single strain we tested in vitro and in vivo (fAUC_0–24_/MIC static effect target of 16.2 in vitro and 2.95 in vivo). The fAUC_0–24_/MIC values for each strain were integrated with predicted human pharmacokinetic (PK) parameters—estimated using allometric scaling and Wajima-derived PK profiles—to determine an effective human dose for each strain. The predicted human doses, administered three times daily with a 3-hour infusion, range from 149 mg (E. coli C1.4) to 1717 mg (E. coli C1.7) per day.
We elected to translate the E. coli in vivo fAUC_0–24_/MIC static effect targets into the simulations using the predicted human pharmacokinetics as there was good agreement on the mean target values from the two murine studies.^6,7^ It could be argued that a 1-log_10_ kill was more appropriate, but the potential target was much less clear. The results indicated that the worst-case human dose of NOSO-502 would be 1717 mg as daily dose, for E. coli strain C1.7 (fAUC_0–24_/MIC for static effect: 25.7) which has a higher fAUC_0–24_/MIC value than any of the other strains here or by Zhao et al.^6^
This study has some clear limitations, perhaps most notable is the lack of data on Klebsiella species where only one strain was tested in vitro and in vivo so the size of the fAUC_0–24_/MIC could not be safely established. As Klebsiella species are often multidrug-resistant this data gap will need to be addressed. In addition, though the risk of emergence of resistance was partly studied in some in vitro simulations, further work is required. Moreover, we did not use positive controls (active antibiotics) in our studies, which could have provided an additional layer of validation. Nevertheless, both models have been repeatedly used in previous research,^7^ consistently demonstrating their validity. Finally, in the human dose simulations inter-individual human pharmacokinetic differences were not included. Such data will become available with the conduct of Phase 1 studies and strengthened in Phase 2 trials when infection in man is treated.
In conclusion, the data presented here add to that already described for NOSO-502 in terms of its PK/PD characteristics.^6,7^ By establishing the target size of the fAUC_0–24_/MIC for static effect and translating this into predicted human pharmacokinetics, based on animal data, we were able to estimate likely effective doses in human. Such information is essential in the evaluation of drug safety in first-in-human Phase 1 studies.
Supplementary Material
dkag106_Supplementary_Data
The reference list from the paper itself. Each links out to its DOI / PubMed record.
- 1Sati H, Carrara E, Savoldi A et al The WHO Bacterial Priority Pathogens List 2024: a prioritisation study to guide research, development, and public health strategies against antimicrobial resistance. Lancet Infect Dis 2025; 25: 1033–43. 10.1016/S 1473-3099(25)00118-540245910 PMC 12367593 · doi ↗ · pubmed ↗
- 2WHO . Global action plan on antimicrobial resistance. https://iris.who.int/server/api/core/bitstreams/1a 487887-e 162-46a 0-8aef-802907 c 66070/content.
- 3Antimicrobial Resistance Collaborators . Global burden of bacterial antimicrobial resistance in 2019: a systematic analysis. Lancet 2022; 399: 629–55. 10.1016/S 0140-6736(21)02724-035065702 PMC 8841637 · doi ↗ · pubmed ↗
- 4Pantel L, Florin T, Dobosz-Bartoszek M et al Odilorhabdins, antibacterial agents that cause miscoding by binding at a new ribosomal site. Mol Cell 2018; 70: 83–94.e 7. 10.1016/j.molcel.2018.03.00129625040 · doi ↗ · pubmed ↗
- 5Racine E, Nordmann P, Pantel L et al In vitro and in vivo characterization of NOSO-502, a novel inhibitor of bacterial translation. Antimicrob Agents Chemother 2018; 62: e 01016-18. 10.1128/AAC.01016-1829987155 PMC 6125496 · doi ↗ · pubmed ↗
- 6Zhao M, Lepak AJ, Marchillo K et al In vivo pharmacodynamic characterization of a novel odilorhabdin antibiotic, NOSO-502, against Escherichia coli and Klebsiella pneumoniae in a murine thigh infection model. Antimicrob Agents Chemother 2018; 62: e 01067-18. 10.1128/AAC.01067-1829987156 PMC 6125547 · doi ↗ · pubmed ↗
- 7van den Berg S, Attwood MGL, Griffin P et al Pharmacodynamics of NOSO-502 studied in vitro and in vivo: determination of the dominant pharmacodynamic index driver. J Antimicrob Chemother 2025; 80: 752–9. 10.1093/jac/dkae 46939804217 · doi ↗ · pubmed ↗
- 8Mc Entee L, Johnson A, Farrington N et al Pharmacodynamics of tebipenem: new options for oral treatment of multidrug-resistant gram-negative infections. Antimicrob Agents Chemother 2019; 63: e 00603-19. 10.1128/AAC.00603-1931109982 PMC 6658774 · doi ↗ · pubmed ↗