Predicting stroke-associated infection in acute ischemic stroke patients treated by thrombolysis
Xuanyue Yu, Zeyuan Wang, Dong Chen, Shuming Li, Haojie Gao, Wen Zhao, Zishan Ji, Ziqi Han, Ruikang Sun, Shuya Cai, Zhicheng Jiang, Shiwei Du, Dirk M. Hermann, Yi Liu

TL;DR
This study identifies risk factors for stroke-associated infections and creates a tool to predict them in stroke patients treated with thrombolysis.
Contribution
A predictive nomogram for early identification of stroke-associated infection in thrombolysis-treated stroke patients.
Findings
20.1% of patients developed stroke-associated infection, with pulmonary infections being most common.
Five independent risk factors were identified, including higher modified Rankin Scale and male sex.
The predictive nomogram achieved an area under the curve of 0.80 in training and 0.72 in validation cohorts.
Abstract
Acute ischemic stroke (AIS) remains one of the major contributors to mortality and disability worldwide. Stroke-associated infection (SAI) is one of the most frequent complications following AIS and has a substantial impact on clinical outcomes, being closely linked to unfavorable prognosis. This study aimed to provide a comprehensive description of SAI, identify independent risk factors, and develop a predictive nomogram for its early identification. This study included 836 AIS patients of the Dalian Single-center Study on Intravenous Thrombolysis for Ischaemic Stroke (DATIS) cohort who received recombinant tissue-plasminogen activator-induced thrombolysis at Central Hospital of Dalian University of Technology between January 2018 and November 2021. Patients were divided into a training cohort (n = 586, 70%) and a validation cohort (n = 250, 30%). Composition and economic features of…
Genes, proteins, chemicals, diseases, species, mutations and cell lines named across the full text — each resolved to its canonical identifier and authoritative record.
Click any figure to enlarge with its caption.
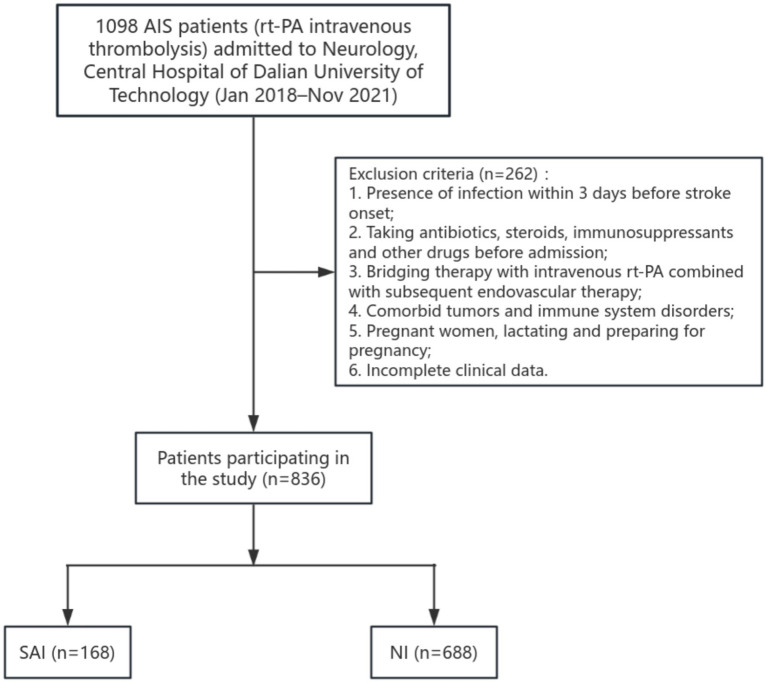 Figure 1
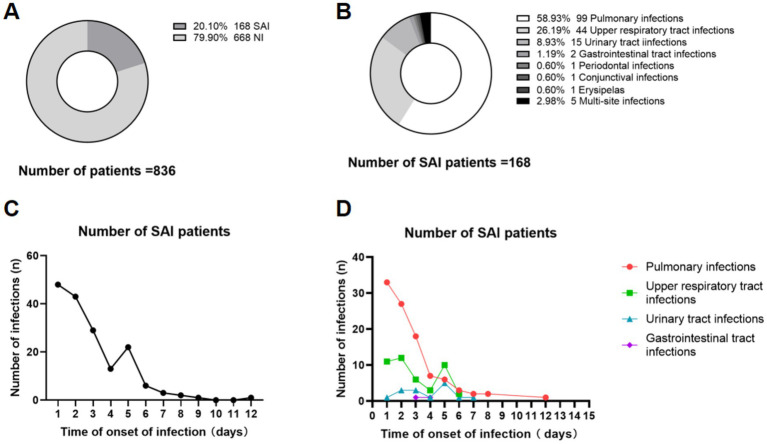 Figure 2
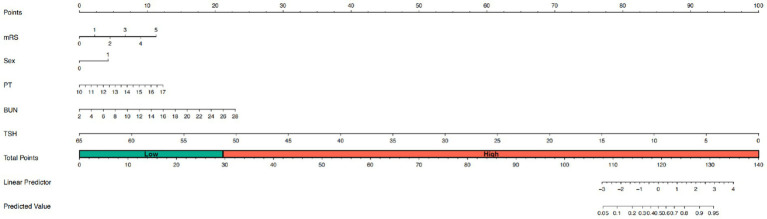 Figure 3
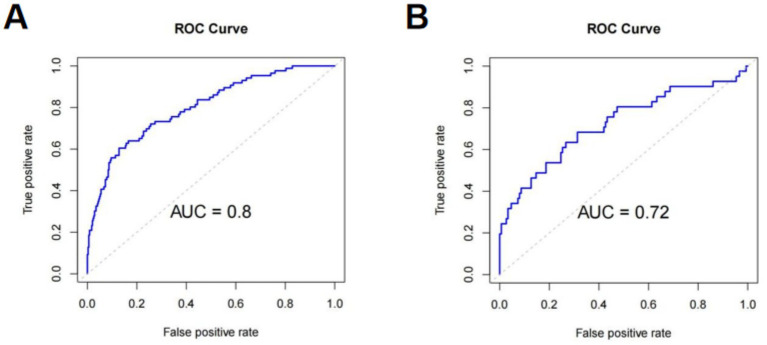 Figure 4
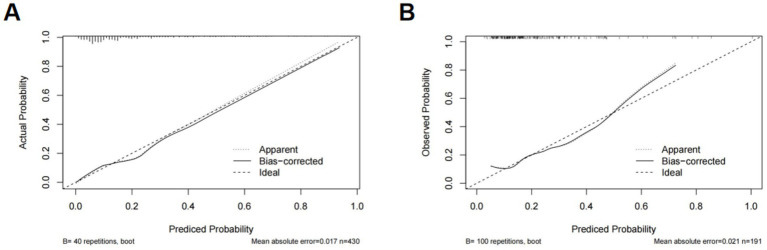 Figure 5
| Variables | Training cohort ( | Validation cohort ( | |
|---|---|---|---|
| NIHSS at admittance | 4 (2, 7) | 4 (2, 7) | 0.632 |
| mRS at admittance | 1 (1, 2) | 1 (1, 2) | 0.246 |
| Number of days of hospitalization | 8 (7, 9) | 8 (7, 10) | 0.521 |
| Age, years | 68 (60, 78) | 69 (60, 78) | 0.888 |
| Sex, no (%) | |||
| Man | 372 | 166 | 0.420 |
| Women | 214 | 84 | |
| Smoking (%) | 40.1 | 44.4 | 0.248 |
| Alcoholism (%) | 27.3 | 27.6 | 0.930 |
| Medical history (%) | |||
| Atrial fibrillation | 16.7 | 19.2 | 0.388 |
| Arterial hypertension | 77.9 | 77.2 | 0.802 |
| Diabetes | 30.3 | 24.0 | 0.350 |
| Coronary heart disease | 16.3 | 18.8 | 0.395 |
| Dyslipidemia | 38.7 | 37.2 | 0.675 |
| Previous stroke | 13.4 | 12.4 | 0.672 |
| Systolic blood pressure at admittance (mmHg) | 159 (144, 173) | 161 (144, 174) | 0.411 |
| Diastolic blood pressure at admittance (mmHg) | 86 (80, 94) | 88 (80, 96) | 0.094 |
| Stroke subtype based on TOAST | 0.523 | ||
| Large-artery atherosclerosis | 257 | 111 | |
| Cardioembolism | 135 | 45 | |
| Small-vessel occlusion | 82 | 38 | |
| Stroke of other determined etiology | 85 | 42 | |
| Stroke of undetermined etiology | 27 | 14 | |
| Location of responsible vessel | 0.739 | ||
| Anterior circulation | 408 | 174 | |
| Posterior circulation | 110 | 43 | |
| Anterior and posterior circulation | 68 | 33 | |
| Biochemical variables | |||
| High density lipoprotein (HDL) | 1.05 (0.89, 1.22) | 1.04 (0.87, 1.23) | 0.544 |
| Apolipoprotein A1 (Apo A1) | 1.25 (1.12, 1.38) | 1.25 (1.12, 1.44) | 0.557 |
| Apolipoprotein B (Apo B) | 0.94 (0.79, 1.09) | 0.95 (0.82, 1.10) | 0.729 |
| Lipoprotein (a) (Lp(a)) | 181.50 (81.00, 345.25) | 163.50 (72.50, 325.25) | 0.222 |
| Homocysteine (HCY) | 13.5 (11.0, 17.2) | 13.6 (11.0, 17.6) | 0.679 |
| White blood count (WBC) | 7.12 (5.95, 8.69) | 7.29 (6.04, 8.89) | 0.422 |
| Neutrophils (NEUT) | 4.33 (3.50, 5.78) | 4.50 (3.45, 5.80) | 0.789 |
| Lymphocyte (LYM) | 1.90 (1.36, 2.52) | 1.91 (1.50, 2.55) | 0.328 |
| Neutrophil/Lymphocyte (NLR) | 2.21 (1.60, 3.52) | 2.23 (1.52, 2.39) | 0.452 |
| Prothrombin time (PT) | 13.0 (12.5, 13.6) | 13.0 (12.4, 13.6) | 0.858 |
| Activated partial thromboplastin time (APTT) | 35.6 (32.4, 39.4) | 35.8 (32.7, 39.5) | 0.455 |
| Fibrinogen | 3.28 (2.86, 3.72) | 3.17 (2.79, 3.68) | 0.088 |
| Glucose | 6.77 (5.73, 8.92) | 6.76 (5.60, 8.43) | 0.369 |
| Blood Urea Nitrogen (BUN) | 6.27 (5.20, 7.52) | 6.45 (2.26, 7.86) | 0.121 |
| Creatinine clearance (Ccr) | 67.0 (56.0, 79.0) | 69.0 (57.0, 81.3) | 0.198 |
| Glomerular filtration rate (GFR) | 99.21 (82.80, 120.05) | 99.19 (89.93, 117.68) | 0.602 |
| Alanine aminotransferase (ALT) | 17.0 (12.0, 24.0) | 16.0 (12.0, 26.0) | 0.576 |
| Aspartate aminotransferase (AST) | 19.0 (15.0, 24.0) | 19.0 (15.0, 24.0) | 0.907 |
| Gamma-glutamyl transpeptidase (GGT) | 23.0 (16.0, 36.0) | 24.0 (18.0, 38.0) | 0.303 |
| Free triiodothyronine (FT3) | 4.42 (3.87, 4.89) | 4.49 (3.83, 5.00) | 0.543 |
| Free thyroxine (FT4) | 15.02 (13.60, 16.65) | 15.44 (13.94, 16.86) | 0.204 |
| Thyroid stimulating hormone (TSH) | 1.33 (0.76, 2.13) | 1.34 (0.79, 2.49) | 0.524 |
| Post-stroke infection | 19.6 | 21.2 | 0.603 |
| BMI | 25.06 (23.1, −27.34) | 25.06 (23.15, 27.05) | 0.599 |
| Variables | SAI ( | NI ( | OR (95% CI) | |
|---|---|---|---|---|
| Length of Hospital Stay (LOS), days | 9 (7, 10) | 8 (7, 9) | 1.155 (1.081, 1.234) | 0.000* |
| Hospitalization Costs, RMB | 28114.04 (23230.12, 33379.85) | 22292.84 (19203.53, 25999.63) | 1.001 (1.001, 1.001) | 0.000* |
| Variables | SAI ( | NI ( | B | Wald | OR (95%CI) | |
|---|---|---|---|---|---|---|
| NIHSS at admittance | 8 (3.25, 15) | 3 (2, 6) | 0.198 | 105.870 | 1.22 (1.17, 1.27) | 0.000* |
| mRS at admittance | 3 (1, 4) | 1 (1, 2) | 0.752 | 115.433 | 2.121 (1.85, 2.43) | 0.000* |
| Age, years | 77.5 (65, 84) | 67 (59, 75.75) | 0.059 | 50.194 | 1.061 (1.04, 1.08) | 0.000* |
| Sex, no (%) | ||||||
| Man | 88 | 450 | −0.629 | 12.917 | 0.533 (1.33, 2.65) | 0.000* |
| Women | 80 | 218 | ||||
| Smoking (%) | 33.3 | 43.4 | −0.428 | 5.575 | 0.652 (0.46, 0.93) | 0.018* |
| Alcoholism (%) | 18.4 | 29.6 | −0.622 | 8.266 | 0.537 (0.35, 0.82) | 0.004* |
| Medical history (%) | ||||||
| Atrial fibrillation | 32.1 | 13.7 | 1.087 | 29.622 | 2.966 (2.00, 4.39) | 0.000* |
| Arterial hypertension | 76.7 | 77.9 | −0.069 | 0.113 | 1.07 (0.72, 1.60) | 0.736 |
| Diabetes | 35.1 | 26.7 | 0.391 | 4.533 | 1.479 (1.03, 2.12) | 0.033* |
| Coronary heart disease | 23.2 | 15.5 | 0.494 | 5.459 | 1.64 (1.08, 2.48) | 0.019* |
| Dyslipidemia | 30.3 | 40.2 | −0.436 | 5.532 | 0.647 (0.45, 0.93) | 0.019* |
| Previous stroke | 20.2 | 11.3 | 0.681 | 8.897 | 1.976 (1.27, 3.09) | 0.003* |
| Systolic blood pressure at admittance (mmHg) | 161 (141, 175) | 159 (144, 172) | −0.001 | 0.067 | 0.999 (0.99, 1.00) | 0.795 |
| Diastolic blood pressure at admittance (mmHg) | 85 (77, 94) | 87 (80, 95) | −0.009 | 1.428 | 0.991 (0.98, 1.01) | 0.232 |
| Stroke subtype based on TOAST | ||||||
| Large-artery atherosclerosis | 78 | 290 | −0.009 | 0.017 | 0.991 (0.88, 1.13) | 0.896 |
| Cardioembolism | 23 | 157 | ||||
| Small-vessel occlusion | 42 | 78 | ||||
| Stroke of other determined etiology | 15 | 112 | ||||
| Stroke of undetermined etiology | 10 | 31 | ||||
| Location of responsible vessel | ||||||
| Anterior circulation | 116 | 466 | 0.044 | 0.131 | 1.045 (0.82,1.32) | 0.718 |
| Posterior circulation | 30 | 132 | ||||
| Anterior and posterior circulation | 22 | 79 | ||||
| Biochemical variables | ||||||
| High density lipoprotein (HDL) | 1.08 (0.91, 1.27) | 1.04 (0.88, 1.22) | 0.453 | 2.323 | 1.573 (0.88, 2.81) | 0.127 |
| Apolipoprotein A1 (Apo A1) | 1.26 (1.12, 1.39) | 1.25 (1.12, 1.39) | −0.185 | 0.217 | 0.831 (0.38, 1.81) | 0.641 |
| Apolipoprotein B (Apo B) | 0.96 (0.78, 1.14) | 0.94 (0.80, 1.09) | 0.067 | 0.646 | 1.069 (0.91, 1.26) | 0.421 |
| Lipoprotein (a) (Lp (a)) | 185.5 (81, 329.5) | 172 (78, 344.5) | 0.000 | 0.121 | 1.000 (1.00, 1.00) | 0.728 |
| Homocysteine (HCY) | 15.05 (12, 20.2) | 13.2 (10.9, 16.5) | 0.024 | 8.814 | 1.024 (1.01, 1.04) | 0.003* |
| White blood count (WBC) | 7.72 (6.02, 9.75) | 7.04 (5.95, 8.58) | 0.131 | 14.178 | 1.14 (1.07, 1.22) | 0.000* |
| Neutrophils (NEUT) | 4.84 (3.57, 6.85) | 4.28 (3.49, 5.60) | 0.160 | 18.481 | 1.173 (1.09, 1.26) | 0.000* |
| Lymphocyte (LYM) | 1.83 (1.23, 2.48) | 1.93 (1.47, 2.54) | −0.079 | 0.710 | 0.924 (0.77, 1.11) | 0.400 |
| Neutrophil/Lymphocyte (NLR) | 2.42 (1.67–4.40) | 2.18 (1.56–3.33) | 0.118 | 14.301 | 1.125 (1.06, 1.20) | 0.000* |
| Prothrombin time (PT) | 13.2 (13.6, 14.1) | 13.0 (12.5, 13.5) | 0.482 | 24.623 | 1.61 (1.34, 1.96) | 0.000* |
| Activated partial thromboplastin time (APTT) | 35.5 (32.7, 39.3) | 35.6 (32.6, 39.4) | −0.008 | 0.269 | 0.992 (0.96, 1.02) | 0.604 |
| Fibrinogen | 3.29 (2.86, 3.90) | 3.25 (2.84, 3.69) | −0.007 | 0.139 | 0.993 (0.96, 1.03) | 0.710 |
| Glucose | 7.37 (6.16, 9.49) | 6.23 (5.62, 8.62) | 0.040 | 3.210 | 1.04 (1.00, 1.09) | 0.073 |
| Blood Urea Nitrogen (BUN) | 7.10 (5.49, 9.00) | 6.13 (5.17, 7.43) | 0.204 | 32.678 | 1.226 (1.14, 1.31) | 0.000* |
| Creatinine clearance (Ccr) | 67 (56, 83) | 68 (57, 79) | 0.008 | 9.143 | 1.008 (1.00, 1.01) | 0.002* |
| Glomerular filtration rate (GFR) | 93.98 (70.85, 112.89) | 101.06 (84.15, 120.10) | −0.003 | 1.622 | 0.997 (0.99, 1.00) | 0.203 |
| Alanine aminotransferase (ALT) | 16 (11, 22) | 17 (13, 26) | −0.007 | 1.184 | 0.993 (0.98, 1.01) | 0.277 |
| Aspartate aminotransferase (AST) | 19 (16, 24) | 19 (15, 24) | 0.015 | 5.405 | 1.015 (1.00, 1.03) | 0.020* |
| Gamma-glutamyl transpeptidase (GGT) | 22.00 (15.75, 38.25) | 24.00 (17.00, 36.00) | −0.001 | 0.061 | 0.999 (0.99, 1.00) | 0.805 |
| Free triiodothyronine (FT3) | 4.02 (3.48, 4.49) | 4.51 (4.01, 5.02) | −0.189 | 7.387 | 0.828 (0.52, 0.81) | 0.007* |
| Free thyroxine (FT4) | 15.65 (13.55, 16.95) | 15.09 (13.75, 16.63) | 0.016 | 0.423 | 1.016 (0.98, 1.14) | 0.515 |
| Thyroid stimulating hormone (TSH) | 1.05 (0.61, 1.65) | 1.42 (0.81, 2.40) | −0.216 | 7.268 | 0.805 (0.67, 0.94) | 0.007* |
| BMI | 24.92 (22.79, 27.30) | 25.07 (23.29, 27.34) | −0.017 | 0.527 | 0.983 (0.94, 1.03) | 0.468 |
| Variables | SAI ( | NI ( | B | Wald | OR (95%CI) | |
|---|---|---|---|---|---|---|
| NIHSS at admittance | 8 (3.25, 15) | 3 (2, 6) | 0.064 | 2.770 | 1.066 (0.989, 1.149) | 0.096 |
| mRS at admittance | 3 (1, 4) | 1 (1, 2) | 0.308 | 4.666 | 1.361 (1.029, 1.801) | 0.031* |
| Age, years | 77.5 (65, 84) | 67 (59, 75.75) | 0.022 | 3.152 | 1.022 (0.998, 1.047) | 0.076 |
| Sex, no (%) | ||||||
| Man | 88 | 450 | −0.745 | 5.952 | 0.475 (0.261, 0.864) | 0.015* |
| Women | 80 | 218 | ||||
| Smoking (%) | 33.3 | 43.4 | 0.012 | 0.001 | 1.012 (0.529, 1.934) | 0.971 |
| Alcoholism (%) | 18.4 | 29.6 | −0.121 | 0.118 | 0.886 (0.443, 1.772) | 0.732 |
| Biochemical variables | ||||||
| Homocysteine (HCY) | 15.05 (12, 20.2) | 13.2 (10.9, 16.5) | 0.009 | 0.418 | 1.009 (0.982, 1.036) | 0.518 |
| White blood count (WBC) | 7.72 (6.02, 9.75) | 7.04 (5.95, 8.58) | 0.094 | 0.589 | 1.099 (0.864, 1.396) | 0.443 |
| Neutrophils (NEUT) | 4.84 (3.57, 6.85) | 4.28 (3.49, 5.60) | 0.046 | 0.087 | 1.047 (0.771, 1.421) | 0.769 |
| Neutrophil/Lymphocyte (NLR) | 2.42 (1.67, 4.40) | 2.18 (1.56, 3.33) | −0.006 | 0.010 | 0.994 (0.881, 1.120) | 0.920 |
| Prothrombin time (PT) | 13.2 (13.6, 14.1) | 13.0 (12.5, 13.5) | 0.361 | 7.514 | 1.435 (1.108, 1.858) | 0.006* |
| Blood Urea Nitrogen (BUN) | 7.10 (5.49, 9.00) | 6.13 (5.17, 7.43) | 0.144 | 4.981 | 1.154 (1.018, 1.310) | 0.026* |
| Creatinine clearance (Ccr) | 67 (56, 83) | 68 (57, 79) | 0.002 | 0.211 | 1.002 (0.992, 1.013) | 0.646 |
| Aspartate aminotransferase (AST) | 19 (16, 24) | 19 (15, 24) | 0 | 0.001 | 1.002 (0.982, 1.017) | 0.973 |
| Free triiodothyronine (FT3) | 4.02 (3.48, 4.49) | 4.51 (4.01, 5.02) | −0.064 | 0.577 | 0.938 (0.795, 1.107) | 0.448 |
| Thyroid stimulating hormone (TSH) | 1.05 (0.61, 1.65) | 1.42 (0.81, 2.40) | −0.25 | 7.453 | 0.779 (0.650, 0.932) | 0.006* |
| Variables | Model 1 | Model 2 | Model 3 | |||
|---|---|---|---|---|---|---|
| OR (95%CI) | OR (95%CI) | OR (95%CI) | ||||
| NIHSS at admittance | 1.19 (1.15–1.24) | <0.001* | 1.19 (1.14–1.24) | <0.001* | 1.05 (0.98–1.14) | 0.181 |
| mRS at admittance | 1.97 (1.71–2.28) | <0.001* | 1.95 (1.68–2.25) | <0.001* | 1.46 (1.09–1.95) | 0.011* |
| Age, years | 1.06 (1.04–1.08) | <0.001* | 1.06 (1.04–1.08) | <0.001* | 1.02 (1.00–1.05) | 0.086 |
| Sex, no (%) | ||||||
| Man | ||||||
| Women | 1.62 (1.03–2.53) | 0.035* | 1.73 (1.09–2.73) | 0.019* | 2.85 (1.48–5.51) | 0.002* |
| Smoking (%) | ||||||
| No | ||||||
| Yes | 0.70 (0.43–1.16) | 0.168 | 0.67 (0.40–1.12) | 0.127 | 0.95 (0.48–1.88) | 0.882 |
| Alcoholism (%) | ||||||
| No | ||||||
| Yes | 1.23 (0.72–2.09) | 0.452 | 1.24 (0.73–2.13) | 0.43 | 0.89 (0.43–1.87) | 0.759 |
| Biochemical variables | ||||||
| Homocysteine (HCY) | 1.03 (1.01–1.05) | 0.004* | 1.03 (1.01–1.05) | 0.006* | 1.01 (0.97–1.04) | 0.714 |
| White blood count (WBC) | 1.17 (1.09–1.26) | <0.001* | 1.17 (1.09–1.26) | <0.001* | 1.08 (0.85–1.38) | 0.514 |
| Neutrophils (NEUT) | 1.19 (1.10–1.28) | <0.001* | 1.18 (1.10–1.28) | <0.001* | 1.06 (0.78–1.43) | 0.715 |
| Neutrophil/Lymphocyte (NLR) | 1.10 (1.04–1.18) | 0.002* | 1.10 (1.03–1.17) | 0.002* | 0.96 (0.87–1.07) | 0.473 |
| Prothrombin time (PT) | 1.42 (1.16–1.74) | <0.001* | 1.42 (1.15–1.74) | <0.001* | 1.39 (1.05–1.85) | 0.022* |
| Blood Urea Nitrogen (BUN) | 1.16 (1.08–1.25) | <0.001* | 1.16 (1.07–1.24) | <0.001* | 1.17 (1.05–1.30) | 0.003* |
| Creatinine clearance (Ccr) | 1.01 (1.01–1.02) | 0.004* | 1.01 (1.01–1.02) | 0.006* | 1.00 (0.99–1.02) | 0.438 |
| Aspartate aminotransferase (AST) | 1.02 (1.01–1.03) | 0.008* | 1.02 (1.01–1.03) | 0.01* | 1.00 (0.98–1.02) | 0.987 |
| Free triiodothyronine (FT3) | 0.82 (0.64–1.06) | 0.123 | 0.84 (0.66–1.07) | 0.161 | 0.93 (0.73–1.20) | 0.585 |
| Thyroid stimulating hormone (TSH) | 0.74 (0.62–0.89) | 0.001* | 0.75 (0.63–0.90) | 0.002* | 0.76 (0.63–0.93) | 0.006* |
Peer Reviews
No public reviews on file for this paper yet. If you reviewed it on a platform where reviews are public (OpenReview, ICLR, NeurIPS, ICML), you can paste yours below so the community can read it here.
Videos
No videos yet. Explain this paper in a talk, walkthrough, or lecture? Add one.
Taxonomy
TopicsAcute Ischemic Stroke Management · Neuroinflammation and Neurodegeneration Mechanisms · Otolaryngology and Infectious Diseases
Introduction
1
Acute ischemic stroke (AIS) stands as one of the leading causes of disability and death worldwide. Intravenous recombinant tissue-type plasminogen activator (rt-PA) has been approved as the first-line therapy for AIS in the United States, Europe, and China. However, stroke-associated infection (SAI), a common complication of AIS, has been shown to significantly worsen patient prognosis (Rocco et al., 2013). Although several studies focussed on the immune responses predisposing to SAI - immunodepression was found to play a decisive role (Tuz et al., 2024; Roth et al., 2021), the clinical factors predisposing to SAI are still not well defined. Hospital-associated infections are associated with prolonged hospitalization, exacerbation of pre-existing medical conditions, and impaired functional recovery (Fluck et al., 2024), highlighting the critical need for early prediction and prevention of this complication.
The incidence of post-stroke infections has been reported to reach up to 30% (95% CI 24–36%), with pulmonary infections (10, 95% CI 9–10%) and urinary tract infections (UTI) being the most common types (Westendorp et al., 2011). Other types of infections, such as upper respiratory tract, gastrointestinal, periodontal, conjunctival, and skin (erysipelas) infections, have also been reported in AIS patients, although less frequently (Fluck et al., 2024; Grau et al., 2004). Predictive studies have also focused mostly on stroke-associated pneumonia (SAP) and UTI. Clinical score, e.g., Ischemic Stroke-Associated Pneumonia, and machine learning were developed specifically for SAP prediction (Suda et al., 2018a; Smith et al., 2015; Xie et al., 2025). Post-stroke dysphagia, which was considered main contributor to SAP, was confirmed to have risk factors of older age, higher NIHSS, and right-hemispheric stroke (Krekeler et al., 2024). Prediction for UTI has been focused on severe AIS and associated with Foley catheter retention (Jitpratoom and Boonyasiri, 2023). Furthermore, epidemiologic investigations such as that by Krekeler et al. (2024) have identified risk factors for post-stroke dysphagia (a known contributor to respiratory infection).
Currently, comprehensive studies elucidating composition and economic characteristics of SAI - including but not limited to SAP and UTI - and developing clinically practical prediction model are scarce. This prospective cohort aims to elucidate SAI with more clinical details, identify independent risk factors for SAI, and to develop a nomogram prediction model, which enables individualized risk assessment at the bedside. Consequently, it facilitates to support early identification of high-risk individuals, to optimize post-thrombolysis monitoring, and ultimately to improve patient outcomes by enabling timely interventions.
Materials and methods
2
Study design and participants
2.1
This study includes AIS patients who received intravenous thrombolysis with rt-PA and were admitted to the Department of Neurology of Central Hospital of Dalian University of Technology between January 2018 and November 2021. This study is part of the prospective Dalian Single-center Study on Intravenous Thrombolysis for Ischaemic Stroke (DATIS) cohort study that is continuously recruited at the Central Hospital. The Central Hospital of Dalian University of Technology is a major hospital in the city of Dalian, an 8 million inhabitant city in the North-East of China. It therefore has broad access to AIS patients. The study protocol has been registered at ChiCTR2400089803.
The inclusion criteria were as follows: Admission between January 2018 and November 2021; age ≥ 18 years; confirmed diagnosis of AIS by a neurologist in accordance with the Chinese Guidelines for the Diagnosis and Treatment of Acute Ischemic Stroke issued in 2023 (Liu et al., 2023); according to the indications for intravenous thrombolysis, the patients and his family signed the informed consent for thrombolysis and received intravenous thrombolysis with rt-PA.
The exclusion criteria were as follows: Presence of infection within 3 days before stroke onset; taking antibiotics, steroids, immunosuppressants and other drugs before admission; bridging therapy with intravenous rt-PA combined with subsequent endovascular therapy; comorbid tumors and immune system disorders; pregnant women, lactating and preparing for pregnancy; incomplete clinical data.
Clinical judgment of SAI: The disease was diagnosed as acute ischemic stroke by a clinical physician, and infections involving any organ system developed that occurred during hospitalization after disease onset. The diagnostic criteria for SAI were based on internationally accepted standards for defining healthcare-associated infections, specifically the CDC’s National Healthcare Safety Network criteria (Horan et al., 2008; Garner et al., 1988).
Data collection
2.2
A comprehensive panel of 42 clinical and biochemical variables was collected at admission, covering demographic characteristics, neurological symptoms and impairment, vascular risk factors, and routine laboratory indices (hematologic, coagulation, metabolic, renal, hepatic, and thyroid parameters). The complete list and descriptive statistics of these variables are presented in Table 1 (Baseline Characteristics).
Statistical analysis
2.3
Quantitative data following a normal distribution were compared using the t-test and expressed as mean ± standard deviation. Non-normally distributed data were compared using non-parametric rank-sum tests and expressed as medians and interquartile ranges. Categorical variables are expressed as counts and percentages and compared using the chi-square test. Univariate logistic regression was performed to screen potential risk factors for SAI, and variables with p < 0.05 were entered into a multivariate logistic regression model to identify independent predictors (reported as ORs with 95% CIs). To further assess robustness, a series of progressively adjusted multimodal logistic regression models were constructed. Model 1 included basic demographic and lifestyle factors: age, sex, smoking, alcohol use, hypertension, diabetes, and dyslipidemia. Model 2 added vascular comorbidities, including coronary heart disease and previous stroke, to the variables in Model 1. Model 3 further incorporated neurological severity and laboratory markers: National Institutes of Health Stroke Scale (NIHSS) at admission, mRS at admission, homocysteine (HCY), white blood cell count (WBC), neutrophil count (NEUT), neutrophil-to-lymphocyte ratio (NLR), PT, BUN, creatinine clearance (Ccr), aspartate aminotransferase (AST), free triiodothyronine (FT3), TSH. A nomogram was constructed from the final model to predict individual SAI risk, incorporating an optimal cut-off point (determined by maximizing the Youden index on the ROC curve) for risk stratification. Model performance was evaluated by discrimination AUC, and calibration (calibration plot and Hosmer-Lemeshow test). SAI was further categorized into pulmonary, urinary tract, multisite, and other infections for descriptive analysis. Analyses were conducted using SPSS 26.0 and R software, with two-sided p < 0.05 considered significant.
Results
3
Patient selection and cohort division
3.1
A patient categorization flowchart was created, depicting the enrollment of 836 patients receiving rt-PA-induced thrombolysis in the study (Figure 1). These patients were divided into a training cohort (n = 586, 70%) and a validation cohort (n = 250, 30%) at a ratio of 7:3. The training cohort was utilized for developing the prediction model, while the validation cohort was employed for model validation.
Flow diagram of patient enrollment for SAI in rt-PA-treated AIS patients. SAI, Stroke-associated infection; NI, No infection; rt-PA, Recombinant tissue-type plasminogen activator.
Clinical and economic features of SAI
3.2
Composition and distribution of SAI
3.2.1
In this study, a total of 836 patients were enrolled, with 668 patients (79.1%) presenting no infection (NI) and 168 patients (20.10%) with confirmed SAI during hospitalization, as illustrated in Figure 2A. Composition of 168 patients with SAI were: 99 patients with pulmonary infection (58.93%), 44 patients with upper respiratory tract infection (26.19%), 15 patients with UTI (8.93%), 2 patients with gastrointestinal tract infection (1.19%), 1 patient with periodontal infection (0.60%), 1 patient with conjunctival infection (0.60%), 1 patient with erysipela (0.60%) and 5 patients with multi-site infection (2.98%), including 4 patients with pulmonary infection plus UTI and 1 patient with pulmonary infection plus gastrointestinal tract infection (Figure 2B).
Composition and temporal dynamics of SAI in rt-PA-treated AIS patients. This figure presents the composition and temporal dynamics of SAI in rt-PA-treated AIS patients. (A) Shows the proportion of SAI and NI patients in the overall cohort of 836 patients. (B) Illustrates the distribution of infections types among 168 SAI patients, and multi-site infections (5, 2.98%). The 5 patients with multi-site infections included 4 cases of pulmonary infections combined with urinary tract infections, and 1 case of pulmonary infections combined with gastrointestinal tract infections. (C) Depicts the daily number of new SAI cases from admission (Day 1, defined as hospital admission) throughout the hospitalization period. (D) Illustrates the temporal dynamics of specific infection types (pulmonary, upper respiratory tract, urinary tract, and gastrointestinal tract), plotting the daily count of new cases against time post-admission (Day). SAI, Stroke-associated infection; NI, no infection; rt-PA, recombinant tissue-type plasminogen activator.
As shown in Figure 2C, among 168 SAI patients, the total number of infections presented a distinct temporal pattern. The number of infections was the highest on day 1 (0–24 h after admission), with 48 cases, then decreased steadily to 13 cases on day 4, followed by a slight rebound to 22 cases on day 5. After day 5, the number of infections continued to decline, maintaining a low level (<5 cases) from day 8 onwards. The dynamic changes in the number of SAI patients with different infection types over the disease course are shown in Figure 2D. Pulmonary infection was the most common type in the early stage (day 1), with 33 cases, followed by a gradual decrease. Upper respiratory tract infection showed a fluctuating trend, peaking at day 1 (11 cases) and day 5 (10 cases). Urinary tract infection and gastrointestinal tract infection occurred less frequently, with the highest number of cases being 5 and 1, respectively, and remained at low levels throughout the observation period.
Length of hospital stay and economic assessment
3.2.2
For length of hospital stay and economic outcomes, the SAI group had both a significantly longer median hospitalization duration [9 days, IQR (7, 10)] and higher median inpatient costs [28114.04 RMB, IQR (23230.12, 33379.85)] compared with the NI group [8 days, IQR (7, 9); 22292.84 RMB, IQR (19203.53, 25999.63)], with p < 0.001 for both comparisons (Table 2).
Risk factors for SAI
3.3
Comparison of baseline characteristics between cohorts
3.3.1
The baseline characteristics of patients in the training and validation cohorts are summarized in Table 1. The two cohorts were well balanced across demographic, clinical, and laboratory variables. These findings indicate that the training and validation cohorts were well matched.
Univariate analysis of potential predictors
3.3.2
Univariate logistic regression identified following variables significantly associated with SAI (p < 0.05), including NIHSS at admission, mRS at admission, age, sex, smoking, alcoholism, and certain laboratory variables, including HCY, WBC, NEUT, NLR, PT, BUN, Ccr, AST, FT3, and TSH (Table 3). These variables, all of which had variance inflation factor values < 10, were entered into multivariate logistic regression to determine independent predictors of SAI.
Multivariate logistic regression for independent predictors
3.3.3
Multivariate logistic regression was performed with variables above which were significant in the univariate analysis, and identified 5 factors as independent predictors for SAI, which included higher mRS at admission, male sex, prolonged PT, elevated BUN, and lower TSH (Table 4).
Multimodel logistic regression analysis
3.3.4
To further evaluate the robustness of the above 5 independent risk factors of SAI, multimodel logistic regression with progressive adjustments were performed (Table 5). Results showed that mRS at admission, sex, PT, BUN and TSH all remained independent significant predictors of SAI.
Development and validation of a predictive nomogram for SAI
3.4
Using the 5 independent predictors, a nomogram was developed to estimate the probability of SAI in AIS patients receiving rt-PA thrombolysis (Figure 3). Each predictor contributes points summed to generate an individual total score, corresponding to the predicted risk. The nomogram demonstrated good discrimination, with an AUC of 0.80 (Figure 4A), and satisfactory calibration, confirmed by the calibration curve and Hosmer-Lemeshow test (p = 0.811; Figure 5A). Internal validation using bootstrap resampling yielded consistent predictive performance (AUC 0.72; Figure 4B) and calibration (Figure 5B).
Nomogram for SAI prediction in rt-PA-treated AIS patients. This figure presents the nomogram developed to predict SAI in rt-PA-treated AIS patients. The nomogram incorporates several predictive factors, including mRS at admittance, PT, BUN, and TSH. For each variable, a corresponding point is assigned on the top point scale. The sum of these points yields a total points value, which is directly mapped to the predicted probability of SAI on the bottom probability scale. For clinical convenience, the total point range is divided into low risk and high risk zones (indicated on the figure), allowing immediate risk stratification at the bedside without further calculation. mRS, mRS at admittance; PT, prothrombin time, BUN, blood urea nitrogen; TSH, thyroid stimulating hormone.
ROC curves of SAI nomogram: Training (A) and validation (B) cohorts. ROC curves are plotted with sensitivity (true positive rate; y-axis, 0–1) on the ordinate and 1-specificity (false positive rate; x-axis, 0–1) on the x-axis, with the diagonal representing no discriminative ability (AUC = 0.5). (A) Training cohort (n = 586), AUC = 0.80, indicating good SAI case identification ability. (B) Validation cohort (n = 250), AUC = 0.72, indicating acceptable performance; the slight decrease may be due to sample size or variability. ROC: receiver operating characteristic, AUC: area under the curve.
Calibration curves of SAI nomogram: Training (A) and validation (B) cohorts. The calibration plot compares the predicted probability (x-axis, 0–1) with the observed probability (y-axis, 0–1), with an ideal 45-degree line indicating perfect consistency. (A) Training cohort (n = 586), showing the apparent (uncorrected) curve, the bias-corrected curve (adjusted for overfitting via 1,000 bootstrap resampling), and the ideal curve; mean absolute error = 0.017; Hosmer-Lemeshow goodness-of-fit test p = 0.811 (p > 0.05 = no significant calibration error). (B) Validation cohort (n = 250), curves similar; mean absolute error 0.021. Points close to the ideal line reflect accurate predictions; minimal bias confirms its reliability.
Discussion
4
This study comprehensively characterized SAI following intravenous thrombolysis in AIS patients and developed a nomogram-based prediction model. Five independent risk factors were identified: higher mRS at admissionore, male sex, prolonged PT, elevated BUN, and lower TSH. Unlike previous models focused primarily on stroke-associated pneumonia (Huang et al., 2019; Zhang et al., 2021; Wang et al., 2023), this study expands the prediction target to encompass the full spectrum of SAI, including pneumonia, urinary tract infection, upper respiratory tract infection, gastrointestinal infection, and less common sites such as periodontal, conjunctival, and cutaneous infections (Rocco et al., 2007). This comprehensive approach better reflects the systemic nature of post-stroke immunodepression and provides a more clinically relevant framework for infection risk assessment. Furthermore, by integrating routinely available clinical and laboratory parameters into an intuitive nomogram, this model offers a practical tool for early risk stratification that can inform targeted monitoring and preventive interventions in the hyperacute stroke setting.
The identification of higher admission mRS as a predictor of SAI is consistent with extensive evidence linking functional impairment to stroke-induced immunodepression (Westendorp et al., 2011; Chamorro et al., 2007). Severe neurological deficits compromise multiple protective mechanisms: impaired swallowing increases aspiration risk, reduced mobility promotes venous stasis and pressure ulcers, diminished cough reflex facilitates airway colonization, and autonomic dysregulation disrupts immune homeostasis (Meisel and Meisel, 2011; Finlayson et al., 2011). Importantly, recent investigations demonstrate that stroke severity directly correlates with the magnitude of systemic immunosuppression, as evidenced by lymphopenia, monocytic deactivation, and attenuated inflammatory responses (Prass et al., 2003; Chamorro et al., 2012). These converging lines of evidence support the biological plausibility of mRS as a robust predictor and underscore the importance of early functional assessment in infection risk stratification.
The increased SAI susceptibility in male patients aligns with emerging recognition of sex-specific immune responses following cerebral ischemia. Females generally exhibit more robust innate and adaptive immune activation, mediated partly through estrogen signaling and X-linked immune regulatory genes, whereas males demonstrate greater vulnerability to post-stroke immunodepression (Bravo-Alegria et al., 2017; Iadecola and Anrather, 2011). Mechanistic studies reveal sex differences in microglial activation patterns, T-cell trafficking, and cytokine profiles following ischemic injury in both experimental models and clinical populations (Anrather and Iadecola, 2016; Silva et al., 2023). Epidemiological analyses consistently report higher infection rates among male stroke survivors across diverse cohorts, independent of stroke severity and comorbidity burden (Reeves et al., 2008; Han et al., 2022). These findings provide both mechanistic rationale and empirical support for incorporating sex into infection risk prediction models and suggest potential value in sex-tailored prevention strategies.
The association between prolonged PT and SAI reflects the intricate interplay between coagulation activation and immune dysfunction in acute stroke. Prolonged PT may indicate impaired hepatic synthetic function, consumption coagulopathy, or systemic inflammatory stress—all conditions that compromise immune competence (del Zoppo and Gorelick, 2010; Kannemeier et al., 2007). The concept of “immunothrombosis” has emerged to describe the bidirectional crosstalk between hemostatic and immune systems, wherein coagulation proteases directly modulate inflammatory cell behavior and endothelial barrier function (Engelmann and Massberg, 2013). In the context of thrombolysis, tissue plasminogen activator may further perturb this balance through effects on the neurovascular unit, potentially exacerbating blood–brain barrier disruption and enhancing infection vulnerability (Liu et al., 2023; Miller et al., 2011). Large registry studies have documented associations between coagulation abnormalities and adverse outcomes including infectious complications following thrombolytic therapy (Wardlaw et al., 2014), supporting the clinical relevance of PT as a risk marker.
Elevated BUN emerged as a strong metabolic predictor, consistent with its established role as an integrative biomarker reflecting renal function, hydration status, and catabolic stress (Ugajin et al., 2012; Aronson et al., 2004). BUN elevation signals activation of neurohormoral pathways that impair immune resilience, including sympathetic nervous system activation and renin-angiotensin-aldosterone system upregulation (Kazory, 2010). The kidney-brain axis concept provides a unifying framework linking renal dysfunction to cerebrovascular disease burden through shared vascular vulnerabilities (Nam et al., 2024). Beyond impaired clearance, elevated BUN may reflect enhanced protein catabolism and metabolic derangement that directly compromise immune function in critically ill patients (Faura et al., 2021). Similarly, reduced TSH highlights the importance of neuroendocrine dysregulation in post-stroke infection susceptibility. Low TSH characterizes non-thyroidal illness syndrome (NTIS), reflecting hypothalamic–pituitary suppression during acute critical illness (Suda et al., 2018b; O'Keefe et al., 2015; Wu et al., 2025). Stroke-specific investigations have linked low FT3 levels to both mortality and post-stroke infections, suggesting thyroid hormone alterations serve as both illness severity markers and potential mechanistic contributors to immune dysfunction (Suda et al., 2016; Taroza et al., 2020). Recent evidence indicates that thyroid hormone status influences neutrophil function, T-cell proliferation, and cytokine production, providing biological mechanisms linking NTIS to infection risk (Bunevicius et al., 2015; Liu et al., 2018). Collectively, these metabolic and endocrine markers capture dimensions of physiological stress that complement traditional neurological severity assessments.
The clinical utility of the nomogram extends beyond mere risk prediction to support actionable decision-making in the acute stroke setting. Early identification of high-risk patients enables targeted implementation of evidence-based preventive measures, including intensified monitoring protocols, optimized oral care and swallowing assessment, early mobilization strategies where feasible, and judicious antimicrobial stewardship (Smith et al., 2015; Klehmet et al., 2009). Risk stratification can inform resource allocation decisions, such as level of care assignment and intensity of nursing surveillance, potentially improving efficiency of care delivery in resource-constrained environments (Katzan et al., 2007). Moreover, the model’s integration of routinely obtained admission variables facilitates rapid assessment without requiring specialized testing or delays, making it particularly suited for implementation in time-sensitive thrombolysis workflows (Su et al., 2025). Future investigations should evaluate whether nomogram-guided care protocols can reduce SAI incidence, shorten hospital stays, and improve functional outcomes compared to standard care approaches. The potential for this tool to support precision medicine approaches in stroke care—wherein preventive interventions are tailored to individual risk profiles—represents an important avenue for translating predictive models into improved patient outcomes (Cao et al., 2025; Powers et al., 2019).
Several limitations warrant acknowledgment. First, as a single-center prospective cohort study, external validation in geographically and demographically diverse populations is essential to confirm generalizability and assess performance across different healthcare settings with varying infection surveillance practices and antimicrobial stewardship protocols. However, the large sample size, comprehensive phenotyping, and use of routinely collected variables enhance the likelihood of model transportability. Second, the study did not incorporate dynamic biomarkers measured serially during hospitalization, such as C-reactive protein trajectories, procalcitonin kinetics, or longitudinal immune cell profiling, which might further enhance predictive accuracy. Nonetheless, the model’s reliance on admission variables provides practical advantages for early risk stratification before such dynamic markers become available. Third, while traditional logistic regression offers interpretability advantages and facilitates clinical implementation through nomogram visualization, emerging machine learning approaches might capture complex nonlinear relationships and interactions among predictors. Future work incorporating advanced algorithms with appropriate validation strategies could potentially improve discrimination, though interpretability and clinical acceptability must be carefully balanced against incremental performance gains. Fourth, the study did not assess the impact of specific preventive interventions or infection control measures on SAI occurrence, limiting causal inference regarding modifiable factors. Prospective implementation studies are needed to determine whether nomogram-guided care protocols influence infection rates and outcomes. Finally, long-term outcomes including disability, quality of life, and economic burden were not evaluated. Despite these limitations, this study provides a clinically relevant tool addressing an important gap in post-thrombolysis care and establishes a foundation for future validation and implementation research.
Conclusion
5
A comprehensive profile of SAI following intravenous rt-PA thrombolysis was delineated, including the distribution of infection types and their clinical characteristics. Five independent risk factors—mRS, sex, PT, BUN, and TSH—were identified as contributors to SAI risk. Based on these parameters, a nomogram was constructed to enable early prediction of SAI in individuals with acute ischemic stroke undergoing thrombolysis. This tool enables early risk stratification, facilitates targeted preventive strategies, and has the potential to reduce infection incidence, hospitalization duration, and associated healthcare burden. Future studies are warranted to externally validate the model and assess its impact on clinical outcomes.
The reference list from the paper itself. Each links out to its DOI / PubMed record.
- 1Anrather J. Iadecola C. (2016). Inflammation and stroke: an overview. Neurotherapeutics 13, 661–670. doi: 10.1007/s 13311-016-0483-x, 27730544 PMC 5081118 · doi ↗ · pubmed ↗
- 2Aronson D. Mittleman M. A. Burger A. J. (2004). Elevated blood urea nitrogen level as a predictor of mortality in patients admitted for decompensated heart failure. Am. J. Med. 116, 466–473. doi: 10.1016/j.amjmed.2003.11.014, 15047036 · doi ↗ · pubmed ↗
- 3Bravo-Alegria J. Mc Cullough L. D. Liu F. (2017). Sex differences in stroke across the lifespan: the role of T lymphocytes. Neurochem. Int. 107, 127–137. doi: 10.1016/j.neuint.2017.01.009, 28131898 PMC 5461203 · doi ↗ · pubmed ↗
- 4Bunevicius A. Iervasi G. Bunevicius R. (2015). Neuroprotective actions of thyroid hormones and low-T 3 syndrome as a biomarker in acute cerebrovascular disorders. Expert. Rev. Neurother. 15, 315–326. doi: 10.1586/14737175.2015.1013465, 25673072 · doi ↗ · pubmed ↗
- 5Cao Y. Zeng X. Gou Y. Lu Y. Zhu D. Wang H. . (2025). Machine learning prediction models for stroke-associated pneumonia:Meta-analysis. Comput. Biol. Med. 195:110612. doi: 10.1016/j.compbiomed.2025.11061240570761 · doi ↗ · pubmed ↗
- 6ChamorroÁ. Meisel A. Planas A. M. Urra X. van de Beek D. Veltkamp R. (2012). The immunology of acute stroke. Nat. Rev. Neurol. 8, 401–410. doi: 10.1038/nrneurol.2012.98, 22664787 · doi ↗ · pubmed ↗
- 7Chamorro A. Urra X. Planas A. M. (2007). Infection after acute ischemic stroke: a manifestation of brain-induced immunodepression. Stroke 38, 1097–1103. doi: 10.1161/01.STR.0000258346.68966.9d, 17255542 · doi ↗ · pubmed ↗
- 8del Zoppo G. J. Gorelick P. B. (2010). Innate inflammation as the common pathway of risk factors leading to TI As and stroke. Ann. N. Y. Acad. Sci. 1207, 8–10. doi: 10.1111/j.1749-6632.2010.05762.x, 20955419 · doi ↗ · pubmed ↗