Risk prediction models for chemotherapy-induced nausea and vomiting: a systematic review and meta-analysis
Xuemei Xie, Hang Li, Yue Li, Han Fu, Yunqiong Wang, Jia Cheng

TL;DR
This study reviews and evaluates existing models for predicting chemotherapy-induced nausea and vomiting, finding them to have moderate accuracy but significant methodological flaws.
Contribution
The study systematically reviews and meta-analyzes CINV risk prediction models, highlighting their limitations and suggesting directions for improvement.
Findings
15 studies with 16 CINV models were reviewed, with AUC values ranging from 0.629 to 0.850.
Common predictors include age, gender, chemotherapy regimen, and history of nausea.
Models showed a pooled AUC of 0.74, indicating moderate discrimination but high risk of bias.
Abstract
To systematically review and critically appraise currently available risk prediction models for chemotherapy-induced nausea and vomiting (CINV). We searched nine electronic databases from inception to April 2025. Data extraction followed the CHARMS checklist. Risk of bias and applicability were assessed using the PROBAST tool, and reporting transparency was evaluated against the TRIPOD statement. 15 studies describing 16 distinct CINV risk prediction models were included. Reported area under the curve (AUC) values ranged from 0.629 to 0.850. Frequently incorporated predictors included age, gender, history of anticipatory nausea and vomiting, chemotherapy regimen, and number of chemotherapy cycles. All studies demonstrated a high risk of bias, primarily attributable to suboptimal data sources and inadequate reporting in the analytical domain. Meta-analysis of AUC values from eight…
Genes, proteins, chemicals, diseases, species, mutations and cell lines named across the full text — each resolved to its canonical identifier and authoritative record.
Click any figure to enlarge with its caption.
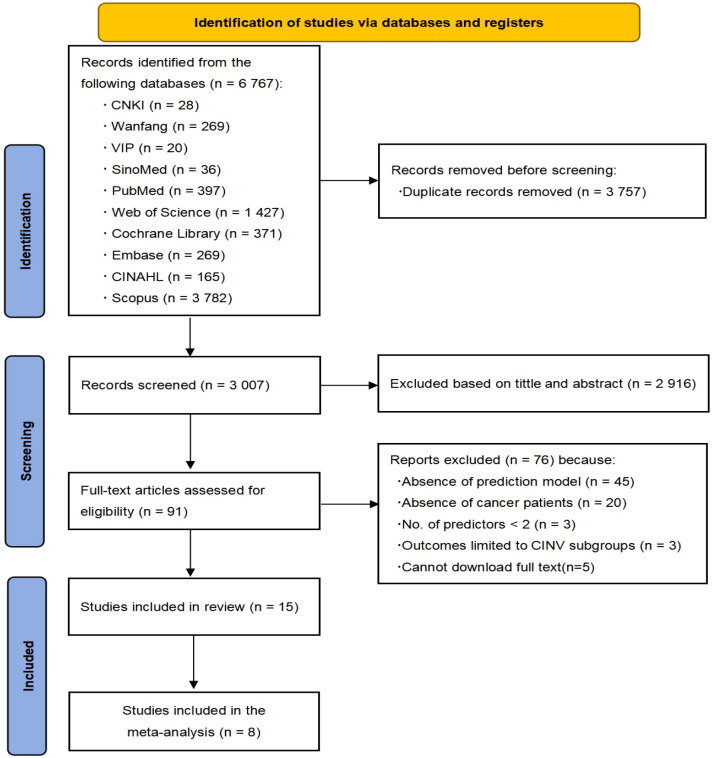 Figure 1
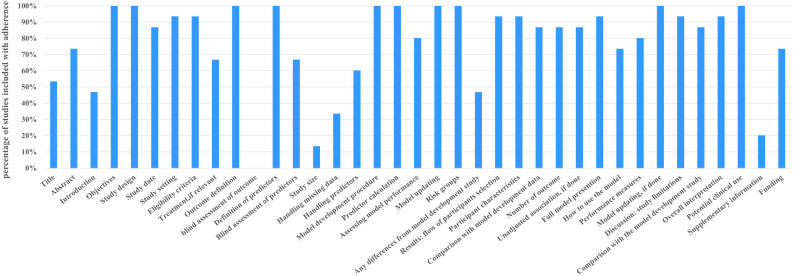 Figure 2
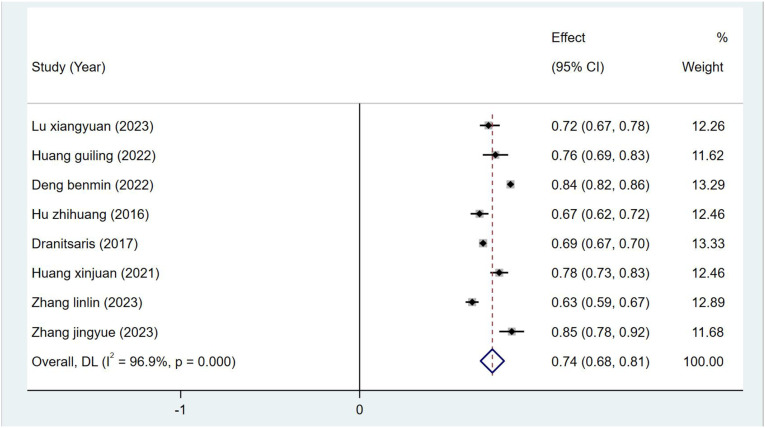 Figure 3
| Author (Year) | Country | Study design | Participants | Data source | Follow-up time | Main outcome | Model type | CINV cases (%) | Sample size |
|---|---|---|---|---|---|---|---|---|---|
| Lu xiangyuan* (2023) ( | China | Prospective cohort study | Breast cancer patients | Fujian provincial cancer hospital | Day 1 to day 7 after chemotherapy | CINV | Model development | 134(39.5%) | 339 |
| Huang guiling* (2022) ( | China | Prospective cohort study | Gastric cancer patients | Fujian provincial cancer hospital | Day 1 to day 5 after chemotherapy | CINV | Model development | 71(37.6%) | 189 |
| Zhang yuqing* (2023) ( | China | Prospective cohort study | Cancer patients | Second affiliated hospital of Xuzhou medical university | - | CINV | Model development | 134(41.9%) | 320 |
| Deng B (2022) ( | China | Prospective cohort study | Cancer patients | Chongqing 12 third class A hospitals | Day 1 to day 5 after chemotherapy | CINV | Model development | 639(28.8%) | 2215 |
| Cao zongping* (2021) ( | China | Prospective cohort study | Cancer patients | Second xiangya hospital central south university | Information during hospitalization and for 5 consecutive days after the end of chemotherapy. | CINV | Model development | A:131(43.7%) | 300 |
| Hu zhihuang (2016) ( | China | Prospective cohort study | Cancer patients | multi-institutional investigations in Asian countries | 1 Week | CINV | Model development and validation | C:204 (37.2%) | C:548 |
| Bouganim (2012) ( | Canada | Prospective cohort study | Cancer patients | Ottawa hospital cancer center | By 24-hour and 5-day telephone | CINV | Model validation | A:17(17.3%) | 98 |
| Mosa et al. (2020a) ( | USA | Retrospective study | Cancer patients | University of Missouri ellis fischel cancer center | - | CINV | Model development | A:1519(49.75%) | 6124 |
| Dranitsaris G (2017) ( | Canada | Retrospective study | Cancer patients | Outpatient service | The first 24 h and from days 2 to 5 following chemotherapy | CINV | Model development | 1771(42.2%) | 4197 |
| Molassiotis (2013) ( | UK | Prospective cohort study | Cancer patients | 16 cancer centers in the UK | 1 week before chemotherapy to 3 weeks before chemotherapy | CINV | Model development and validation | 148(44%) | 336 |
| Huang Xinjuan (2021) ( | China | Prospective cohort study | Breast cancer patients | Hunan cancer hospital, Hunan provincial maternal and child health care hospital | Days 2 and 6 after chemotherapy. | CINV | Model development and validation | C:137(41%) | C:334 |
| Zhang Linlin (2023) ( | China | Prospective cohort study | Cancer patients | Tianjin medical university general hospital, | Day 1 to day 15 after chemotherapy | CINV | Model development and validation | 563(42%) | 1356 |
| Dranitsaris G (2013) ( | Canada | Prospective cohort study | Cancer patients | Ottawa hospital cancer center, | Day 1 to day 5 after chemotherapy | CINV | Model validation | A:13(13.5%) | 97 |
| On J (2022) ( | Korea | Retrospective study | Cancer patients | Tertiary teaching hospital | - | Chemotherapy-induced ADRs | Model development | 685(73.3%) | 935 |
| Zhang jingyue (2023) ( | China | Retrospective study | Cancer patients | Tianjin medical university general hospital | Day 1 to day 14 after chemotherapy | CINV | Model development | 227(30%) | 756 |
| Author (Year) | Study type | ROB | Applicability | Overall | ||||||
|---|---|---|---|---|---|---|---|---|---|---|
| Participants | Predictors | Outcome | Analysis | Participants | Predictors | Outcome | ROB | Applicability | ||
| Lu xiangyuan* | A | − | + | + | − | − | + | + | − | − |
| Huang guiling* (2022) ( | A | − | + | + | − | − | + | + | − | − |
| Zhang yuqing* | A | + | + | − | − | + | + | + | − | + |
| Deng benmin* | A | + | + | − | − | + | + | + | − | + |
| Cao zongping* | A | + | ? | − | − | − | + | + | − | − |
| Hu zhihuang | B | + | + | − | − | + | + | + | − | + |
| Bouganim (2012) ( | C | + | + | − | − | + | + | + | − | + |
| Mosa et al. (2020a) ( | A | − | ? | − | − | + | + | + | − | + |
| Dranitsaris G | A | − | + | − | − | + | + | + | − | + |
| Molassiotis | B | + | + | − | − | + | + | + | − | + |
| Huang Xinjuan | B | − | + | − | − | + | + | + | − | + |
| Zhang Linlin | B | + | + | − | − | + | + | + | − | + |
| Dranitsaris G | C | + | + | − | − | + | + | + | − | + |
| Jeongah On | A | − | + | − | − | + | + | + | − | + |
| Zhang jingyue | A | − | + | − | − | + | + | + | − | + |
Peer Reviews
No public reviews on file for this paper yet. If you reviewed it on a platform where reviews are public (OpenReview, ICLR, NeurIPS, ICML), you can paste yours below so the community can read it here.
Videos
No videos yet. Explain this paper in a talk, walkthrough, or lecture? Add one.
Taxonomy
TopicsNausea and vomiting management · Enhanced Recovery After Surgery · Chemotherapy-related skin toxicity
Introduction
As reported by the International Agency for Research on Cancer (IARC), close to 20 million new cancer cases were recorded in 2022, and population-based forecasts suggest that the annual incidence of new cancer cases is anticipated to rise to 35 million by 2050, representing a 77% increase compared to 2022 (1). This significant escalation not only highlights the considerable threat that cancer poses to human health but also reinforces its position as one of the foremost causes of mortality globally, posing a substantial challenge to public health efforts worldwide (2, 3). Among the range of cancer treatment strategies, chemotherapy has become one of the major modalities because of its notable effectiveness and widespread use, offering hope for survival to numerous individuals battling cancer (4). Nevertheless, despite the therapeutic benefits of chemotherapy, it often leads to various adverse effects. One of the most prevalent reactions is chemotherapy-induced nausea and vomiting (CINV), which is frequently cited as one of the most distressing and alarming symptoms experienced by patients (5, 6). Research indicates that the likelihood of experiencing CINV during chemotherapy can reach as high as 60% to 80% (7–10). Severe episodes of nausea and vomiting may lead to malnutrition, dehydration, and disturbances in water and electrolyte balance, adversely affecting patients’ overall quality of life (11, 12). Additionally, some patients might experience anxiety, depression, and reduced compliance with treatment, which not only detracts from therapeutic efficacy but also increases the financial strain on patients, sometimes even leading them to abandon treatment altogether (13, 14).
At present, the main strategy in clinical settings for managing this symptom involves the administration of antiemetic medications as an intervention. Despite notable progress in the development of antiemetic drugs aimed at preventing and treating CINV, around 30% of cancer patients continue to experience inadequate relief from nausea and vomiting symptoms (15). In particular, controlling nausea symptoms, especially those related to delayed CINV (which occurs 24 to 120 hours post-chemotherapy), is still insufficient (16). This limitation arises because the current choice of preventive medication regimens for CINV largely depends on the emetic potential of the chemotherapy used, failing to take individual patient factors into account, which complicates the personalized management of CINV (17). The onset of CINV is influenced by various factors, and forecasting the likelihood of nausea and vomiting symptoms solely based on the emetic potential of chemotherapy lacks both scientific foundation and dependability, potentially resulting in the misuse of medications (17). Clinical guidelines advocate for a preventive strategy to handle CINV symptoms, employing a structured, time-sensitive, and combinatory approach for tailored treatment (18). Consequently, enabling timely and accurate predictions regarding CINV can greatly assist healthcare providers in implementing preventive measures, facilitating the formulation of precise and personalized antiemetic strategies for patients undergoing chemotherapy (38). Ultimately, this approach enhances the quality of life for patients, leads to improved treatment outcomes, and enriches their overall medical experience.
CINV risk prediction models integrate diverse predictors to estimate the likelihood of CINV occurrence, presenting complex data in a clinically interpretable format (19). These tools facilitate the identification of high-risk patients, providing clinicians with valuable insights for developing individualized management plans (20). While numerous CINV prediction models exist, reported predictive performance varies considerably, and a systematic assessment of their methodological quality, clinical applicability, and reporting transparency has been lacking. This systematic review therefore aims to identify and critically appraise existing CINV risk prediction models for cancer patients, offering a foundation for clinical implementation and future model development and validation.
Methods
This review adhered to the Preferred Reporting Items for Systematic Reviews and Meta-Analyses (PRISMA) guidelines (21) and is registered on PROSPERO (CRD42023395416). As a review incorporating meta-analysis, ethical committee approval was not required.
Search strategy
Searches were conducted in SinoMed, PubMed, Web of Science, The Cochrane Library, CINAHL, Embase, CNKI, Wanfang Database, and VIP from inception to April 20, 2025. Key search terms included: “chemotherapy induced nausea vomiting”, “chemotherapy nausea”, “chemotherapy vomiting”, “chemotherapy emesis”, “neoplasms”, “tumor”, “cancer”, “risk prediction model”, “risk factor”, “predictor”, “model”, “risk Score”. Detailed search strategies are provided in Supplementary Appendix A. Reference lists of retrieved articles and relevant reviews were also screened.
Inclusion and exclusion criteria
Inclusion criteria
(1) Study population: Cancer patients receiving chemotherapy. (2) Study focus: Development and/or validation of CINV risk prediction models (requiring ≥ 2 predictors). (3) Study design: Cohort, cross-sectional, or case-control studies.
Exclusion criteria
(1) Studies solely identifying risk factors without developing/validating a prediction model. (2) Articles not published in English or Chinese. (3) Conference abstracts, letters, news reports, reviews, editorials, or non-original research. (4) Unavailable full text.
Study selection
Two investigators (XMX and HF) independently screened retrieved records using Endnote X9. Duplicates were removed first. Titles and abstracts were then assessed for eligibility based on inclusion/exclusion criteria. Potentially eligible full texts were reviewed, and reference lists were scanned for additional studies. Disagreements were resolved through discussion between the two reviewers or consultation with a third author (JC).
Data extraction
A standardized data extraction form, adapted from the CHARMS checklist, was used independently by two reviewers. Extracted information included: (1) Basic information: Author, publication year, study design, participants, data source, sample size. (2) Model information: Variable selection method, model development technique, validation type, performance metrics (e.g., AUC), missing data handling, continuous variable processing, final model predictors, model presentation format. Cross-checking ensured accuracy and consistency. The extraction template is detailed in Supplementary Appendix B.
Quality assessment
To evaluate the quality and potential bias risk of the included studies, two assessment tools were employed: the Grading of Recommendations Assessment, Development, and Evaluation (GRADE) (22) and the available version of the Prediction model Risk Of Bias Assessment Tool (PROBAST) (23). (Supplementary Appendix C). Transparent Reporting of a Multivariate Prediction Model for Individual Prognosis or Diagnosis (TRIPOD) (24) for reporting transparency (Supplementary Appendix D).
Data analysis
Meta-analysis of the area under the curve (AUC) for validated models was performed using Stata 17.0. Heterogeneity was quantified using the I^2^ statistic and the Cochrane Q test (I² values: 25% low, 50% moderate, 75% high heterogeneity) (25). Fixed-effects or random-effects models were applied based on the level of heterogeneity observed. Publication bias was assessed using Egger’s test, where a p-value > 0.05 suggests a low likelihood of bias (26).
Result
Study selection
6767 literature were obtained through database search. After the initial screening of removing duplicates, reading titles and abstracts, 6673 articles were excluded. 91 studies were underwent full-text review. 45 studies were excluded for lacking a prediction model (risk factor studies only), 20 studies for inconsistent populations, three studies had less than two predictors, three studies had outcomes limited to subgroups, and five studies could not download the full text. 15 studies describing 16 models were ultimately included. The PRISMA flowchart (Figure 1) details the selection process.
Flowchart of study inclusion.
Study characteristics
The 15 included studies (20, 27–40) comprised 12 model development studies, 2 validation studies, and 1 model optimization study. Nine studies originated from China (5 published in Chinese), three from Canada, and one each from the USA, UK, and South Korea. 11 studies employed prospective designs, four were retrospective. In terms of participants, one study was only in patients undergoing chemotherapy for gastric cancer, two studies were only in patients undergoing chemotherapy for breast cancer, and the remaining 12 studies were in patients undergoing chemotherapy for cancer. 14 studies predicted CINV occurrence; one predicted broader chemotherapy-induced adverse drug reactions (ADRs). Sample sizes ranged from 97 to 6124. The detailed basic characteristics of the included studies are shown in Table 1.
Model information
The 16 identified models comprised two for acute CINV (0-24h), two for delayed CINV (25-120h), and twelve for non-specific CINV. Development methods included logistic regression (7 studies), machine learning (4 studies), and multiple generalized estimation equations (2 studies). Age (13 models) and history of CINV (11 models) were the most common predictors. Reported AUC or C-statistic values spanned 0.629 to 0.850. Calibration was reported for ten models, primarily using the Hosmer-Lemeshow test. Final models incorporated 4 to 19 variables and were presented as formulas, nomograms, risk scoring systems, or applications. Detailed information is shown in Supplementary Appendix E.
Model validation
Among the included studies, most models underwent internal or external validation. Among them, only three studies performed external validation, eight studies performed internal validation, while the models by Huang et al. (33) and Hu et al. (31) included both internal and external validation. The model developed by Deng and Zhang (20, 40) did not undergo any validation after its development.
Quality evaluation
Risk of bias assessment (PROBAST)
All studies were rated as having a high overall risk of bias, indicating methodological deficiencies in development or validation. The PROBAST results of the included studies are detailed in Table 2.
In the participant domain, a total of seven studies were categorized as high risk, while four studies were assessed as potentially biased due to possible recall bias or misclassification of outcome events in retrospective research. Additionally, certain crucial predictors related to the development of CINV in patients receiving cancer treatment may not have been adequately documented in medical records or may have been influenced by the inconsistency in training among assessors (30, 36–38). Three studies focused narrowly on specific cancers. Two were only for breast cancer chemotherapy patients (33, 34) and one was only for gastric cancer chemotherapy patients (32). Within the predictor domain, bias risk was unclear for two studies due to uncertain blinding during predictor assessment (28, 36). In the outcome domain, Three studies were high risk for not specifying the interval between predictor assessment and outcome evaluation (36, 37, 40). Eleven studies included previous history of nausea and vomiting as a predictor, rated high risk as this may inflate predictor-outcome associations and model performance estimates. One study lacked blinding between predictor and outcome assessment (39).
In the analysis domain, all studies demonstrated high risk. Key issues included: (1) Seven development studies had insufficient sample sizes (<20 events per variable (EPV)); two validation studies had <100 cases. (2) Seven studies categorized continuous variables without justification. (3) Nine studies failed to report missing data; six excluded missing cases entirely, risking bias. (4) Eight studies used univariate screening for variable selection. (5) Five studies omitted reporting model calibration or discrimination assessment. (6) Two studies did not report or consider the risk of bias due to overfitting, underfitting and best-fitting of the prediction model. (7) Two studies failed to report on internal validation.
In the model applicability domain, three studies were classified as high risk and the remaining studies as low risk. Because three studies were considered to be at high risk of applicability in the study area, two studies included participants limited to breast cancer and one study included participants limited to gastric cancer.
Transparent reporting assessment (TRIPOD)
In terms of transparent reporting assessment, a systematic evaluation of the included 15 studies was conducted based on the TRIPOD statement (Figure 2). The results showed that the total TRIPOD scores of these studies ranged from 21 to 31 (out of a maximum of 37 points). Among all 37 reporting items, six items had a transparent reporting completeness rate below 50%. From low to high, they were blind assessment of outcome, study size, supplementary information, handling missing data, any differences from model development study, and introduction. Objectives, study design, outcome definition, definition of predictors, model development procedure, predictor calculation, and potential clinical use had 100% transparency reporting completeness rate. Detailed information is shown in Supplementary Appendix F.
Included studies were assessed according to the TRIPOD.
Meta-analysis of development models included in the review
Due to insufficient reporting on development details in some studies, only eight studies were suitable for meta-analysis. The pooled AUC, calculated using a random-effects model, was 0.74 (95% CI: 0.68-0.81) (Figure 3). The I^2^ value was 96.9% (P < 0.001), indicating a high degree of heterogeneity among the studies. Begg’s test (P = 0.621 > 0.05), and Egger’s test (P = 0.930 > 0.05) suggesting no statistically significant publication bias. Detailed information can be found in Supplementary Appendix G.
Forest plot of the random effects meta-analysis of pooled AUC estimates for 8 development models.
Subgroup analysis to explore heterogeneity
To explore the potential sources of high heterogeneity observed in the meta-analysis, we performed subgroup analyses based on chemotherapy regimen emetogenicity, cancer type, model development method, and CINV definition and assessment tool. The analysis revealed that heterogeneity was markedly reduced or absent in more homogeneous subgroups. Specifically, studies focusing solely on patients receiving moderately emetogenic chemotherapy (I²= 0.0%, P = 0.379) or highly emetogenic chemotherapy (I²= 0.0%, P = 0.788) demonstrated negligible heterogeneity, suggesting that variations in chemotherapy emetogenicity are a major contributor to the overall heterogeneity. Similarly, models developed using the GEE method and the models only for breast cancer patients showed low heterogeneity. In contrast, high heterogeneity persisted in subgroups encompassing mixed cancer types, diverse chemotherapy regimens, or studies using multivariable logistic regression or the CINV assessment tool. Detailed information is shown in Supplementary Appendix H.
Discussion
As a principal method for tumor treatment, chemotherapy typically offers beneficial outcomes, albeit with a range of adverse effects. One of the most significant side effects for patients is CINV (41). Accurate prediction and effective prevention of CINV are therefore crucial, not only for improving patients’ quality of life and overall treatment outcomes but also for guiding rational clinical drug use and optimizing healthcare resource allocation (42). This systematic review comprehensively evaluates the methodological quality and predictive performance of existing CINV risk prediction models, aiming to provide direction for future research.
This review included 15 studies involving 16 CINV risk prediction models. These models demonstrated fair to good discriminatory ability during their development or validation phases, with reported AUC values ranging from 0.629 to 0.843. However, assessment using the PROBAST indicated that all included studies were judged to be at a high risk of bias. The bias primarily stemmed from the analysis domain, manifesting in issues such as insufficient sample size, suboptimal methods for variable selection, and inadequate handling of missing data and continuous variables (20, 27, 28). Concurrently, transparent reporting assessment to the TRIPOD guidelines revealed shortcomings in reporting key methodological details across all studies, which further increases the uncertainty of the model results and limits their generalizability (24).
To further quantify the overall performance of the models, we conducted a meta-analysis of the AUC from 8 development models. The results showed a pooled AUC of 0.74 (95% CI: 0.68-0.81). This value suggests that the existing models possess moderate predictive performance overall, yet its interpretation demands considerable caution. The reasons are twofold. Firstly, the meta-analysis revealed substantial heterogeneity. Further subgroup analysis indicated that this heterogeneity mainly originated from the diversity in clinical contexts and methodologies across studies, particularly differences in the emetogenicity levels of chemotherapy regimens (20, 38). In subgroups containing only highly or moderately emetogenic chemotherapy regimens, the heterogeneity became negligible. This strongly indicates that the predictive performance of the models is highly dependent on the specific treatment context (34). Consequently, the pooled AUC value should be regarded more as a reference reflecting an “average” or “optimistic upper limit” of the models’ discriminatory ability, rather than a reliable performance metric universally applicable to all clinical scenarios (43). Secondly, the widespread high risk of bias seriously undermines the credibility of this pooled estimate. Biasing factors such as the risk of overfitting due to small sample sizes (28, 32, 34), the simple exclusion of cases with missing data (31, 32, 40), the loss of information caused by inappropriate categorization of continuous predictors (30, 33, 39), and the prevalent reliance on univariate statistical significance for variable selection (20, 28, 34, 36) can all lead to an overestimation of model performance on development data and significantly limit their applicability to new populations. Therefore, considering both the high heterogeneity and high risk of bias, there is currently no sufficiently robust CINV prediction tool ready for direct and widespread clinical application (37). Existing models are better viewed as promising yet methodologically immature prototypes, whose efficacy and interpretation are highly dependent on the specific development context (44).
Despite these limitations, insights from the PROBAST assessment indicate that current studies still offer valuable experience and clear directions for improvement in developing more reliable prediction models. On the methodological front, future research must strictly adhere to best practices in prediction model studies. Ensuring an adequate sample size and a sufficient events-per-variable ratio is fundamental to preventing overfitting and enhancing model stability (39, 45, 46). For variable handling, robust methods such as multiple imputation should be employed for managing missing data, and arbitrary dichotomization of continuous predictors should be avoided (32, 47, 48), as such categorization leads to information loss and diminished predictive power (36, 49, 50). Variable selection strategies should move beyond simple univariate screening, with greater emphasis placed on the assessment and reporting of model calibration (20, 49, 51). Most critically, models must undergo rigorous external validation, preferably in populations that differ from the development cohort, to genuinely assess their generalizability and clinical transportability (39, 43, 52). Regarding the choice of modeling techniques, while logistic regression remains predominant, machine learning techniques have been explored by researchers such as Cao et al., Mosa et al., Zhang et al., and Jeongah et al. Machine learning methods often outperform traditional logistic regression in capturing complex patterns (53, 54) and may address challenges encountered in some studies, such as sample size constraints and complex interactions among predictors (28). However, the prevalent “black-box” nature of current machine learning models poses significant interpretability challenges. Consequently, the design, deployment, and iterative integration of explainable artificial intelligence principles should be emphasized within the development workflow (55). In summary, the choice of methodology should ultimately be driven by the specific clinical question, data characteristics, and practical requirements for model interpretability.
Furthermore, to enhance the clinical translational value of the models, future variable selection can be deeply integrated with evidence from real-world clinical studies (56). This review highlights common predictive factors such as age, sex, and prior history of CINV, which align with clinical experience and existing guidelines (40, 57–59). However, recent observational studies focusing on vulnerable populations have revealed more nuanced and potentially modifiable predictors. For example, a retrospective analysis by Yao et al. in elderly gynecological cancer patients not only confirmed the role of treatment-related factors like chemotherapy regimen and antiemetic prophylaxis but also identified pre-chemotherapy anxiety levels and sleep duration as modifiable independent predictors (56). This underscores the necessity of incorporating psychosocial factors and lifestyle indicators, especially in elderly populations. Additionally, the inclusion of body mass index (BMI) as a predictor by Mosa et al. (36) is consistent with findings from real-world study like Kawazoe et al. (60). Emerging evidence on genetic factors such as AB-CB1 gene, dopamine D2 receptor gene, serum 5-hydroxytryptamine 3C receptor gene, and catechol-o-methyltransferase gene polymorphisms (61) and laboratory markers such as serum sodium levels (62) also provides new directions for improving model precision. Future model development should prioritize the integration of these patient-specific variables supported by real-world evidence (39, 56). Leveraging advanced modeling techniques like machine learning to handle nonlinear interactions among multi-dimensional predictors can help bridge the gap between algorithm-driven model development and clinically evidence-based risk factor research, thereby enhancing the models’ accuracy, clinical relevance, and practical utility (63, 64).
It is important to note that the risk prediction models included in this study cover acute, delayed, and non-specific models. Although all are used for predicting CINV risk, each has its own strengths, weaknesses, and applicable scenarios. Acute CINV models allow risk assessment before chemotherapy, facilitating the formulation of individualized prevention strategies (28), However, their predictive accuracy can be limited by individual variability and data constraints (29). Delayed CINV models focus on the high-risk period 2-5 days after chemotherapy, addressing the prediction gap in the post-treatment phase (27), yet they similarly face challenges regarding prediction accuracy and data availability (28). Non-specific CINV risk prediction models integrate risks for both acute and delayed events, better aligning with the need for comprehensive clinical management (30), though their complexity may limit bedside application. In clinical practice, model selection requires comprehensive consideration of their features and individual patient circumstances. It is essential to emphasize that these models serve only as reference tools for healthcare providers and patients, not as sole bases for decision-making.
Limitations
There are certain limitations to this review. Firstly, the inclusion of studies published only in English and Chinese may introduce language bias. Secondly, the heterogeneity and limited number of development models included in the meta-analysis represent another limitation. Finally, methodological shortcomings and incomplete reporting transparency in the original studies, as identified by the PROBAST and TRIPOD assessments, further constrained the depth of our analysis and may introduce additional biases.
Conclusion
This systematic review evaluated 15 studies encompassing 16 CINV risk prediction models. Existing CINV risk prediction models demonstrate moderate predictive performance. However, their clinical application value is limited by high heterogeneity, a pervasive high risk of bias, and insufficient integration of predictors with real-world evidence. Future research needs to focus on methodological optimization, including ensuring adequate sample size, standardizing variable handling and missing data management, strengthening external validation, integrating clinically validated predictors from real-world settings especially modifiable factors in vulnerable populations and balancing model predictive performance with clinical interpretability. These efforts are essential for developing more reliable and practical individualized CINV risk prediction tools.
The reference list from the paper itself. Each links out to its DOI / PubMed record.
- 1Bray F Laversanne M Sung H Ferlay J Siegel RL Soerjomataram I . Global cancer statistics 2022: GLOBOCAN estimates of incidence and mortality worldwide for 36 cancers in 185 countries. CA Cancer J Clin. (2024) 74:229–63. doi: 10.3322/caac.21834, PMID: 38572751 · doi ↗ · pubmed ↗
- 2Franzoi MA Di Meglio A Michiels S Gillanders E Gaudin C Martin AL . Patient-reported quality of life 6 years after breast cancer. JAMA Netw Open. (2024) 7:e 240688. doi: 10.1001/jamanetworkopen.2024.0688, PMID: 38421653 PMC 10905303 · doi ↗ · pubmed ↗
- 3Naghavi M Abajobir A Abbafati C . Global, regional, and national age-sex specific mortality for 264 causes of death 1980-2016: a systematic analysis for the Global Burden of Disease Study 2016. Lancet. (2017) 390:1151–210. doi: 10.1016/S 0140-6736(17)32152-9, PMID: 28919116 PMC 5605883 · doi ↗ · pubmed ↗
- 4Stine ZE Schug ZT Salvino JM Dang CV . Targeting cancer metabolism in the era of precision oncology. Nat Rev Drug Discov. (2022) 21:141–62. doi: 10.1038/s 41573-021-00339-6, PMID: 34862480 PMC 8641543 · doi ↗ · pubmed ↗
- 5Heckroth M Luckett RT Moser C Parajuli D Abell TL . Nausea and vomiting in 2021: A comprehensive update. J Clin Gastroenterol. (2021) 55:279–99. doi: 10.1097/MCG.0000000000001485, PMID: 33471485 PMC 7933092 · doi ↗ · pubmed ↗
- 6Hernandez Torres C Mazzarello S Ng T Dranitsaris G Hutton B Smith S . Defining optimal control of chemotherapy-induced nausea and vomiting-based on patients’ experience. Support Care Cancer. (2015) 23:3341–59. doi: 10.1007/s 00520-015-2801-y, PMID: 26108169 · doi ↗ · pubmed ↗
- 7Al Qadire M . Chemotherapy-induced nausea and vomiting: Incidence and management in Jordan. Clin Nurs Res. (2018) 27:730–42. doi: 10.1177/1054773817704586, PMID: 28388860 · doi ↗ · pubmed ↗
- 8Hesketh PJ . Chemotherapy-induced nausea and vomiting. N Engl J Med. (2008) 358:2482–94. doi: 10.1056/NEJ Mra 0706547, PMID: 18525044 · doi ↗ · pubmed ↗