Au42(PET)32 Nanocluster Sensitizer Unlocks the Annihilator Potential of Rubrene, Enabling High‐Performance NIR‐to‐Visible Photon Upconversion
Masaaki Mitsui, Shinjiro Takano, Tatsuya Tsukuda

TL;DR
A new gold nanocluster enables efficient conversion of near-infrared light to visible light using rubrene, achieving record performance in photon upconversion.
Contribution
Au42(PET)32 nanocluster is introduced as a highly effective sensitizer for rubrene-based photon upconversion with record quantum yields.
Findings
Au42(PET)32 enables 21.4% upconversion quantum yield under 808 nm excitation.
The system achieves 15.0% upconversion quantum yield under 936 nm excitation.
The high spin-statistical factor of rubrene suggests a potential maximum upconversion efficiency of ~30%.
Abstract
Photon upconversion (UC) via triplet–triplet annihilation enables the conversion of near‐infrared (NIR) photons into visible light, offering opportunities for solar energy harvesting, photocatalysis, and biophotonics. However, progress has been limited by the lack of triplet sensitizers capable of fully exploiting rubrene, the representative annihilator/emitter for NIR‐to‐visible UC. Here, we report Au42(PET)32 (Au42 ; PET = 2‐phenylethanethiolate), a highly anisotropic, needle‐shaped gold nanocluster that unlocks the annihilator potential of rubrene, enabling high‐performance NIR‐to‐visible UC. The Au42 /rubrene pair achieves record‐setting UC quantum yields (Φ UC, 50% maximum) of 16.5% (reabsorption‐corrected quantum yield Φ UCg of 21.4%) with a low threshold intensity (I th) of 0.14 W cm−2 under 808 nm excitation and 12.3% (Φ UCg = 15.0%) under 936 nm excitation—over two orders of…
Genes, proteins, chemicals, diseases, species, mutations and cell lines named across the full text — each resolved to its canonical identifier and authoritative record.
Click any figure to enlarge with its caption.
 SCHEME 1
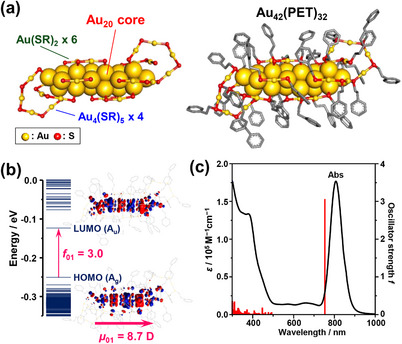 FIGURE 1
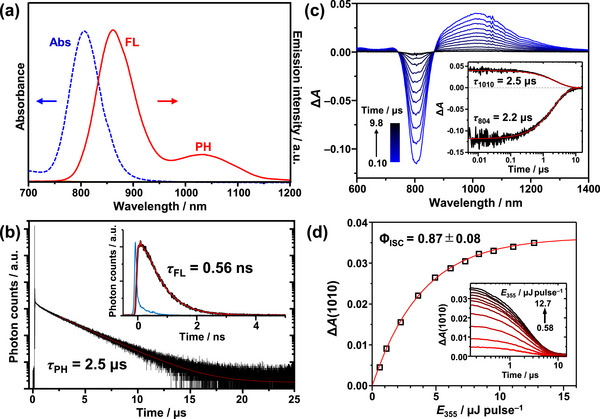 FIGURE 2
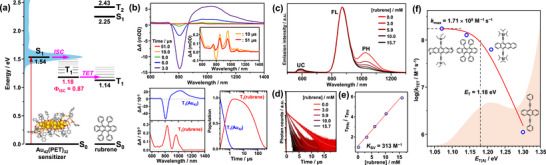 FIGURE 3
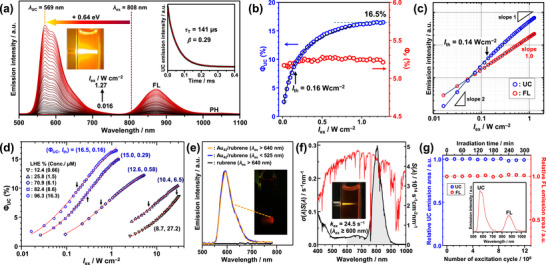 FIGURE 4
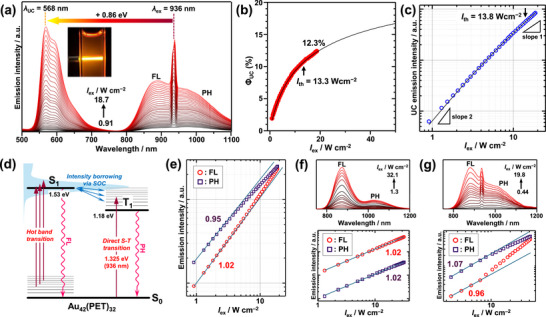 FIGURE 5
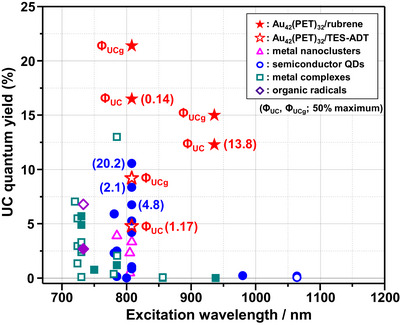 FIGURE 6
| Sensitizer | Annihilator |
|
|
|
| Δ |
|
|
|
|---|---|---|---|---|---|---|---|---|---|
|
| Rubrene (20 mM) | 808 | 0.87 | 0.86 | 0.58 ± 0.05 | 0.64 | 0.165 | 0.214 (0.775) | 0.14 (0.16) |
| 936 | 0.86 | 0.123 | 0.150 (0.820) | 13.8 (13.3) | |||||
| TES‐ADT (10.1 mM) | 808 | 0.87 | 0.81 | 0.35 ± 0.03 | 0.59 | 0.044 | 0.092 (0.478) | 1.17 (1.25) |
- —JSPS KAKENHI
- —Sumitomo Foundation10.13039/100008608
- —CREST10.13039/501100003382
- —Research Center for Computational Science, Okazaki, Japan
Peer Reviews
No public reviews on file for this paper yet. If you reviewed it on a platform where reviews are public (OpenReview, ICLR, NeurIPS, ICML), you can paste yours below so the community can read it here.
Videos
No videos yet. Explain this paper in a talk, walkthrough, or lecture? Add one.
Taxonomy
TopicsNanocluster Synthesis and Applications · Luminescence and Fluorescent Materials · Metal-Organic Frameworks: Synthesis and Applications
Introduction
1
Near‐infrared (NIR) light constitutes a significant fraction of the solar spectrum; however, most next‐generation photoactive systems—including perovskite and organic thin‐film solar cells as well as water‐splitting photocatalysts—are still unable to effectively utilize NIR photons owing to their limited or negligible light‐harvesting capabilities in this spectral region [1, 2, 3]. This fundamental constraint has stimulated growing interest in photon upconversion (UC) strategies, particularly triplet–triplet annihilation upconversion (TTA‐UC), which enables the conversion of low‐energy photons into higher‐energy emission even under low‐intensity, non‐coherent light conditions [4]. In TTA‐UC systems, rational pairing of triplet sensitizers with annihilators (emitters) is essential [5]. Owing to their versatility in combination, TTA‐UC has proven to be a highly adaptable approach for light‐energy conversion, allowing UC across a wide spectral range from the ultraviolet to the NIR depending on the chosen sensitizer–annihilator pair [5, 6, 7, 8, 9, 10, 11, 12, 13, 14, 15].
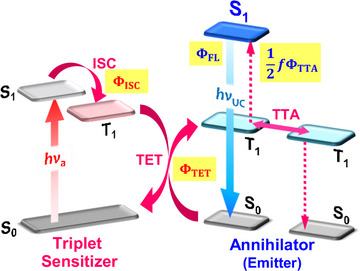
As illustrated in Scheme 1, the TTA‐UC mechanism begins when a sensitizer absorbs a long‐wavelength photon (hν a) to populate an excited singlet state (S 1), which undergoes intersystem crossing (ISC) to generate an excited triplet state (T 1). This triplet energy is subsequently transferred to a ground‐state annihilator via diffusion‐mediated triplet energy transfer (TET). Finally, two triplet‐excited annihilators undergo TTA, generating an excited singlet annihilator that emits a higher‐energy photon (hν UC). Since TTA is a bimolecular (two‐photon) process, the theoretical maximum of TTA‐UC quantum yield (Φ UC) is 50%. It can be expressed as:
where Φ ISC, Φ TET, and Φ TTA represent the quantum yields for ISC in the sensitizer, TET from the sensitizer to the annihilator, and TTA between annihilators, respectively. The f denotes the spin statistical factor, that is, the fraction of TTA events that generate an annihilator in the S 1 state. Φ FL is the fluorescence (FL) quantum yield of the annihilator in the UC sample solution. In addition to Φ UC, another key parameter defining TTA‐UC performance is the threshold excitation intensity (I th), which marks the transition of the excitation intensity dependence of UC emission from quadratic to pseudo‐linear behavior [16, 17]. From a practical standpoint, systems that exhibit both high Φ UC and low I th are highly desirable.
Mechanism of triplet–triplet annihilation photon upconversion (TTA‐UC), highlighting the quantum yields of the key photophysical processes.
In visible‐to‐visible TTA‐UC, several sensitizer–annihilator pairs have achieved Φ UC values exceeding 20% with I th below 0.1 W cm^−2^ in the liquid phase [7, 18, 19, 20, 21, 22, 23]. Extending such performance to the NIR‐to‐visible regime, however, remains a significant challenge. Recently, Φ UC values of 8%–10% have been reported in a few systems using semiconductor quantum dot (QD) sensitizers [24, 25]. However, most systems still exhibit significantly lower Φ UC values in solution (Table S1) [19, 26, 27, 28, 29, 30, 31, 32, 33, 34, 35, 36, 37, 38, 39, 40, 41, 42, 43, 44, 45, 46, 47, 48, 49, 50]. The current benchmark InAs‐QD/rubrene system achieves Φ UC = 10.6% and I th = 20.2 W cm^−2^ under 808 nm excitation [25], which is still far from the best visible‐range performances. An effective NIR‐responsive sensitizer must combine strong NIR absorption, a high Φ ISC, and long triplet lifetimes, while minimizing loss pathways such as back TET from the annihilator, Förster resonance energy transfer (FRET) from the S 1 annihilator, and reabsorption of upconverted photons. The creation of new sensitizers that meet these criteria would be a significant advancement in improving NIR‐to‐visible UC performance. On the annihilator side, high f, high Φ FL, and long triplet lifetimes are required. However, suitable annihilators for NIR‐to‐visible UC remain scarce, with rubrene being the most widely employed. Reported f values of rubrene vary considerably (0.155–0.60) [34, 35, 36, 50, 51, 52, 53], leaving the maximum achievable Φ UC for rubrene‐based systems uncertain. To date, almost all rubrene‐based TTA‐UC systems have shown Φ UC values below 8% (≤ f/2) [24, 25, 26, 27, 28, 29, 30, 31, 32, 33, 34, 35, 36, 37, 38], a limitation often attributed to the small f value (see Table S1) [34].
Recently, atomically precise metal nanoclusters (NCs) have emerged as promising triplet sensitizers, distinguished by efficient ISC (high Φ ISC) and microsecond‐scale triplet lifetimes [54, 55]. Their discrete energy levels and molecule‐like electronic structures, coupled with their tunable composition and surface ligation through core alloying or ligand exchange, enable precise control of both ISC and TET processes [54, 55, 56, 57, 58, 59, 60, 61, 62, 63, 64, 65, 66, 67, 68, 69, 70, 71, 72]. Nevertheless, the UC performance of NCs with spherical metal cores is inferior to that of visible‐to‐visible systems, as is the case with other sensitizers [22, 23, 57, 58, 59, 60, 61, 62, 63, 64, 65]. This shortfall stems from their limited NIR oscillator strengths and dominant absorption in the UV–visible region. Introducing anisotropic metal cores, in which the metallic framework extends along one dimension, offers an effective strategy to overcome this limitation. Recently, Jin and co‐workers developed a family of rod‐shaped gold NCs, Au_24+18_ * n *(PET)20+12 * n
- (**Au_24+18_
n * **; PET = 2‐phenylethanethiolate; n = 1–5), whose cores consist of (4n + 2) layers of triangular Au_3_ units stacked in a hexagonal close‐packed arrangement [73, 74]. In these AuNCs, the highest occupied molecular orbital (HOMO) and lowest unoccupied molecular orbital (LUMO) are delocalized across the anisotropic metal core. This results in a pronounced reduction of the HOMO–LUMO gap and the emergence of a large transition dipole moment along the long axis of the core. More recently, they reported that the shortest member of this series, the Au_42_(PET)32 (**Au_42_ **; n = 1) NC can serve as a triplet sensitizer for NIR‐to‐visible TTA‐UC when paired with the TES‐ADT (5,11‐bis(triethylsilylethynyl)‐anthradithiophene) annihilator [60]. However, the reported Φ UC for this combination was modest, at 3.35% (out of a maximum of 50%), leaving significant room for improvement.
In this study, we elucidate the previously unexplored photophysical properties of the **Au_42_ ** sensitizer, including its Φ ISC, triplet energy (E T), and unique red‐edge excitation behavior, and demonstrate its full potential as a triplet sensitizer for NIR‐to‐visible UC. Combining **Au_42_ ** with rubrene affords Φ UC values of 16.5% [reabsorption‐corrected value, that is, internal quantum yield Φ UCg, defined as the ratio of the number of UC photons generated to the number of photons absorbed by the sensitizer (#hν UC/#hν a), of 21.4%] under 808 nm excitation with a low I th of 0.14 W cm^−2^, and 12.3% (Φ UCg = 15.0%) under 936 nm excitation. These values were validated by accurately determining Φ UC using the prompt FL of **Au_42_ ** as an internal reference. Furthermore, the results disclose a substantial spin statistical factor of rubrene (f = 0.58), establishing the **Au_42_ **/rubrene pair as a new benchmark for NIR‐to‐visible UC systems.
Results and Discussion
2
Synthesis and Characterization
2.1
Details of the synthesis and characterization of **Au_42_ ** are provided in the Supporting Information. We adopted a recently developed controlled reduction method of Au(I)‐SR complexes to obtain highly anisotropic shapes [75, 76]. The method comprises two important points, including the use of sub‐stoichiometric amounts (4/5 eq.) of PET‐H ligand and reductant (1/6 eq.) relative to the Au(I) precursor and heat treatment of the crude product to obtain thermally stable products such as **Au_42_ **. In the optimized condition, **Au_42_ ** can be synthesized in 12% yield based on Au after chromatographic separation. Its chemical identity and purity were examined by elemental analysis, mass spectrometry, and optical spectroscopy (Figure S1). These characterization results indicate that the obtained **Au_42_ ** is the same as that reported by Jin and co‐workers using a different synthesis method [74].
Photophysical Properties
2.2
Figure 1a shows the geometric structure of **Au_42_ **. The **Au_42_ ** sensitizer features an Au_20_ core composed of six layers of triangular Au_3_ units stacked in a hexagonal close‐packed arrangement. This one‐dimensional Au_20_ core extension leads to pronounced delocalization of the HOMO (A_g_) and LUMO (A_u_) along the long axis, resulting in a significant reduction of the HOMO–LUMO gap (Figure 1b). Concomitantly, time‐dependent density functional theory (TD‐DFT) calculations for the optimized full structure of **Au_42_ ** (Figure S2) reveal an allowed S 0(A_g_) → S 1(A_u_) transition characterized by a pronounced transition dipole moment (μ 01 = 8.7) and a large oscillator strength (f 01 = 3.0), both predominantly oriented along the long axis of the Au_20_ core. These trends are consistent with the TD‐DFT results reported for Au_42_(SCH_3_)32, a simplified model of **Au_42_ ** [77, 78]. This anisotropic transition endows **Au_42_ ** with an intense, sharp S_0_–S_1_ absorption band centered near 800 nm, exhibiting a large molar extinction coefficient (ε 807 = 1.75 × 10^5^ M^−1^ cm^−1^) in toluene (Figure 1c and Figure S3). In contrast, it retains relatively high optical transparency in the 500–750 nm visible region. The resulting UV–vis absorption spectrum (Figure 1c) is identical to that reported for structurally characterized Au_42_(S‐CH_2_Ph)32, thereby confirming the formation of the anisotropic Au_20_ core [73, 74]. Collectively, these optical properties establish **Au_42_ ** as a highly promising sensitizer for NIR‐to‐visible UC, as it enables efficient harvesting of approximately 800 nm photons while simultaneously suppressing reabsorption of UC emission and FRET from yellow/orange emitters such as rubrene and TES‐ADT (Figure S4).
(a) Optimized structures of Au42(PET)32 (Au42 ; PET = 2‐phenylethanethiolate) obtained from DFT calculations. The right and left images show the structures with and without the Ph‐(CH2)2 moiety of PET, respectively (hydrogen atoms omitted). (c) The energy‐level diagram of the corresponding Kohn–Sham orbitals, including the oscillator strength (f 01) and transition dipole moment (μ 01) for the S 0 → S 1 (HOMO–LUMO) transition. (d) The experimental absorption spectrum of Au42 in toluene compared with the TD‐DFT calculated stick spectrum.
As shown in Figure 2a, **Au_42_ ** in deaerated toluene displays dual emission: FL at 861 nm with τ FL = 0.56 ns (Φ FL = 5.0%) and phosphorescence (PH) at 1033 nm with τ PH = 2.5 µs (Φ PH = 2.3%) (Figure 2b and Table S2). The transient absorption (TA) spectra exhibit ground‐state bleaching (GSB) centered at 807 nm and broad excited‐state absorption (ESA) around 1010 nm (Figure 2c), both decaying with the PH lifetime, confirming their origin from the T_1_ state. To evaluate Φ ISC, the excitation‐intensity dependence of the ESA signal at 1010 nm was analyzed under 355 nm excitation using the partial saturation method (Figure 2d) [79], yielding Φ ISC = 0.87 (±0.08). From τ FL = 0.56 ns, the ISC rate constant (k ISC) was estimated to be 1.6 × 10^9^ s^−1^. As suggested by the theoretical analyses, this moderate rate is explained by the relatively small spin‐orbit coupling matrix elements (< 100 cm^−1^) associated with the direct S 1 → T 1 ISC and the absence of higher‐lying *T_n_
- states [77, 78]. Nonetheless, the smaller FL radiative rate (k r ^FL^ = Φ FL/τ FL = 8.9 × 10^7^ s^−1^) and internal conversion rate (k IC = [1–(Φ FL+Φ ISC)]/τ FL = 1.4 × 10^8^ s^−1^) ensure efficient ISC, leading to the high Φ ISC observed for **Au_42_ **.
(a) Absorption (Abs) spectrum and emission spectrum comprising fluorescence (FL) and phosphorescence (PH) of Au42 in deaerated toluene. (b) Time‐resolved FL and PH decay profiles of Au42 (6µM). The fitting curve for the PH decay component is shown as a solid red line. Inset: FL decay curve (black) monitored at 880 ± 5 nm upon 805 nm excitation with the fitting curve (red) and the instrument response function (blue). (c) Transient absorption (TA) spectra of Au42 (6 µM) in deaerated toluene recorded from 0.10 µs to 9.8 µs after 410 nm excitation. Inset: TA kinetic traces at 804 and 1010 nm, along with their corresponding fits. (d) Pump power dependence of the TA traces at 1010 nm (inset) for Au42 (4 µM) in deaerated toluene, obtained 0.15 µs after the pump pulse. The solid line represents a least‐squares fit using Equation (S1).
Triplet Sensitization
2.3
In addition to a high ISC quantum yield (Φ ISC = 0.87), achieving a Φ TET close to unity is critically important for an effective triplet sensitizer (Figure 3a). To this end, we evaluated the ability of **Au_42_ ** to sensitize the triplet state of rubrene using TA spectroscopy. As shown in Figure 3b, the ESA decay of **Au_42_ ** is markedly accelerated upon the addition of 15 mM rubrene. Concomitantly, sharp ESA features corresponding to the vibronic progression of the rubrene T 1 → T 2 transition appear at 755, 846, and 960 nm (inset of Figure 3b); these features are entirely absent in the **Au_42_ **‐only system. Although rubrene is known to exhibit strong triplet–triplet (T–T) absorption below 530 nm [53], measurements in this spectral region were precluded by the complete absorption of the probe light by the high concentration of ground‐state rubrene. Moreover, the weak T 1 → T 2 absorption of rubrene overlaps with the intense ESA of **Au_42_ **, preventing direct observation of its rise dynamics. To overcome this limitation, we performed target analysis based on a kinetic model assuming TET from the T 1 state of **Au_42_ ** to rubrene (see Supporting Information for details). This analysis yielded the species‐associated spectra (SAS; Figure 3b, bottom left) and the corresponding time‐dependent concentration profiles (bottom right) for the T 1 states of **Au_42_ ** and rubrene. Both SAS faithfully reproduce the characteristic features of the experimental TA spectra, affording a TET rate constant of k TET = 1.67 × 10^8^ M^−1^ s^−1^ and a rubrene T 1 lifetime of 95 µs. These results unambiguously confirm the generation of rubrene triplets via sensitization by **Au_42_ **.
(a) Schematic energy‐level diagram illustrating the excited‐state relaxation pathways of Au42 , including the TET process from Au42 to rubrene. The numerical values indicate the energy levels of the excited states in eV relative to the ground state. (b) Time evolution of TA spectra of a deaerated toluene solution containing Au42 (6 µM) and rubrene (15 mM), recorded at selected delay times (top). The inset shows TA spectra at 10 µs and 51 µs. The species‐associated spectra (SAS; bottom left) and corresponding time‐dependent concentration profiles (bottom right) of T1(Au42) and T1(rubrene) are also shown. (c) Emission spectra of Au42 (6 µM) in toluene as a function of rubrene concentration. (d) Rubrene concentration dependence of the phosphorescence (PH) decay profiles of Au42 , overlayed with the corresponding fitting curves. (e) Stern–Volmer plot constructed from the PH lifetimes in panel d, with a linear fit used to determine the Stern–Volmer constant (K SV) and the TET rate constant (k TET). (f) Logarithmic plot of k TET for the Au42 donor as a function of the T 1 energy (E T(A)) of the aromatic acceptors. The solid line represents the fit based on the Sandros–Boltzmann equation.
As shown in the emission spectra (Figure 3c), progressive addition of rubrene selectively quenched the PH band and concomitantly reduced τ PH (Figure 3d). The Stern–Volmer plot of τ PH exhibited a linear dependence on rubrene concentration (Figure 3e), yielding a Stern–Volmer constant (K SV) of 313.2 (±10.7) M^−1^. The quenching rate constant (k q) was then calculated to be 1.25 × 10^8^ M^−1^ s^−1^ using the relation of k q = K SV/τ PH. The k q value thus estimated is in excellent agreement with the TA‐derived k TET value of 1.67 × 10^8^ M^−1^ s^−1^. This strong consistency confirms that the PH quenching proceeds exclusively through TET, without involving any intermediate states, such as a charge‐transfer (CT) state. Therefore, the obtained k q value (1.25 × 10^8^ M^−1^ s^−1^) corresponds to the intrinsic k TET. This conclusion is further supported by the large, positive Gibbs free energy changes (ΔG CT) calculated using the Rehm–Weller equation (Figure S5 and Table S3), which thermodynamically preclude any contribution from photoinduced CT processes.
It is noteworthy that the PH bands of metal NCs typically exhibit broad, featureless profiles lacking discernible vibronic structure. This makes it difficult to identify the exact position of the T 1 → S 0 origin transition. Consequently, accurate estimation of the T 1 energy (E T) from PH spectra is challenging. To address this issue and further evaluate the triplet sensitization capability of **Au_42_ **, Stern–Volmer analyses were performed for a series of acceptor molecules (Figure S6 and Table S4) [54]. Figure 3f plots log(k TET) against the T 1 energy of each acceptor molecule, E T(A). A pronounced increase in k TET was observed with increasing driving force for TET, defined as ΔE TET = E T—E T(A). Once ΔE TET exceeded zero, k TET approached a nearly constant value, indicative of saturation behavior. This dependence confirms the involvement of the TET mechanism, which has been widely reported for both organic molecules [80] and metal NCs [23, 54, 62, 63], and can be quantitatively described by the Sandros–Boltzmann equation [80]:
where k max represents the upper limit of k TET for the investigated system, and k B and T are the Boltzmann constant and absolute temperature, respectively. Fitting of the experimental data yielded an E T value of 1.18 (±0.02) eV and a k max of 1.71 × 10^8^ M^−1^ s^−1^ for **Au_42_ **. The T 1 energy derived in this manner coincided closely with the peak of the PH band (see Figure 3f). This agreement suggests that the maximum of the PH band corresponds closely to the T 1 → S 0 origin transition. This assignment is consistent with theoretical predictions that the structural rigidity of Au_42_(SCH_3_)32 leads to minimal geometric relaxation between these states [77, 78]. The broadening of the band around the 0–0 transition can be attributed to inhomogeneities associated with ligand conformations and the solvent environment, as well as strong electron–phonon coupling in **Au_42_ ** [81].
As shown in Figure 3a, the lowest triplet energy of **Au_42_ ** (1.18 eV) is slightly higher than that of rubrene (1.14 eV), providing an exothermic driving force of 0.04 eV for TET. This favorable alignment allows the **Au_42_ **/rubrene pair to exhibit a k TET value close to k max. However, the k TET value (1.3 × 10^8^ M^−1^ s^−1^) is two orders of magnitude smaller than the estimated diffusion‐limited rate constant (k d) in toluene (k d ∼1 × 10^10^ M^−1^ s^−1^) and falls within the typical range reported for metal NCs [54, 55]. This behavior can be explained by the localization of the hole and electron distributions of the T 1 state primarily within the Au_20_ core, which is protected by the Au(I)‐PET staple motifs (Figure 1b). The Au(I)‐PET staples act as a steric barrier, hindering Dexter‐type TET. Metal NCs with similar core‐localized T 1 states, such as [Au_25_(PPh_3_)10(PET)5_Cl_2]^2+^ [59], [Au_25–_ * x Ag x *(PPh_3_)10(PET)5_Cl_2]^2+^ [61], and [Au_25–_ * x Cu x *(PPh_3_)10(PET)5_Cl_2]^2+^ [59], exhibit comparable k TET values (∼1 × 10^8^ M^−1^ s^−1^). Since k TET for **Au_42_ ** with rubrene as the acceptor (k TET = 1.3 × 10^8^ M^−1^ s^−1^) is moderate and the PH lifetime (2.5 µs) is not particularly long, it is essential to increase the acceptor concentration to achieve efficient TET. Increasing the rubrene concentration to ∼20 mM could raise the Φ TET value to ∼0.9, enabling highly efficient triplet sensitization.
TTA‐UC Performance
2.4
Figure 4a shows the emission spectra of a deaerated toluene solution containing **Au_42_ ** (16.3 µM) and rubrene (20 mM, nearly the saturation concentration in toluene [27]) under continuous‐wave (cw) 808 nm laser excitation. Dynamic light scattering measurements performed under these concentration conditions confirmed the absence of detectable aggregate formation (Figure S7). All UC measurements were conducted using an “edge‐excitation” geometry, in which the excitation beam was introduced through the cuvette edge to minimize reabsorption effects by the sensitizer and annihilator (Figure S8). Under these conditions, the UC emission from rubrene was observed at ∼570 nm, corresponding to an anti‐Stokes shift (ΔE AS) of 0.64 eV. The inset of Figure 4a displays the UC decay profile, which was fitted using Equation (S10) based on a kinetic model describing TTA between rubrene triplets. The extracted UC decay time of 141 µs and β parameter of 0.29 are consistent with the rubrene triplet lifetime (∼100 µs), as determined by TA measurements. The UC decay time is more than four orders of magnitude longer than the prompt FL lifetime of rubrene in toluene (14 ns) [82]. This fact provides definitive evidence that the observed UC emission originates from delayed FL via the TTA‐UC mechanism.
(a) Excitation‐intensity (I ex)‐dependent emission spectra of deaerated toluene containing Au42 (16.3 µM) and rubrene (20 mM) under continuous‐wave 808 nm excitation. Inset: photograph under 808 nm laser irradiation without an optical filter. (b) UC quantum yield (Φ UC) and FL quantum yield (Φ FL), and (c) UC and FL intensities plotted as functions of I ex. (d) Dependence of Φ UC and I th on the concentration of Au42 with 20 mM rubrene. Arrows indicate the I th positions for each plot. (e) UC (orange) and prompt FL (blue) spectra of a deaerated toluene solution of Au42 /rubrene under AM1.5G 1‐sun illumination, recorded using long‐pass (> 640 nm) and short‐pass (< 525 nm) filters, respectively. A rubrene‐only (20 mM) solution showed no emission upon > 640 nm excitation (black). Inset: photograph of the corresponding UC emission. Note that the FL spectra of rubrene differ markedly from that observed in a dilute solution due to strong reabsorption effects. (f) Spectrum of σ(λ)S(λ) and integrated values from 600 to 1000 nm, along with the global standard AM1.5G spectrum. Inset: photograph of the observed UC emission under irradiation with an 808 nm laser of I ex = 1 mW cm−2. (g) Integrated UC and FL emission area as a function of excitation cycle number during continuous irradiation with an 808 nm laser (24 W cm−2) for a deaerated toluene solution containing Au42 (16 µM) and rubrene (20 mM). The total irradiation time was 300 min. The vertical axes for UC and FL were offset to avoid overlap of data points. Inset: time‐dependent emission spectra recorded during continuous irradiation.
Figure 4b illustrates the excitation‐intensity (I ex) dependence of Φ FL and Φ UC of the **Au_42_ **/rubrene system under 808 nm excitation. Notably, Φ FL of **Au_42_ ** remained nearly constant across the entire intensity range, averaging 5.22% (±0.08) (Table S2). Furthermore, the FL lifetime of **Au_42_ ** (0.56 ns) remained unaffected by the addition of rubrene (Figure S9), confirming that its FL properties are retained in the UC environment. The invariance of the **Au_42_ ** FL properties validates the use of its FL band as an internal reference to accurately quantify the Φ UC. Such an internal reference allows for measurements under strictly identical conditions, including absorbance, solvent refractive index, excitation intensity, and optical geometry, and simplifies the evaluation to [83]:
where S UC and S FL represent the integrated UC and FL intensities, respectively (Figure S10). Notably, this evaluation method enabled highly reproducible acquisition of high‐quality UC data, as evidenced by the very small scatter of data points, as can be seen in Figure 4b–d. As shown in Figure 4b, the I ex‐dependence of Φ UC exhibited a smooth increase followed by saturation, reaching 16.5%. This behavior was well reproduced using Equation (4), reported by Kamada and co‐workers [16]:
Fitting yielded an I th of 0.16 W cm^−2^. As shown in Figure 4c, the double‐logarithmic plot of FL intensity versus I ex exhibited a linear dependence on I ex with a slope of 1.0 across the entire measured range. In contrast, the UC intensity displayed the nonlinear behavior characteristic of TTA‐UC, with the slope changing from 2 to 1. This behavior was well reproduced by Equation (5) [16, 84]:
where K is an instrumental factor. Fitting with Equation (5) yielded an I th of 0.14 W cm^−2^, which is essentially identical to the value (0.16 W cm^−2^) obtained from fitting Equation (4).
To optimize the UC performance of **Au_42_ ** in combination with rubrene, we investigated the dependence of Φ UC and I th on the light‐harvesting efficiency (LHE) of **Au_42_ ** at the photon detection position (Figure 4d and Figure S8). The LHE is herein defined as LHE = 1–10^–^ * ^A^ * ^(^ * ^λ^ * ^ex)/2^, where A(λ ex) denotes the absorbance of the sensitizer at the excitation wavelength (λ ex). As LHE increased, Φ UC increased progressively while I th decreased markedly, demonstrating clear enhancement of UC performance. At low LHE values, I th was as high as 27.2 W cm^−2^ (LHE = 12.4%) and 6.5 W cm^−2^ (LHE = 25.8%). The limited output power of the excitation source prevented access to the saturation regime, resulting in low apparent Φ UC values. However, with LHE exceeding 80%, the pronounced reduction in I th enabled clear observation of Φ UC saturation behavior (Figure 4b). The best performance, with an exceptionally high Φ UC with a low I th, was obtained at the highest LHE of 96.3% (Figure 4a–g and Table 1).
Due to these outstanding UC properties, distinct UC emission was clearly observed when the optimized **Au_42_ **/rubrene solution was irradiated with a simulated AM1.5G 1‐sun spectrum (photograph in Figure 4e): the spectrum only included the spectral components above 640 nm, where rubrene exhibits negligible direct absorption. Under multicolor excitation conditions (λ ex ≥ 600 nm), the excitation rate of the **Au_42_ ** sensitizer was calculated to be 24.5 s^−1^, corresponding to I ex ≈ 10 mW cm^−2^ for monochromatic excitation at 808 nm. The photograph in Figure 4f shows that clear UC emission was also observed when the same solution was irradiated with 808 nm light at 1 mW cm^−2^. This further demonstrates the solar‐relevant operability of the **Au_42_ **/rubrene system. In addition, the present system exhibits exceptional photostability (Figure 4g). Under continuous high‐intensity 808 nm irradiation at 24 W cm^−2^ (corresponding to an excitation rate of 6.7 × 10^4^ s^−1^), both UC and FL intensities retained more than 99% of their initial values after over 10^9^ excitation cycles per single NC (300 min of irradiation), and the absorbance of **Au_42_ ** at 808 nm remained unchanged before and after the measurement. Collectively, these results unequivocally demonstrate the high robustness of the **Au_42_ **/rubrene pair under demanding excitation conditions.
Figure 5a shows the I ex‐dependence of the emission spectra obtained under cw 936‐nm excitation for the same **Au_42_ **/rubrene solution used in Figure 4a. At 936 nm, the LHE at the photon detection position was only 2.3% due to the small molar absorption coefficient (ε 936 = 2,340 M^−1^ cm^−1^), significantly smaller than that at 808 nm (96.3%). Despite the low LHE, a Φ UC of at least 12.3% was achieved (Figure 5b and Figure S11). Extrapolation of the fit using Equation (4) suggests that the saturated Φ UC value would approach that obtained under 808 nm excitation (∼17%). Under this red‐edge excitation condition, the I th value was 13–14 W cm^−2^ (Figure 5b,c), which is markedly higher than that for 808 nm excitation and reflects the significantly lower LHE at 936 nm. This trend is consistent with the relationship [16]:
where k TTA is the bimolecular rate constant for the TTA process and τ T(A) is the triplet lifetime of the annihilator.
(a) Dependence of the emission spectra of deaerated toluene solutions containing Au42 (16.3 µM) and rubrene (20 mM) on excitation intensity (I ex) under continuous‐wave 936 nm excitation. Inset: photograph of the same solution under 936 nm laser irradiation without an optical filter. (b) UC quantum yield (Φ UC) and (c) UC emission intensity plotted as functions of I ex. (d) A schematic energy‐level diagram illustrating the S 0 → S 1 hot‐band transition and the S 0 → T 1 transition in Au42 . (e) I ex‐dependence of the fluorescence (FL) and phosphorescence (PH) intensities of Au42 in the same mixed solution. (f, g) I ex‐dependent FL and PH spectra and intensities for a deaerated toluene solution of Au42 (15.4 µM) alone under (f) 808 nm and (g) 936 nm excitation.
Excitation at 936 nm (1.32 eV) corresponds to the S 1–T 1 energy gap region of **Au_42_ **, where vibrationally excited T 1 levels are directly accessible. As illustrated in Figure 5a, this excitation yields intriguing emission behaviors, including clear FL despite sub‐S 1 excitation energy and a markedly intensified PH band. Figure 5d shows that the FL likely arises from hot‐band transitions from vibrationally excited S 0 levels to S 1, while the PH reflects direct S 0 → T 1 transitions. These direct S–T transitions are enabled by intensity borrowing from the strongly allowed S 0 → S 1 transition via SOC, which becomes particularly prominent near the S 1 energy region [85]. Accordingly, the long‐wavelength tail of the first absorption band of **Au_42_ ** can be ascribed to triplet‐state contributions through strong S–T mixing. These transitions allow for the direct population of the T_1_ state, which is consistent with the distinct I ex‐dependencies of FL and PH under 808 nm and 936 nm excitation (Figure 5e–g). Under 808 nm excitation, both emissions increase linearly with I ex (slope = 1.02), whereas 936 nm excitation yields superlinear FL and sublinear PH dependencies. This reciprocal behavior is more pronounced in the **Au_42_ **‐only solution (Figure 5f,g), suggesting that TTA between two **Au_42_ ** triplets becomes active at I ex above ∼10 W cm^−2^. This process can enhance the delayed FL contribution, as shown in Figure S12. These results demonstrate that **Au_42_ ** itself possesses an intrinsic capability for TTA‐UC, highlighting its unique photophysical properties. However, it should be emphasized that this self‐TTA pathway remains a minor process in the **Au_42_ **/rubrene system. Given the extremely low concentration of **Au_42_ ** relative to rubrene (20 mM), together with the excellent agreement between the experimental data and Equations (4) and (5), which do not include loss terms (Figure 5b,c), we conclude that self‐TTA of **Au_42_ ** under 936 nm excitation does not significantly affect the overall TET and UC quantum yields.
Figure 6 compares the Φ UC values of the **Au_42_ **/rubrene system determined in this study with those of other NIR‐to‐visible UC systems reported previously. However, direct comparisons of the Φ UC values across different systems reported in literature are not straightforward because reabsorption behavior in concentrated annihilator solutions depends sensitively on the measurement setup (Figure S8) [34]. To make a fair comparison with the related **Au_42_ **/TES‐ADT system, we measured its UC performance using the optical setup and analysis procedures employed in this study. We determined the Φ UC value to be 4.4% (Figure S13), which is higher than the value determined by Jin and co‐workers (3.4%) using a center‐excitation setup [60]. Under 808 nm excitation, the **Au_42_ **/rubrene system achieved a Φ UC of 16.5% with a remarkably low I th of 0.14 W cm^−2^, far exceeding the previous benchmark of the InAs‐QD/rubrene pair (Φ UC = 10.6% and I th = 20.2 W cm^−2^) [25]. More strikingly, under 936 nm excitation, the **Au_42_ **/rubrene pair demonstrated a transformative advance, delivering Φ UC values of 12.3% even before reaching saturation. This performance dramatically surpasses those of all previously reported NIR‐to‐visible UC systems operating beyond 850 nm, where Φ UC values have remained below 0.1%. To facilitate comparison of the Φ UC values obtained with different setups, we estimated the reabsorption‐corrected Φ UC values (Φ UCg) using the procedure described in the Supporting Information (Figure S10). The Φ UCg values for the **Au_42_ **/rubrene pair reached 21.4% and 15.0% under excitation at 808 and 936 nm, respectively.
Comparison of UC quantum yields for Au42 with those reported for various sensitizers used in NIR‐to‐visible UC systems, including metal nanoclusters, semiconductor QDs, metal complexes, and organic radicals under excitation wavelengths above 700 nm. Filled symbols represent data obtained with rubrene annihilators [24, 25, 26, 27, 28, 29, 30, 31, 32, 33, 34, 35, 36, 37, 38], whereas open symbols correspond to other annihilators [19, 39, 40, 41, 42, 43, 44, 45, 46, 47, 48, 49, 86]. The values in parentheses indicate the threshold intensities (in W cm−2). Detailed experimental conditions, including solvents and annihilator concentrations for each system, are summarized in Table S1.
Insight Into Spin Statistical Factor of Rubrene
2.5
The spin statistical factor (f) is an intrinsic property of the annihilator molecule that imposes a theoretical upper limit on Φ UC when all other processes approach unity efficiency, expressed as Φ UC ≤ f/2. Reported f values of rubrene vary considerably (0.155–0.60), leaving the maximum achievable Φ UC for rubrene‐based systems uncertain [34, 35, 36, 50, 51, 52, 53]. Kazlauskas et al. estimated f = 0.155 from steady‐state measurements, suggesting that the generally low Φ UC values in rubrene‐based systems stem from this small f value [34]. Conversely, Schmidt et al. reported f ≈ 0.6 based on pulsed‐laser measurements [50, 51], and Bossanyi et al. rationally explained this high value as arising from a reverse ISC channel activated by the favorable energy level alignment S 1 (2.25 eV) < 2T_1_ (1.14 eV × 2) < T_2_ (2.43 eV) and the formation of weakly exchange‐coupled triplet pair states [53]. In this study, the f value of rubrene was experimentally determined using the reabsorption‐corrected UC quantum yield (Φ UCg) obtained by the internal reference method (Figure S10). To ensure reliability, each parameter in Equation (1) was independently and rigorously determined: (i) Φ ISC = 0.87 (±0.08) was obtained for **Au_42_ ** using a partial saturation method based on the excitation‐intensity dependence of the ESA signal (Figure 2d); (ii) Φ TET = 0.86 (±0.01) was calculated from the Stern‐Volmer constant under UC conditions (Figure 3e); (iii) Φ TTA ∼1 was confirmed by the linear power dependence of UC emission at the measurement intensity, signifying the TTA‐saturation regime (Figure 4c). When Φ UC in Equation (1) is replaced by Φ UCg, which corrects for inner‐filter effects, the Φ FL can be taken as that of a highly dilute rubrene solution (0.98) [87] rather than the value in the UC solution. Using Φ UCg = 0.214 ± 0.001 together with the determined parameters above, the spin statistical factor was calculated to be f = 0.58 ± 0.05. This value is in excellent agreement with that reported by Schmidt et al. and strongly suggests that rubrene annihilators are ideally capable of achieving Φ UCg values approaching ∼30%. Accordingly, the realized Φ UCg of 21.4% (corresponding to Φ UC = 16.5%) represents a significant leap toward the theoretical efficiency limit of rubrene‐based TTA‐UC systems.
Origin of High‐Performance TTA‐UC
2.6
Understanding why the **Au_42_ **/rubrene pair exhibits a markedly higher Φ UC than systems employing metal complexes or semiconductor QD sensitizers with rubrene [24, 25, 26, 27, 28, 29, 30, 31, 32, 33, 34, 35, 36, 37, 38] provides profound insight into the factors that govern NIR‐to‐visible UC performance. A key experimental observation is that the Φ FL of **Au_42_ ** remains constant under intense UC emission, which confirms negligible FRET from S 1‐rubrene to **Au_42_ **. This finding is supported by quantitative estimates: the calculated Förster radius (R 0) for rubrene‐to‐**Au_42_ ** FRET is 4.7 nm (Figure S14a). Assuming a homogeneous distribution of the S 1 annihilators generated via TTA and **Au_42_ ** (16 µM), the average nearest donor–acceptor distance (R DA) is estimated to be ∼22 nm, where the FRET efficiency is negligible (< 0.01%; Figure S14b). In contrast, semiconductor QDs such as PbS exhibit an extremely strong visible absorption coefficient (∼10^6^ M^−1^ cm^−1^) [88], which significantly overlaps with the FL spectrum of rubrene. Accordingly, the R 0 values of QDs are anticipated to approach R DA, potentially giving rise to non‐negligible S 1‐annihilator losses via FRET. These comparisons highlight the unique optical advantage of the **Au_42_ **/rubrene system: strong NIR absorption combined with high visible transparency (Figure S4), which effectively suppresses FRET losses even under near‐unity LHE.
Another possible loss pathway is CT from S 1‐rubrene to **Au_42_ **. Thermodynamic analysis based on the redox potentials of **Au_42_ ** and rubrene (Table S3) yields ΔG CT values of –0.18 eV for electron transfer and +0.29 eV for hole transfer, indicating that only the former is marginally favorable. However, at the low sensitizer concentration used (≤ 16 µM), even assuming diffusion‐limited kinetics (∼10^10^ M^−1^ s^−1^), the effective CT rate (∼10^5^ s^−1^) is several orders of magnitude smaller than the radiative decay rate of rubrene (∼10^8^ s^−1^). Consistently, Φ UC increases with **Au_42_ ** concentration (Figure 4d), confirming that CT does not play a significant role in UC emission quenching.
Equally importantly, the high visible transparency of **Au_42_ ** strongly suppresses reabsorption of UC photons caused by the inner‐filter effect, allowing rubrene FL in the 550–600 nm region to be transmitted without attenuation (Figure S4). This unique optical window enables near‐unity NIR LHE while minimizing visible UC photon losses. In contrast, other NIR‐absorbing AuNCs, such as [Au_25_(PET)18]^−^ and [Au_25_(PPh_3_)10(PET)5_Cl_2]^2+^ (Au_25_‐rod), exhibit nearly zero transmittance (<10^−6^) in the visible region at comparable NIR LHE (Figure S4b), making efficient UC incompatible with high LHE. Therefore, the simultaneous realization of high Φ UC and low threshold intensity (I th) in the **Au_42_ **/rubrene system originates from the combination of nearly complete NIR absorption and exceptional visible transparency.
Equation (6) shows that I th is inversely proportional to the square of the annihilator triplet lifetime (τ T(A)). This indicates that long‐lived annihilator triplets are necessary to achieve a low‐threshold for TTA‐UC. For example, 9,10‐diphenylanthracene (DPA), a benchmark visible‐range annihilator with long triplet lifetimes (several ms), achieves an ultralow I th value (∼1 mW cm^−2^) [7, 23, 89]. However, annihilators for NIR‐to‐visible UC, such as rubrene and TES‐ADT, possess much shorter triplet lifetimes (∼0.1 ms; Figure 4a and Figure S13a). These lifetimes are over an order of magnitude shorter than that of DPA, due to rapid nonradiative T_1_ → S_0_ decay governed by the energy‐gap law. Recognizing this intrinsic limitation, this study pursued reducing I th by maximizing the sensitizer's LHE instead. Unlike conventional sensitizers, which suffer from back TET or FRET losses at high concentrations, **Au_42_ ** enables efficient upconverted photon generation without such parasitic pathways. Consequently, as shown in Figure 4d, increasing the **Au_42_ ** concentration to achieve near‐unity LHE simultaneously realized high Φ UCg (21.4%) and low I th (0.14 W cm^−2^). However, this intensity threshold is still approximately two orders of magnitude higher than that of high‐performance visible‐to‐visible UC systems (∼1 mW cm^−2^). Closing this gap will require continued efforts in molecular design to further extend the triplet lifetimes of annihilators for NIR‐to‐visible UC.
Conclusion
3
In conclusion, this study establishes the **Au_42_ **/rubrene system as a new benchmark for NIR‐to‐visible TTA‐UC. Leveraging the unique photophysical attributes of the structurally anisotropic **Au_42_ ** NC—(i) strong NIR absorption, (ii) a broad optical transparency window in the visible region, and (iii) efficient triplet generation and transfer—enabled the simultaneous achievement of record‐setting UC quantum yields (Φ UC) and significantly low threshold intensities (I th). Under 808 nm excitation, the system exhibited a Φ UC (50% maximum) of 16.5% (reabsorption‐corrected Φ UC of 21.4%) with an exceptionally low I th of 0.14 W cm^−2^. Furthermore, under 936 nm excitation, a Φ UC of 12.3% (reabsorption‐corrected Φ UC of 15.0%) was attained, surpassing previously reported values above 850 nm by over two orders of magnitude. Quantitative analysis further revealed a high spin‐statistical factor (f = 0.58 ± 0.05) for rubrene, suggesting that Φ UC values approaching 30% are theoretically possible with this annihilator. These remarkable performances originate from the distinctive electronic structure of **Au_42_ **, which combines intense NIR absorption with high visible transparency, thereby effectively suppressing upconverted‐photon losses. These characteristics are expected to be shared by other compositionally diverse, needle‐shaped gold NCs [73, 74, 75, 76], underscoring their potential as a general class of NIR‐responsive triplet sensitizers. These features may pave the way for highly efficient, low‐threshold NIR‐to‐visible UC systems operating over a broad NIR wavelength range. This could open new avenues in solar‐energy conversion and advanced photonic applications.
Conflicts of Interest
The authors declare no conflicts of interest.
Supporting information
The authors have cited additional references within the Supporting Information [19, 24, 25, 26, 27, 28, 29, 30, 31, 32, 33, 34, 35, 36, 37, 38, 39, 40, 41, 42, 43, 44, 45, 46, 47, 48, 49, 50, 58, 60, 61, 64]. Supporting File: anie71420‐sup‐0001‐SuppMat.docx.
The reference list from the paper itself. Each links out to its DOI / PubMed record.
- 1P. Chen , Y. Xiao , S. Li , et al., “The Promise and Challenges of Inverted Perovskite Solar Cells,” Chemical Reviews 124 (2024): 10623–10700, 10.1021/acs.chemrev.4c 00073.39207782 · doi ↗ · pubmed ↗
- 2G. Zhang , F. R. Lin , F. Qi , et al., “Renewed Prospects for Organic Photovoltaics,” Chemical Reviews 122 (2022): 14180–14274, 10.1021/acs.chemrev.1c 00955.35929847 · doi ↗ · pubmed ↗
- 3Q. Wang and K. Domen , “Particulate Photocatalysts for Light‐Driven Water Splitting: Mechanisms, Challenges, and Design Strategies,” Chemical Reviews 120, no. 2 (2020): 919–985, 10.1021/acs.chemrev.9b 00201.31393702 · doi ↗ · pubmed ↗
- 4S. Balusche , T. Miteva , V. Yakutkin , G. Nelles , A. Yasuda , and G. Wegner , “Up‐Conversion Fluorescence: Noncoherent Excitation by Sunlight,” Physical Review Letters 97 (2006): 143903, 10.1103/Phys Rev Lett.97.143903.17155253 · doi ↗ · pubmed ↗
- 5J. Zhou , Q. Liu , W. Feng , Y. Sun , and F. Li , “Upconversion Luminescent Materials: Advances and Applications,” Chemical Reviews 115 (2015): 395–465, 10.1021/cr 400478 f.25492128 · doi ↗ · pubmed ↗
- 6T. N. Singh‐Rachford and F. N. Castellano , “Photon Upconversion Based on Sensitized Triplet–Triplet Annihilation,” Coordination Chemistry Reviews 254 (2010): 2560–2573, 10.1016/j.ccr.2010.01.003. · doi ↗
- 7A. Monguzzi , R. Tubino , S. Hoseinkhani , M. Campione , and F. Meinardi , “Low Power, Non‐Coherent Sensitized Photon Up‐conversion: Modelling and Perspectives,” Physical Chemistry Chemical Physics 14 (2012): 4322, 10.1039/c 2cp 23900 k.22370856 · doi ↗ · pubmed ↗
- 8V. Gray , D. Dzebo , M. Abrahamsson , B. Albinsson , and K. Moth‐Poulsen , “Triplet–Triplet Annihilation Photon‐Upconversion: Towards Solar Energy Applications,” Physical Chemistry Chemical Physics 16 (2014): 10345–10352, 10.1039/C 4CP 00744 A.24733519 · doi ↗ · pubmed ↗