Erratum to “CCL4‐mediated targeting of spleen tyrosine kinase (Syk) inhibitor using nanoparticles alleviates inflammatory bowel disease”

Abstract
Genes, proteins, chemicals, diseases, species, mutations and cell lines named across the full text — each resolved to its canonical identifier and authoritative record.
Click any figure to enlarge with its caption.
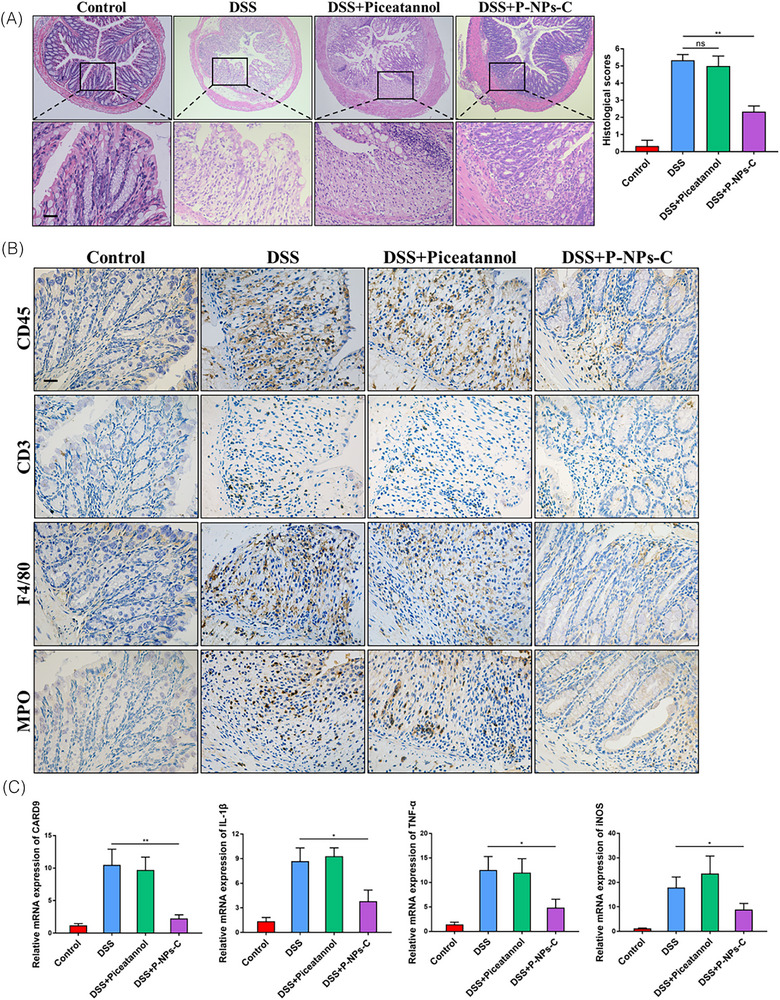 FIGURE 6
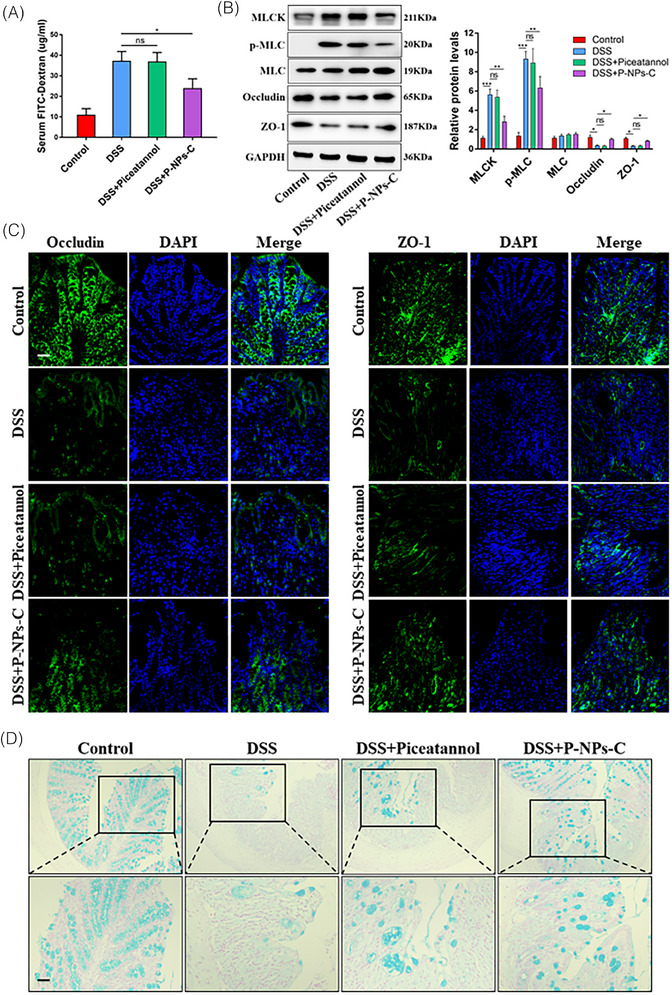 FIGURE 7
Peer Reviews
No public reviews on file for this paper yet. If you reviewed it on a platform where reviews are public (OpenReview, ICLR, NeurIPS, ICML), you can paste yours below so the community can read it here.
Videos
No videos yet. Explain this paper in a talk, walkthrough, or lecture? Add one.
Taxonomy
TopicsMast cells and histamine · Monoclonal and Polyclonal Antibodies Research · Phenothiazines and Benzothiazines Synthesis and Activities
1
Gong W, Yu J, Zheng T, et al. CCL4‐mediated targeting of spleen tyrosine kinase (Syk) inhibitor using nanoparticles alleviates inflammatory bowel disease. Clin Transl Med. 2021;11(2):e339.
In this article, we realised an incorrect staining image was used in the Control group in Figure 6B, and an incorrect immunofluorescence image was used for ZO‐1 staining in the DSS+Piceatannol group in Figure 7C after a careful reexamination of the manuscript. Upon reviewing the original data, we realised that the mistake was made inadvertently during manuscript preparation. We have now replaced the correct images of Figures 6 and 7, while the description of Figures 6 and 7 in the results section of the original version does not need to be changed. We confirm that the errors did not affect the results, interpretation and conclusion of the study.
*P‐NPs‐C alleviated intestinal inflammation during colitis. (A) Mucosal inflammation analyzed by histopathology was displayed (n = 610/group). Scale bars = 100 µm. (B) Cellular fractions of CD45+ leukocyte, CD3+ T cells, F4/80+ macrophages, and MPO+ neutrophils in colonic mucosa of DSS‐treated mice that were orally administered with P‐B;NPs‐C or piceatannol were determined by immunohistochemistry staining. Representative images were displayed. Scale bars + 100 µm. (C) The mRNA expressions of various inflammatory genes were quantified by real‐time PCR. Data were shown as mean values ± SD. *P < 0.05, *P < 0.01, and ns, no significance.
**
We apologise for this error.