Enhancing cancer classification accuracy with a self-attention network using panel capture sequencing data
Yi Jia, Chan Zhang, Han Zhang, Kang Dong, Yuruo Hu, Yinan Wang, Zicheng Zhao

TL;DR
A new machine learning model improves cancer classification accuracy using panel capture sequencing data, with high precision for cervical and gastric cancers.
Contribution
A self-attention based Conv1D network is introduced for cancer classification using clinical sequencing data, achieving over 90% accuracy.
Findings
The model achieved over 90% overall classification accuracy with 100% precision for cervical and gastric cancers.
Key genes like C3orf36, JHY, and TASP1 showed significant mutation differences across cancer types.
Abstract
Cancer classification is pivotal for precision oncology, yet traditional methods struggle with the molecular heterogeneity of tumors. Our study introduces a self-attention based Conv1D machine learning network designed for panel capture sequencing data, which is more commonly used in clinical settings. Combining clinical capture sequencing data and The Cancer Genome Atlas data, we achieved an overall classification accuracy of over 90%, with precision rates reaching 100% for cervical and gastric cancers. Additionally, recall rates were highest at 95.79% for gastric cancer and lowest at 77.46% for cervical cancer, demonstrating robust performance across various cancer types. The model identified key genes such as C3orf36, JHY, and TASP1, showing significant differences in mutation counts across cancers. High-impact gene enrichment analysis highlighted critical pathways like acute myeloid…
Genes, proteins, chemicals, diseases, species, mutations and cell lines named across the full text — each resolved to its canonical identifier and authoritative record.
Click any figure to enlarge with its caption.
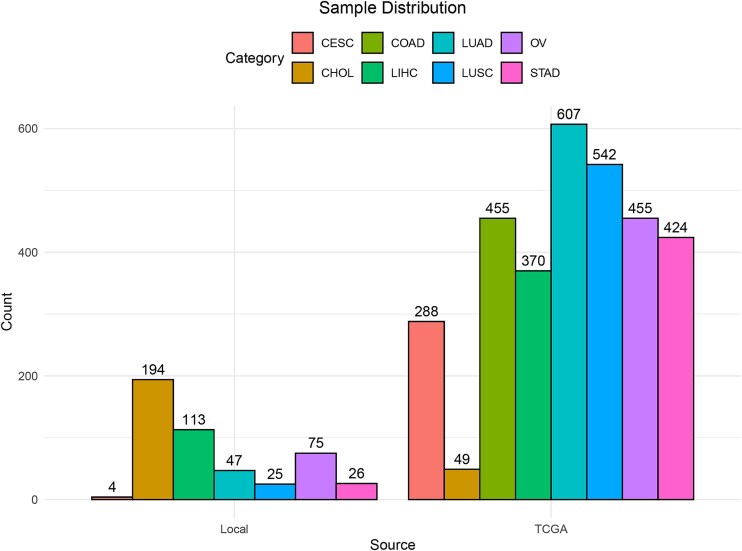 Figure 1
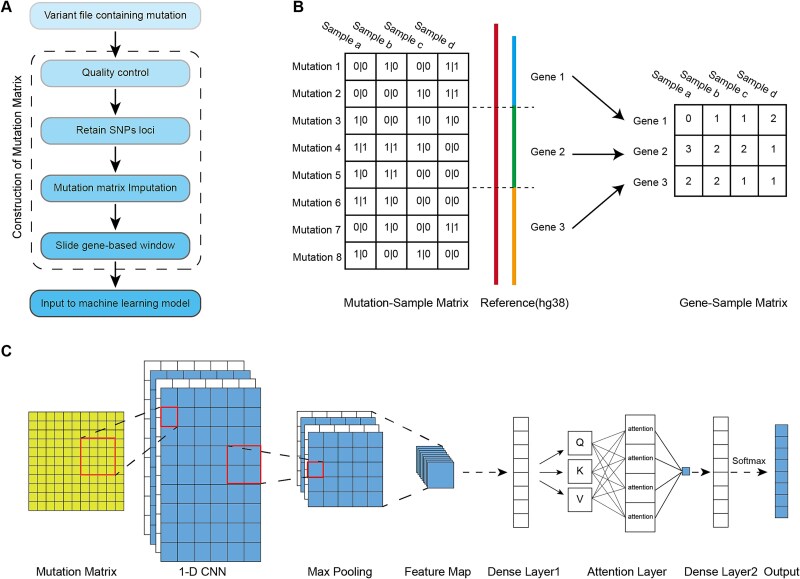 Figure 2
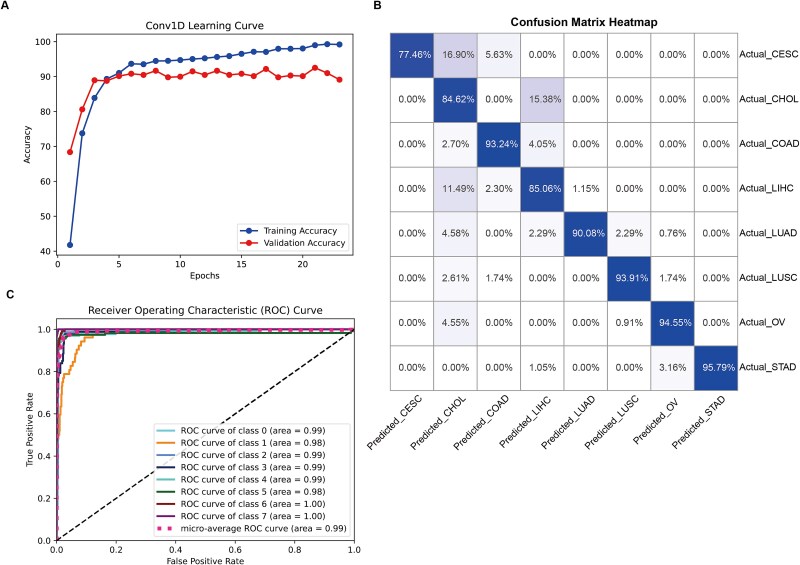 Figure 3
 Figure 4
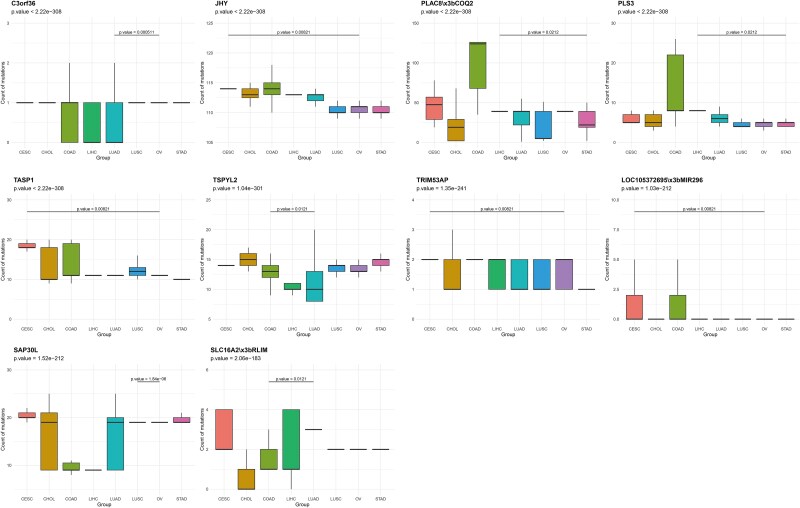 Figure 5
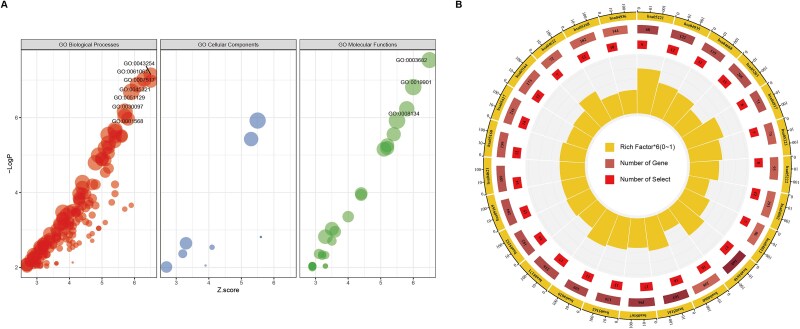 Figure 6
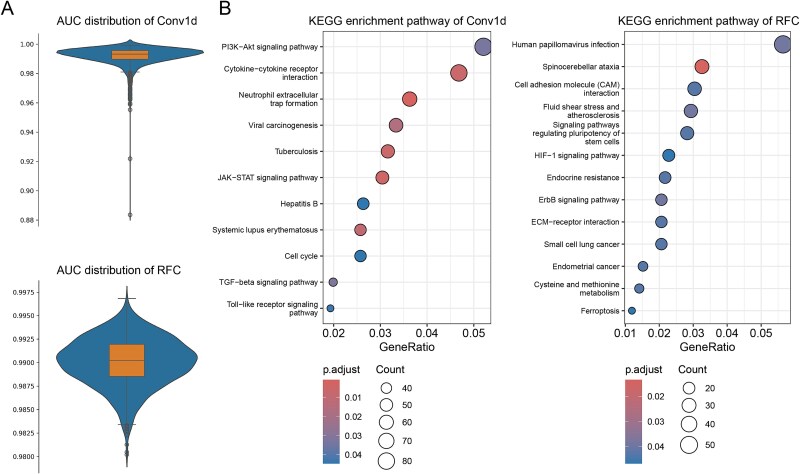 Figure 7
| Cancer types | Data types |
|---|---|
| CESC | exome sequencing data |
| CHOL | BGI's 688 Panel sequencing data |
| LIHC | BGI's 688 Panel sequencing data |
| LUAD | BGI's 688 Panel sequencing data, whole genome sequencing data |
| LUSC | BGI's 688 Panel sequencing data, whole genome sequencing data |
| OV | BGI's 688 Panel sequencing data |
| STAD | exome sequencing data |
| COAD | \ |
| Class | Precision | Recall | F1-score |
|---|---|---|---|
| CESC | 1 | 0.7746 | 0.873 |
| CHOL | 0.5366 | 0.8462 | 0.6567 |
| COAD | 0.8961 | 0.9324 | 0.9139 |
| LIHC | 0.8315 | 0.8506 | 0.8409 |
| LUAD | 0.9916 | 0.9008 | 0.944 |
| LUSC | 0.9643 | 0.9391 | 0.9515 |
| OV | 0.9455 | 0.9455 | 0.9455 |
| STAD | 1 | 0.9579 | 0.9785 |
| GroupID | Category | ID | Description | LogP | Log.q.value. | Genes | Symbols | InTerm_InList | Count | Z.score |
|---|---|---|---|---|---|---|---|---|---|---|
| 1_Member | GO Molecular Functions | GO:0003682 | chromatin binding | −7.5347 | −3.13 | ##### | CCNT2,CENPB,CHD2,CHD3,DMRT1,ELK1,EP300,FOS,H1–2,H1–4,HOXD13,MNT,PAX6,SFPQ,SHMT2,STAT3,STAT5B,TAL1,TOP2A,TOP2B,TTF1,NELFA,KAT2B,SETDB1,STAG3,PSIP1,BAHD1,KDM1A,PHF8,KAT6B,NUP62,PELP1,ZNF304,CHD8,TSPYL2,NOC3L,SAP30L,ZNF750,CBX2,PWWP3A,MBD6,ARX,ATXN1L | 43/615 | 43 | 6.5 |
| 2_Member | GO Biological Processes | GO:0043254 | regulation of protein-containing complex assembly | −7.1443 | −3.13 | ##### | ADD2,RHOC,CDH5,EP300,HSPA5,LGALS3,MAP1B,PIK3R2,PPP2R5B,PTGER4,SVIL,TAL1,TBCD,NAPA,TNFSF18,CKAP5,FARP2,SEC16A,HAX1,UNC13B,ARFGEF1,CLASP2,CAMSAP2,TRAPPC12,CRBN,ASB2,HAUS6,SPTBN4,ZDHHC12,NAV3,ARHGAP18,TIRAP,TPPP2,NEK7 | 34/438 | 34 | 6.5 |
| 2_Member | GO Biological Processes | GO:0043242 | negative regulation of protein-containing complex disassembly | −4.2148 | −1.62 | ##### | ADD2,MAP1B,SVIL,RUBCN,CLASP2,CAMSAP2,CKAP2,SCAF4,SPTBN4,NAV3 | 10/79 | 10 | 5.4 |
| 2_Member | GO Biological Processes | GO:0032271 | regulation of protein polymerization | −4.213 | −1.62 | ##### | ADD2,CDH5,MAP1B,PIK3R2,SVIL,TBCD,CKAP5,HAX1,ARFGEF1,CLASP2,CAMSAP2,ASB2,HAUS6,SPTBN4,NAV3,ARHGAP18,TPPP2 | 17/206 | 17 | 4.8 |
| 2_Member | GO Biological Processes | GO:0051493 | regulation of cytoskeleton organization | −3.9688 | −1.48 | ##### | ADD2,RHOC,CDH5,MAP1B,NEB,PIK3R1,PIK3R2,PTGER4,PTK2,SLC4A2,SVIL,TBCD,KAT2B,TAOK2,CKAP5,HAX1,ARFGEF1,CLASP2,CAMSAP2,NUP62,CKAP2,STAU2,ASB2,HAUS6,SPTBN4,NAV3,FRMD7,MYLK3,ARHGAP18,SKA3,MIR335 | 31/539 | 31 | 4.3 |
| 2_Member | GO Biological Processes | GO:0051494 | negative regulation of cytoskeleton organization | −3.7557 | −1.35 | ##### | ADD2,CDH5,MAP1B,PIK3R1,SVIL,TBCD,KAT2B,ARFGEF1,CLASP2,CAMSAP2,CKAP2,SPTBN4,NAV3,FRMD7 | 14/163 | 14 | 4.6 |
| 2_Member | GO Biological Processes | GO:0031111 | negative regulation of microtubule polymerization or depolymerization | −3.7368 | −1.34 | ##### | CDH5,MAP1B,TBCD,CLASP2,CAMSAP2,CKAP2,NAV3 | 7/44 | 7 | 5.3 |
| 2_Member | GO Biological Processes | GO:0043244 | regulation of protein-containing complex disassembly | −3.5889 | −1.26 | ##### | ADD2,MAP1B,SVIL,RUBCN,CLASP2,CAMSAP2,TECPR1,CKAP2,ASB2,SCAF4,SPTBN4,NAV3 | 12/130 | 12 | 4.5 |
| 2_Member | GO Biological Processes | GO:0010639 | negative regulation of organelle organization | −3.5376 | −1.23 | ##### | ADD2,CDH5,DMRT1,LMNA,MAP1B,PIK3R1,RAD1,SVIL,TBCD,TOP2A,KAT2B,USP10,KNTC1,ARFGEF1,CLASP2,CAMSAP2,CKAP2,RTEL1,TEX14,SPTBN4,NAV3,FRMD7 | 22/348 | 22 | 4.1 |
| 2_Member | GO Biological Processes | GO:0031113 | regulation of microtubule polymerization | −3.3974 | −1.16 | ##### | CDH5,MAP1B,TBCD,CKAP5,CLASP2,CAMSAP2,HAUS6,NAV3 | 8/65 | 8 | 4.7 |
| 2_Member | GO Biological Processes | GO:0031110 | regulation of microtubule polymerization or depolymerization | −3.3593 | −1.14 | ##### | CDH5,MAP1B,TBCD,CKAP5,CLASP2,CAMSAP2,CKAP2,HAUS6,NAV3,SKA3 | 10/100 | 10 | 4.4 |
| 2_Member | GO Biological Processes | GO:1901880 | negative regulation of protein depolymerization | −3.22 | −1.06 | ##### | ADD2,MAP1B,SVIL,CLASP2,CAMSAP2,CKAP2,SPTBN4,NAV3 | 8/69 | 8 | 4.5 |
| 2_Member | GO Biological Processes | GO:1902904 | negative regulation of supramolecular fiber organization | −3.0972 | −1 | ##### | ADD2,CDH5,MAP1B,PIK3R1,SVIL,TBCD,ARFGEF1,CLASP2,CAMSAP2,CKAP2,SPTBN4,NAV3,FRMD7 | 13/168 | 13 | 4 |
| 2_Member | GO Biological Processes | GO:1901879 | regulation of protein depolymerization | −2.9755 | −0.94 | ##### | ADD2,MAP1B,SVIL,CLASP2,CAMSAP2,CKAP2,ASB2,SPTBN4,NAV3 | 9/93 | 9 | 4.1 |
| 2_Member | GO Molecular Functions | GO:0015631 | tubulin binding | −2.9541 | −0.93 | ##### | ALDOA,DCX,DYNC1I1,FNTA,MAP1B,TBCD,CKAP5,DNM1L,RGS14,CLASP2,SYT11,CAMSAP2,SETD2,SBDS,GTSE1,HAUS6,TTLL2,MAP1LC3A,NAV3,TPPP2,SKA3,MAP1LC3B2 | 22/385 | 22 | 3.6 |
| 2_Member | GO Biological Processes | GO:0007026 | negative regulation of microtubule depolymerization | −2.8358 | −0.85 | ##### | MAP1B,CLASP2,CAMSAP2,CKAP2,NAV3 | ####### | 5 | 4.6 |
| 2_Member | GO Biological Processes | GO:0032970 | regulation of actin filament-based process | −2.772 | −0.83 | ##### | ADD2,RHOC,DSP,MYH9,NEB,PIK3R1,PIK3R2,PTGER4,SLC4A2,STC1,SVIL,TAOK2,HAX1,ARFGEF1,CLASP2,STAU2,ASB2,SPTBN4,FRMD7,MYLK3,ARHGAP18,MIR335 | 22/398 | 22 | 3.4 |
| 2_Member | GO Biological Processes | GO:1902903 | regulation of supramolecular fiber organization | −2.7181 | −0.8 | ##### | ADD2,RHOC,CDH5,MAP1B,PIK3R1,PIK3R2,PTGER4,SVIL,TBCD,CKAP5,HAX1,ARFGEF1,CLASP2,CAMSAP2,CKAP2,ASB2,HAUS6,SPTBN4,NAV3,FRMD7,MYLK3,ARHGAP18 | 22/402 | 22 | 3.4 |
| 2_Member | GO Cellular Components | GO:0005874 | microtubule | −2.6442 | −0.77 | ##### | DCX,DYNC1I1,DPYSL2,MAP1B,SVIL,TBCD,KNTC1,CKAP5,DNM1L,RGS14,CLASP2,CAMSAP2,CKAP2,STAU2,GTSE1,HAUS6,MAP1LC3A,NAV3,ARHGAP18,TPPP2,NEK7,TTLL8,SKA3,CFAP77,MAP1LC3B2 | 25/486 | 25 | 3.3 |
| 2_Member | GO Biological Processes | GO:0031333 | negative regulation of protein-containing complex assembly | −2.615 | −0.75 | ##### | ADD2,CDH5,EP300,HSPA5,PTGER4,SVIL,TBCD,ARFGEF1,CRBN,SPTBN4,ZDHHC12 | 11/146 | 11 | 3.5 |
| 2_Member | GO Cellular Components | GO:1990752 | microtubule end | −2.5388 | −0.71 | ##### | SVIL,CKAP5,CLASP2,CAMSAP2,NAV3 | 5/36 | 5 | 4.1 |
| 2_Member | GO Biological Processes | GO:0031114 | regulation of microtubule depolymerization | −2.4855 | −0.67 | ##### | MAP1B,CLASP2,CAMSAP2,CKAP2,NAV3 | 5/37 | 5 | 4 |
| 2_Member | GO Biological Processes | GO:0032886 | regulation of microtubule-based process | −2.469 | −0.67 | ##### | CDH5,LAMP1,MAP1B,TBCD,KAT2B,CKAP5,PDCD6IP,CLASP2,CAMSAP2,NUP62,CKAP2,HAUS6,NAV3,TPPP2,SKA3,CCDC39 | 16/269 | 16 | 3.2 |
| 2_Member | GO Molecular Functions | GO:0008017 | microtubule binding | −2.3615 | −0.6 | ##### | DCX,DYNC1I1,FNTA,MAP1B,CKAP5,DNM1L,RGS14,CLASP2,CAMSAP2,SBDS,GTSE1,HAUS6,MAP1LC3A,NAV3,SKA3,MAP1LC3B2 | 16/276 | 16 | 3.1 |
| 2_Member | GO Biological Processes | GO:0032956 | regulation of actin cytoskeleton organization | −2.3345 | −0.59 | ##### | ADD2,RHOC,NEB,PIK3R1,PIK3R2,PTGER4,SLC4A2,SVIL,TAOK2,HAX1,ARFGEF1,CLASP2,STAU2,ASB2,SPTBN4,FRMD7,MYLK3,ARHGAP18,MIR335 | 19/354 | 19 | 3 |
| 2_Member | GO Biological Processes | GO:0070507 | regulation of microtubule cytoskeleton organization | −2.1934 | −0.52 | ##### | CDH5,MAP1B,TBCD,CKAP5,CLASP2,CAMSAP2,NUP62,CKAP2,HAUS6,NAV3,SKA3 | 11/166 | 11 | 3.1 |
| 3_Member | GO Biological Processes | GO:0061061 | muscle structure development | −7.0282 | −3.13 | 34,89,104,607,905,1106,1271,1832,1960,2033,2353,3911,4000,4209,4627,4638,4703,5239,5915,6442,6608,6840,7291,7402,10,529,23,028,51,676,57,462,60,529,64,091,64,208,79,784,80,005,84,466,85,407,91,807,219,537,283,078 | ACADM,ACTN3,ADARB1,BCL9,CCNT2,CHD2,CNTFR,DSP,EGR3,EP300,FOS,LAMA5,LMNA,MEF2D,MYH9,MYLK,NEB,PGM5,RARB,SGCA,SMO,SVIL,TWIST1,UTRN,NEBL,KDM1A,ASB2,MYORG,ALX4,POPDC2,POPDC3,MYH14,DOCK5,MEGF10,NKD1,MYLK3,SMTNL1,MKX | 38/529 | 38 | 6.3 |
| 3_Member | GO Biological Processes | GO:0007517 | muscle organ development | −6.9707 | −3.13 | ##### | ADARB1,BCL9,CCNT2,CHD2,CNTFR,DSP,EGR3,EP300,FOS,LAMA5,LMNA,MEF2D,MYLK,NEB,SGCA,SMO,SVIL,TWIST1,UTRN,ASB2,MYORG,ALX4,POPDC2,POPDC3,MYH14,MEGF10,SMTNL1,MKX | 28/323 | 28 | 6.5 |
| 3_Member | GO Biological Processes | GO:0007507 | heart development | −4.1248 | −1.55 | ##### | ACADM,CASP8,COL5A1,CRKL,DSP,MEGF8,EP300,EPHB4,FOLR1,LMNA,MEF2D,NEB,NFATC1,NTRK3,PPARD,PTK2,PTPRJ,RARB,SMO,TWIST1,KAT2B,CACNA1G,CALCRL,NEBL,ADAMTS6,SETD2,ASB2,POPDC2,POPDC3,MYLK3,ANKS6,SH3PXD2B,CCDC39 | 33/578 | 33 | 4.4 |
| 3_Member | GO Biological Processes | GO:0060538 | skeletal muscle organ development | −3.8407 | −1.42 | ##### | BCL9,CCNT2,CNTFR,EP300,FOS,MEF2D,SMO,SVIL,ASB2,MYORG,POPDC2,POPDC3,MYH14,MEGF10 | 14/160 | 14 | 4.7 |
| 3_Member | GO Biological Processes | GO:0060537 | muscle tissue development | −3.8077 | −1.39 | ##### | ACADM,BCL9,CCNT2,DSP,EP300,FOS,LMNA,MEF2D,MYLK,NEB,PGM5,RARB,SMO,SVIL,CACNA1G,NEBL,ASB2,MYORG,POPDC2,POPDC3,MYH14,MEGF10,MYLK3 | 23/356 | 23 | 4.3 |
| 3_Member | GO Biological Processes | GO:0014706 | striated muscle tissue development | −3.7684 | −1.36 | ##### | ACADM,BCL9,CCNT2,DSP,EP300,FOS,LMNA,MEF2D,NEB,PGM5,RARB,SMO,SVIL,CACNA1G,NEBL,ASB2,MYORG,POPDC2,POPDC3,MYH14,MEGF10,MYLK3 | 22/335 | 22 | 4.3 |
| 3_Member | GO Biological Processes | GO:0007519 | skeletal muscle tissue development | −3.6832 | −1.31 | ##### | BCL9,CCNT2,EP300,FOS,MEF2D,SMO,SVIL,ASB2,MYORG,POPDC2,POPDC3,MYH14,MEGF10 | 13/146 | 13 | 4.6 |
| 3_Member | GO Biological Processes | GO:0042692 | muscle cell differentiation | −2.9457 | −0.93 | 34,89,607,4000,4627,4703,5239,5915,6608,10,529,23,028,51,676,57,462,64,091,64,208,80,005,84,466,91,807 | ACADM,ACTN3,BCL9,LMNA,MYH9,NEB,PGM5,RARB,SMO,NEBL,KDM1A,ASB2,MYORG,POPDC2,POPDC3,DOCK5,MEGF10,MYLK3 | 18/288 | 18 | 3.6 |
| 3_Member | GO Biological Processes | GO:0051146 | striated muscle cell differentiation | −2.8388 | −0.85 | ##### | ACADM,BCL9,LMNA,MYH9,NEB,PGM5,RARB,SMO,NEBL,ASB2,MYORG,POPDC2,POPDC3,DOCK5,MYLK3 | 15/224 | 15 | 3.6 |
| 3_Member | GO Biological Processes | GO:0035051 | cardiocyte differentiation | −2.0873 | −0.46 | ##### | ACADM,FOLR1,LMNA,NEB,RARB,TWIST1,NEBL,ASB2,MYLK3 | 9/126 | 9 | 3 |
| 3_Member | GO Biological Processes | GO:0055001 | muscle cell development | −2.0641 | −0.45 | ##### | ACTN3,LMNA,NEB,PGM5,SMO,NEBL,KDM1A,ASB2,MYORG,MEGF10,MYLK3 | 11/173 | 11 | 2.9 |
| 4_Member | GO Biological Processes | GO:0045321 | leukocyte activation | −6.8807 | −3.13 | ##### | ANXA3,B2M,C3,C5AR1,CASP8,CD74,DDOST,DNASE1L3,EP300,IFNA10,IFNA14,IFNGR1,IL4R,LBP,MYH9,PIK3CG,PIK3R1,PIK3R2,PTGDR,PTGER4,PTPRC,PTPRJ,STAT3,STAT5B,TOP2B,FZD5,NR4A3,DYSF,TNFSF18,MAFB,CCR9,GPR89B,DOCK10,KMT2E,IFNK,WNK4,TNFAIP8L2,SEMA6D,HSH2D,ADGRG3,THEMIS,NRARP | 42/626 | 42 | 6.1 |
| 4_Member | GO Biological Processes | GO:0030097 | hemopoiesis | −6.1615 | −2.7 | ##### | ADD2,B2M,CASP8,CD74,CHD2,EP300,FOS,IL4R,JUNB,LBR,MYH9,NFATC1,PIK3R1,PIK3R2,PRTN3,PTGER4,PTPRC,PTPRJ,SLC4A2,STAT3,STAT5B,TAL1,TOP2A,TOP2B,ZBTB16,FZD5,DYRK3,SOCS1,KRT75,FARP2,MAFB,CCR9,NBEAL2,SBDS,GPR89B,DOCK10,SLC48A1,KMT2E,TIRAP,ADGRG3,HEATR9,THEMIS,NRARP | 43/690 | 43 | 5.7 |
| 4_Member | GO Biological Processes | GO:0002521 | leukocyte differentiation | −5.9679 | −2.63 | ##### | B2M,CASP8,CD74,EP300,FOS,IL4R,JUNB,LBR,MYH9,NFATC1,PIK3R1,PIK3R2,PRTN3,PTGER4,PTPRC,PTPRJ,SLC4A2,STAT3,STAT5B,TAL1,TOP2B,FZD5,SOCS1,FARP2,MAFB,CCR9,GPR89B,DOCK10,ADGRG3,THEMIS,NRARP | 31/426 | 31 | 5.8 |
| 4_Member | GO Biological Processes | GO:0001775 | cell activation | −5.539 | −2.39 | ##### | ANXA3,B2M,C3,C5AR1,CASP8,CD74,DDOST,DNASE1L3,EP300,IFNA10,IFNA14,IFNGR1,IL4R,LBP,MYH9,PIK3CG,PIK3R1,PIK3R2,PTGDR,PTGER4,PTPRC,PTPRJ,SMO,STAT3,STAT5B,TOP2B,FZD5,NR4A3,DYSF,TNFSF18,MAFB,CCR9,GPR89B,DOCK10,KMT2E,IFNK,WNK4,TNFAIP8L2,SEMA6D,MEGF10,HSH2D,ADGRG3,THEMIS,NRARP | 44/754 | 44 | 5.2 |
| 4_Member | GO Biological Processes | GO:0042110 | T cell activation | −5.5184 | −2.39 | ##### | B2M,CASP8,CD74,DDOST,IFNA10,IFNA14,IL4R,MYH9,PIK3CG,PIK3R1,PIK3R2,PTGER4,PTPRC,STAT3,STAT5B,FZD5,TNFSF18,MAFB,CCR9,GPR89B,IFNK,TNFAIP8L2,SEMA6D,HSH2D,THEMIS,NRARP | 26/339 | 26 | 5.6 |
| 4_Member | GO Biological Processes | GO:1903131 | mononuclear cell differentiation | −5.05 | −2.18 | ##### | B2M,CASP8,CD74,EP300,FOS,IL4R,MYH9,NFATC1,PIK3R1,PIK3R2,PRTN3,PTGER4,PTPRC,PTPRJ,STAT3,STAT5B,TOP2B,FZD5,SOCS1,MAFB,CCR9,GPR89B,DOCK10,ADGRG3,THEMIS,NRARP | 26/360 | 26 | 5.2 |
| 4_Member | GO Biological Processes | GO:0046649 | lymphocyte activation | −4.9036 | −2.1 | ##### | B2M,C3,CASP8,CD74,DDOST,EP300,IFNA10,IFNA14,IL4R,MYH9,PIK3CG,PIK3R1,PIK3R2,PTGER4,PTPRC,PTPRJ,STAT3,STAT5B,TOP2B,FZD5,TNFSF18,MAFB,CCR9,GPR89B,DOCK10,IFNK,TNFAIP8L2,SEMA6D,HSH2D,ADGRG3,THEMIS,NRARP | 32/504 | 32 | 5 |
| 4_Member | GO Biological Processes | GO:0002366 | leukocyte activation involved in immune response | −4.6437 | −1.9 | ##### | ANXA3,CD74,DNASE1L3,IFNA10,IFNA14,IL4R,LBP,PIK3CG,PIK3R1,PTGDR,PTGER4,STAT3,NR4A3,DYSF,TNFSF18,DOCK10,IFNK,SEMA6D | 18/210 | 18 | 5.2 |
| 4_Member | GO Biological Processes | GO:0002263 | cell activation involved in immune response | −4.5343 | −1.8 | ##### | ANXA3,CD74,DNASE1L3,IFNA10,IFNA14,IL4R,LBP,PIK3CG,PIK3R1,PTGDR,PTGER4,STAT3,NR4A3,DYSF,TNFSF18,DOCK10,IFNK,SEMA6D | 18/214 | 18 | 5.1 |
| 4_Member | GO Biological Processes | GO:0030098 | lymphocyte differentiation | −3.9633 | −1.48 | ##### | B2M,CD74,EP300,IL4R,PIK3R1,PIK3R2,PTGER4,PTPRC,PTPRJ,STAT3,STAT5B,TOP2B,FZD5,MAFB,CCR9,GPR89B,DOCK10,ADGRG3,THEMIS,NRARP | 20/280 | 20 | 4.5 |
| 4_Member | GO Biological Processes | GO:0002286 | T cell activation involved in immune response | −3.6543 | −1.3 | ##### | CD74,IFNA10,IFNA14,IL4R,PIK3R1,PTGER4,STAT3,TNFSF18,IFNK,SEMA6D | 10/92 | 10 | 4.8 |
| 4_Member | GO Biological Processes | GO:0030217 | T cell differentiation | −3.6533 | −1.3 | ##### | B2M,CD74,IL4R,PIK3R1,PIK3R2,PTGER4,PTPRC,STAT3,STAT5B,FZD5,MAFB,CCR9,GPR89B,THEMIS,NRARP | 15/187 | 15 | 4.4 |
| 4_Member | GO Biological Processes | GO:0002252 | immune effector process | −3.121 | −1.01 | ##### | ANXA3,B2M,C3,CD74,CD55,DNASE1L3,IFNA10,IFNA14,IL4R,LBP,PIK3CG,PIK3R1,PTGDR,PTGER4,PTK2,STAT3,STAT5B,NR4A3,DYSF,TNFSF18,C1RL,DOCK10,KMT2E,IFNK,SEMA6D,SFTPA1 | 26/474 | 26 | 3.7 |
| 4_Member | GO Biological Processes | GO:0042113 | B cell activation | −2.951 | −0.93 | ##### | C3,CASP8,EP300,IFNA10,IFNA14,PIK3R1,PIK3R2,PTPRC,PTPRJ,STAT5B,TOP2B,DOCK10,IFNK,ADGRG3 | 14/196 | 14 | 3.8 |
| 4_Member | GO Biological Processes | GO:0002285 | lymphocyte activation involved in immune response | −2.5918 | −0.74 | ##### | CD74,IFNA10,IFNA14,IL4R,PIK3R1,PTGER4,STAT3,TNFSF18,DOCK10,IFNK,SEMA6D | 11/147 | 11 | 3.5 |
| 4_Member | GO Biological Processes | GO:0030183 | B cell differentiation | −2.3421 | −0.59 | ##### | EP300,PIK3R1,PIK3R2,PTPRC,PTPRJ,STAT5B,TOP2B,DOCK10,ADGRG3 | 9/115 | 9 | 3.3 |
| 5_Member | GO Molecular Functions | GO:0019901 | protein kinase binding | −6.8148 | −3.13 | ##### | ADD2,RHOC,CCNT2,CDC25B,CDH1,CDH5,CRKL,CSPG4,DCX,DSP,FNTA,NFATC1,PAX6,PIK3R1,PIK3R2,PTK2,PTPRC,PTPRJ,SMO,STAT3,TOP2A,TRAF3,USF1,UTRN,MAP3K12,FZD5,NR4A3,SOCS1,KAT2B,CDK5R2,MAP3K13,TAOK2,BAG5,CIR1,TCL1B,RGS14,CLASP2,NBEAL2,STAU2,TEX14,SLC12A5,TBC1D14,ZBTB4,PITPNM3,TIRAP | 45/699 | 45 | 6 |
| 5_Member | GO Molecular Functions | GO:0019900 | kinase binding | −5.9174 | −2.63 | ##### | ADD2,RHOC,CCNT2,CDC25B,CDH1,CDH5,CRKL,CSPG4,DCX,DSP,FNTA,NFATC1,PAX6,PIK3R1,PIK3R2,PTK2,PTPRC,PTPRJ,SMO,STAT3,TNFAIP3,TOP2A,TRAF3,USF1,UTRN,MAP3K12,FZD5,NR4A3,SOCS1,KAT2B,CDK5R2,MAP3K13,TAOK2,BAG5,CIR1,TCL1B,RGS14,CLASP2,NBEAL2,STAU2,TEX14,SLC12A5,TBC1D14,ZBTB4,PITPNM3,TIRAP | 46/778 | 46 | 5.5 |
| 6_Member | GO Biological Processes | GO:0051129 | negative regulation of cellular component organization | −6.6862 | −3.07 | ##### | ADD2,APOD,B2M,CBLN1,CDH1,CDH5,DMRT1,EP300,GFI1,HSPA5,LGALS3,LMNA,MAP1B,MMP14,PIK3R1,PRTN3,PTGER4,RAD1,SVIL,TBCD,TOP2A,DYSF,KAT2B,USP10,BAG5,RUBCN,KNTC1,SPRY3,SEMA6C,ARFGEF1,KDM1A,CLASP2,PHF8,SYT11,CAMSAP2,CKAP2,CRBN,RTEL1,TEX14,SCAF4,SPTBN4,SEMA6D,ZDHHC12,NAV3,FRMD7,PRAG1 | 46/730 | 46 | 5.9 |
| 8_Member | GO Molecular Functions | GO:0008134 | transcription factor binding | −6.2343 | −2.73 | ##### | CCNT2,CRKL,E2F1,ELK1,EP300,FOS,GBX2,HOXA7,MEF2D,NFATC1,PAX6,PIM1,PPARD,RARB,RBBP8,RFC1,RXRA,SRY,STAT3,STAT5B,TAL1,TCF4,TWIST1,USF1,ZBTB16,NR4A3,KAT2B,PER2,RPL23,MED17,MED13,WWP2,PSIP1,BAZ2A,DDX20,SPEN,KDM1A,UBXN7,LCOR | 39/592 | 39 | 5.8 |
| 8_Member | GO Cellular Components | GO:0005667 | transcription regulator complex | −5.4261 | −2.36 | ##### | BCL9,CHD3,E2F1,EP300,FOXE3,FOS,GFI1,JUNB,NFATC1,RBBP8,RXRA,SFPQ,STAT3,STAT5B,TAL1,TCF4,USF1,ZBTB16,NR4A3,TRRAP,PER2,LDB2,MED17,MAFB,IRF9,HAX1,HOXB13,DDX20,SPEN,KDM1A,ATF7IP,RCOR3,ALX4,LIN54 | 34/521 | 34 | 5.3 |
| 8_Member | GO Molecular Functions | GO:0140297 | DNA-binding transcription factor binding | −5.1862 | −2.24 | ##### | CRKL,E2F1,ELK1,EP300,FOS,GBX2,HOXA7,MEF2D,NFATC1,PPARD,RARB,RBBP8,RFC1,RXRA,SRY,STAT3,STAT5B,TAL1,TWIST1,USF1,NR4A3,KAT2B,MED17,MED13,WWP2,PSIP1,BAZ2A,DDX20,SPEN,KDM1A,UBXN7,LCOR | 32/488 | 32 | 5.2 |
| 8_Member | GO Molecular Functions | GO:0061629 | RNA polymerase II-specific DNA-binding transcription factor binding | −3.9345 | −1.48 | ##### | CRKL,ELK1,EP300,FOS,GBX2,MEF2D,NFATC1,PPARD,RARB,RBBP8,RXRA,STAT3,STAT5B,TAL1,NR4A3,MED17,MED13,WWP2,BAZ2A,SPEN,KDM1A,UBXN7,LCOR | 23/349 | 23 | 4.4 |
| 8_Member | GO Molecular Functions | GO:0016922 | nuclear receptor binding | −2.3282 | −0.59 | ##### | EP300,RARB,RXRA,STAT5B,NR4A3,MED17,MED13,BAZ2A,KDM1A,LCOR | 10/137 | 10 | 3.3 |
| 9_Member | GO Biological Processes | GO:0060396 | growth hormone receptor signaling pathway | −3.6588 | −1.3 | ##### | CSH1,PIK3R1,PTK2,STAT3,STAT5B | ####### | 5 | 5.9 |
| 9_Member | GO Biological Processes | GO:0071378 | cellular response to growth hormone stimulus | −3.5567 | −1.25 | ##### | CSH1,PIK3R1,PTK2,STAT3,STAT5B | ####### | 5 | 5.7 |
| 9_Member | GO Cellular Components | GO:0005943 | phosphatidylinositol 3-kinase complex, class IA | −2.8129 | −0.85 | ##### | PIK3CG,PIK3R1,PIK3R2 | ####### | 3 | 5.6 |
| 9_Member | GO Cellular Components | GO:0097651 | phosphatidylinositol 3-kinase complex, class I | −2.8129 | −0.85 | ##### | PIK3CG,PIK3R1,PIK3R2 | ####### | 3 | 5.6 |
| 9_Member | GO Biological Processes | GO:0060416 | response to growth hormone | −2.6511 | −0.77 | ##### | CSH1,PIK3R1,PTK2,STAT3,STAT5B | 5/34 | 5 | 4.3 |
| 9_Member | GO Biological Processes | GO:0043491 | phosphatidylinositol 3-kinase/protein kinase B signal transduction | −2.5088 | −0.69 | ##### | PIK3C2A,PIK3CG,PIK3R1,PIK3R2,PPARD,STAT3,PLEKHA1 | 7/70 | 7 | 3.7 |
| 9_Member | GO Cellular Components | GO:0005942 | phosphatidylinositol 3-kinase complex | −2.0513 | −0.45 | ##### | PIK3CG,PIK3R1,PIK3R2 | ####### | 3 | 3.9 |
| 10_Member | GO Biological Processes | GO:0001568 | blood vessel development | −6.0347 | −2.65 | ##### | APOD,CASP8,CDH5,COL5A1,CRKL,CSPG4,CYP1B1,MEGF8,EGR3,EPHB4,VEGFD,FOLR1,GBX2,HOXA7,ID1,JUNB,MMP14,MYH9,MYLK,PAX6,PIK3CG,PTK2,PTPRJ,SMO,TAL1,PXDN,FZD5,CALCRL,HOXB13,ADAMTS6,SRPX2,SETD2,NSDHL,ZNF304,COL18A1,NRARP | 36/534 | 36 | 5.7 |
| 10_Member | GO Biological Processes | GO:0001944 | vasculature development | −5.6307 | −2.42 | ##### | APOD,CASP8,CDH5,COL5A1,CRKL,CSPG4,CYP1B1,MEGF8,EGR3,EPHB4,VEGFD,FOLR1,GBX2,HOXA7,ID1,JUNB,MMP14,MYH9,MYLK,PAX6,PIK3CG,PTK2,PTPRJ,SMO,TAL1,PXDN,FZD5,CALCRL,HOXB13,ADAMTS6,SRPX2,SETD2,NSDHL,ZNF304,COL18A1,NRARP | 36/556 | 36 | 5.4 |
| 10_Member | GO Biological Processes | GO:0048514 | blood vessel morphogenesis | −5.2103 | −2.24 | ##### | APOD,CASP8,CSPG4,CYP1B1,MEGF8,EGR3,EPHB4,VEGFD,FOLR1,GBX2,HOXA7,ID1,JUNB,MMP14,MYH9,MYLK,PIK3CG,PTK2,PTPRJ,SMO,TAL1,PXDN,FZD5,CALCRL,HOXB13,SRPX2,SETD2,ZNF304,COL18A1,NRARP | 30/441 | 30 | 5.2 |
| 10_Member | GO Biological Processes | GO:0001525 | angiogenesis | −4.862 | −2.08 | ##### | APOD,CASP8,CSPG4,CYP1B1,EGR3,EPHB4,VEGFD,GBX2,HOXA7,ID1,MMP14,MYH9,PIK3CG,PTK2,PTPRJ,TAL1,PXDN,FZD5,CALCRL,HOXB13,SRPX2,SETD2,ZNF304,COL18A1,NRARP | 25/347 | 25 | 5.1 |
| 10_Member | GO Biological Processes | GO:0035239 | tube morphogenesis | −4.2685 | −1.63 | ##### | APOD,CASP8,CSPG4,CYP1B1,MEGF8,EGR3,EPHB4,VEGFD,FOLR1,GBX2,HOXA7,HOXD11,HOXD13,ID1,JUNB,LAMA5,MMP14,MYH9,MYLK,PIK3CG,PTK2,PTPRJ,SMO,TAL1,TWIST1,PXDN,FZD5,CALCRL,HOXB13,SRPX2,CECR2,SETD2,ASB2,ZNF304,WNK4,COL18A1,CCDC39,NRARP | 38/694 | 38 | 4.4 |
| 10_Member | GO Biological Processes | GO:0048562 | embryonic organ morphogenesis | −3.1457 | −1.03 | ##### | MEGF8,FOLR1,GBX2,HOXA7,HOXD11,MMP14,PAX6,RARB,SMO,TWIST1,ZIC1,FZD5,MAFB,TSHZ1,SETD2,ASB2,ATP8A2,ALX4,CCDC39 | 19/300 | 19 | 3.8 |
| 10_Member | GO Biological Processes | GO:0048598 | embryonic morphogenesis | −2.8991 | −0.9 | ##### | COL7A1,COL12A1,MEGF8,FOLR1,GBX2,HOXA7,HOXD11,HOXD13,LAMA5,MMP14,MMP15,MYH9,PAX6,RARB,SMO,TAL1,TWIST1,ZIC1,ZBTB16,FZD5,NR4A3,MAFB,TSHZ1,CECR2,SETD2,ASB2,ATP8A2,ALX4,TRIM15,CCDC39 | 30/597 | 30 | 3.4 |
| 10_Member | GO Biological Processes | GO:0048568 | embryonic organ development | −2.7136 | −0.8 | ##### | A2M,CASP8,MEGF8,FOLR1,GBX2,HOXA7,HOXD11,JUNB,MMP14,PAX6,RARB,SMO,TAL1,TWIST1,ZIC1,FZD5,MAFB,TSHZ1,SETD2,NSDHL,ASB2,ATP8A2,ALX4,CCDC39 | 24/454 | 24 | 3.3 |
| 10_Member | GO Biological Processes | GO:0007389 | pattern specification process | −2.6277 | −0.76 | ##### | C3,CRKL,MEGF8,EP300,FOLR1,GBX2,HOXA7,HOXD11,HOXD13,LAMA5,PAX6,SMO,STC1,ZIC1,ZBTB16,FZD5,MAFB,TSHZ1,ASB2,ALX4,PLD6,ANKS6,CCDC39,NRARP | 24/461 | 24 | 3.2 |
| 10_Member | GO Biological Processes | GO:0003002 | regionalization | −2.5749 | −0.72 | ##### | C3,CRKL,MEGF8,EP300,FOLR1,GBX2,HOXA7,HOXD11,HOXD13,LAMA5,PAX6,SMO,ZBTB16,FZD5,MAFB,TSHZ1,ASB2,ALX4,PLD6,ANKS6,CCDC39,NRARP | 22/413 | 22 | 3.2 |
| 10_Member | GO Biological Processes | GO:0043009 | chordate embryonic development | −2.5467 | −0.71 | ##### | ADCY9,CASP8,MEGF8,EP300,FOLR1,GBX2,HOXA7,HOXD11,JUNB,MMP14,MYH9,PAX6,RBBP8,SMO,TWIST1,FZD5,CIR1,POLG2,CECR2,SETD2,NSDHL,SBDS,KIAA1217,CHD8,ALX4,ZNF335,UPF3A,CMIP,UBR3,ANKS6,NRARP | 31/658 | 31 | 3.1 |
| 10_Member | GO Biological Processes | GO:0048729 | tissue morphogenesis | −2.5093 | −0.69 | ##### | ADARB1,RHOC,COL5A1,DSP,MEGF8,FOLR1,GBX2,HOXD11,HOXD13,LAMA5,MMP14,MYLK,MYO9A,SMO,STC1,TAL1,TWIST1,FZD5,HOXB13,CECR2,SETD2,ASB2,WNK4,NKD1,TRIM15,KRT71,CCDC39,NRARP | 28/579 | 28 | 3.1 |
| 10_Member | GO Biological Processes | GO:0009792 | embryo development ending in birth or egg hatching | −2.3394 | −0.59 | ##### | ADCY9,CASP8,MEGF8,EP300,FOLR1,GBX2,HOXA7,HOXD11,JUNB,MMP14,MYH9,PAX6,RBBP8,SMO,TWIST1,FZD5,CIR1,POLG2,CECR2,SETD2,NSDHL,SBDS,KIAA1217,CHD8,ALX4,ZNF335,UPF3A,CMIP,UBR3,ANKS6,NRARP | 31/680 | 31 | 2.9 |
| 10_Member | GO Biological Processes | GO:0009952 | anterior/posterior pattern specification | −2.1974 | −0.52 | ##### | CRKL,EP300,GBX2,HOXA7,HOXD13,PAX6,SMO,ZBTB16,FZD5,TSHZ1,ALX4,PLD6,NRARP | 13/213 | 13 | 3 |
| 10_Member | GO Biological Processes | GO:0002009 | morphogenesis of an epithelium | −2.0172 | −0.44 | ##### | RHOC,COL5A1,MEGF8,FOLR1,GBX2,HOXD11,HOXD13,LAMA5,MMP14,MYO9A,SMO,TWIST1,FZD5,HOXB13,CECR2,SETD2,ASB2,WNK4,NKD1,KRT71,CCDC39,NRARP | 22/462 | 22 | 2.7 |
| 11_Member | GO Cellular Components | GO:0005813 | centrosome | −5.92 | −2.63 | ##### | ACADS,CDC25B,CHD3,E2F1,EYA3,IL4R,PTK2,TBCD,TCEA2,DYSF,DYRK3,GPAA1,KAT2B,ATP6V0D1,CIR1,CKAP5,PDCD6IP,RGS14,ENTR1,RAP1GAP2,CLASP2,EXOC7,CAMSAP2,NUP62,CKAP2,VPS4A,CFAP263,SPOUT1,HAUS6,CC2D1A,PXK,TTC12,KMT2E,KIAA1217,TGIF2,CCDC81,CCDC15,CEP78,CCDC77,NEK7,RILPL2,SKA3,RILPL1,RASSF10 | 44/729 | 44 | 5.5 |
| 11_Member | GO Biological Processes | GO:0051301 | cell division | −3.1654 | −1.04 | ##### | RHOC,CCNT2,CDC25B,MYH9,RBBP8,TOP2A,ZBTB16,DYRK3,KNTC1,CKAP5,PDCD6IP,RGS14,ENTR1,CLASP2,SMC5,EXOC7,CKAP2,VPS4A,CECR2,SPOUT1,EXOC6,HAUS6,TEX14,MICAL3,ANAPC1,MYH14,SENP5,SKA3 | 28/522 | 28 | 3.7 |
| 11_Member | GO Cellular Components | GO:0000922 | spindle pole | −2.3658 | −0.6 | ##### | CDC25B,DYNC1I1,KNTC1,CKAP5,RGS14,NUP62,CKAP2,VPS4A,SBDS,SPOUT1,NEK7,RASSF10 | 12/180 | 12 | 3.2 |
| 11_Member | GO Biological Processes | GO:0000278 | mitotic cell cycle | −2.2709 | −0.56 | ##### | RHOC,CDC25B,PAX6,RBBP8,STAT5B,TBCD,CLTCL1,TAOK2,KNTC1,CKAP5,PDCD6IP,RGS14,CLASP2,PHF8,SMC5,EXOC7,NUP62,CKAP2,VPS4A,SETD2,SBDS,GTSE1,RTEL1,EXOC6,TEX14,ANAPC1,MYH14,SKA3 | 28/603 | 28 | 2.9 |
| 11_Member | GO Cellular Components | GO:0005819 | spindle | −2.0119 | −0.43 | ##### | CDC25B,DYNC1I1,MYH9,CLTCL1,KAT2B,MAD2L1BP,KNTC1,CKAP5,RGS14,CLASP2,NUP62,CKAP2,VPS4A,SBDS,SPOUT1,HAUS6,MICAL3,CCAR2,NEK7,SKA3,RASSF10 | 21/435 | 21 | 2.7 |
| 13_Member | GO Biological Processes | GO:0030335 | positive regulation of cell migration | −5.6807 | −2.45 | ##### | ANXA3,RHOC,C5AR1,CASP8,CD74,CDH5,CRKL,CYP1B1,VEGFD,GCNT2,HSPA5,LBP,LGALS3,MMP14,MYLK,NTF3,NTRK3,PAX6,PIK3C2A,PIK3CG,PIK3R1,PTK2,PTPRC,PTPRJ,SMO,STAT3,TWIST1,NR4A3,TNFSF18,DNM1L,SEMA6C,CLASP2,SRPX2,ZNF304,DOCK5,SEMA6D,TIRAP,GLIPR2 | 38/600 | 38 | 5.4 |
| 13_Member | GO Biological Processes | GO:0040017 | positive regulation of locomotion | −5.3187 | −2.32 | ##### | ANXA3,RHOC,C5AR1,CASP8,CD74,CDH5,CRKL,CYP1B1,MEGF8,VEGFD,GCNT2,HSPA5,LBP,LGALS3,MMP14,MYLK,NTF3,NTRK3,PAX6,PIK3C2A,PIK3CG,PIK3R1,PTK2,PTPRC,PTPRJ,SMO,STAT3,TWIST1,NR4A3,TNFSF18,DNM1L,SEMA6C,CLASP2,SRPX2,ZNF304,DOCK5,SEMA6D,TIRAP,GLIPR2 | 39/646 | 39 | 5.2 |
| 13_Member | GO Biological Processes | GO:2000147 | positive regulation of cell motility | −5.1892 | −2.24 | ##### | ANXA3,RHOC,C5AR1,CASP8,CD74,CDH5,CRKL,CYP1B1,VEGFD,GCNT2,HSPA5,LBP,LGALS3,MMP14,MYLK,NTF3,NTRK3,PAX6,PIK3C2A,PIK3CG,PIK3R1,PTK2,PTPRC,PTPRJ,SMO,STAT3,TWIST1,NR4A3,TNFSF18,DNM1L,SEMA6C,CLASP2,SRPX2,ZNF304,DOCK5,SEMA6D,TIRAP,GLIPR2 | 38/630 | 38 | 5.1 |
| 13_Member | GO Biological Processes | GO:0071622 | regulation of granulocyte chemotaxis | −3.9681 | −1.48 | ##### | C5AR1,CD74,LBP,PTK2,PTPRJ,TNFSF18,DNM1L,TIRAP | 8/54 | 8 | 5.4 |
| 13_Member | GO Biological Processes | GO:0002685 | regulation of leukocyte migration | −3.5016 | −1.22 | ##### | APOD,C5AR1,CD74,CRKL,VEGFD,HOXA7,LBP,LGALS3,MMP14,PIK3R1,PTGER4,PTK2,PTPRJ,ST3GAL4,TNFSF18,DNM1L,TIRAP | 17/236 | 17 | 4.2 |
| 13_Member | GO Biological Processes | GO:0090023 | positive regulation of neutrophil chemotaxis | −3.1987 | −1.05 | ##### | C5AR1,CD74,LBP,DNM1L,TIRAP | ####### | 5 | 5.1 |
| 13_Member | GO Biological Processes | GO:0050921 | positive regulation of chemotaxis | −3.131 | −1.02 | ##### | C5AR1,CD74,MEGF8,VEGFD,LBP,NTF3,NTRK3,PTK2,PTPRJ,TNFSF18,DNM1L,TIRAP | 12/146 | 12 | 4 |
| 13_Member | GO Biological Processes | GO:0071624 | positive regulation of granulocyte chemotaxis | −3.044 | −0.98 | ##### | C5AR1,CD74,LBP,DNM1L,TIRAP | ####### | 5 | 4.9 |
| 13_Member | GO Biological Processes | GO:1905523 | positive regulation of macrophage migration | −3.044 | −0.98 | ##### | C5AR1,MMP14,PTK2,PTPRJ,TNFSF18 | ####### | 5 | 4.9 |
| 13_Member | GO Biological Processes | GO:0002687 | positive regulation of leukocyte migration | −2.9775 | −0.94 | ##### | C5AR1,CD74,VEGFD,LBP,LGALS3,MMP14,PIK3R1,PTK2,PTPRJ,TNFSF18,DNM1L,TIRAP | 12/152 | 12 | 3.9 |
| 13_Member | GO Biological Processes | GO:0002690 | positive regulation of leukocyte chemotaxis | −2.8773 | −0.88 | ##### | C5AR1,CD74,VEGFD,LBP,PTK2,PTPRJ,TNFSF18,DNM1L,TIRAP | 9/96 | 9 | 4 |
| 13_Member | GO Biological Processes | GO:0010759 | positive regulation of macrophage chemotaxis | −2.7128 | −0.8 | ##### | C5AR1,PTK2,PTPRJ,TNFSF18 | ####### | 4 | 4.7 |
| 13_Member | GO Biological Processes | GO:0090022 | regulation of neutrophil chemotaxis | −2.5939 | −0.74 | ##### | C5AR1,CD74,LBP,DNM1L,TIRAP | 5/35 | 5 | 4.2 |
| 13_Member | GO Biological Processes | GO:1902624 | positive regulation of neutrophil migration | −2.5388 | −0.71 | ##### | C5AR1,CD74,LBP,DNM1L,TIRAP | 5/36 | 5 | 4.1 |
| 13_Member | GO Biological Processes | GO:0050920 | regulation of chemotaxis | −2.1321 | −0.49 | ##### | C5AR1,CD74,MEGF8,VEGFD,LBP,NTF3,NTRK3,PTK2,PTPRJ,TNFSF18,DNM1L,YTHDF1,TIRAP | 13/217 | 13 | 2.9 |
| 13_Member | GO Biological Processes | GO:0010758 | regulation of macrophage chemotaxis | −2.1073 | −0.47 | ##### | C5AR1,PTK2,PTPRJ,TNFSF18 | ####### | 4 | 3.6 |
| 13_Member | GO Biological Processes | GO:0002688 | regulation of leukocyte chemotaxis | −2.0658 | −0.45 | ##### | C5AR1,CD74,VEGFD,LBP,PTK2,PTPRJ,TNFSF18,DNM1L,TIRAP | 9/127 | 9 | 3 |
| 13_Member | GO Biological Processes | GO:1905521 | regulation of macrophage migration | −2.0366 | −0.44 | ##### | C5AR1,MMP14,PTK2,PTPRJ,TNFSF18 | 5/47 | 5 | 3.3 |
| 14_Member | GO Molecular Functions | GO:0001216 | DNA-binding transcription activator activity | −5.5556 | −2.39 | ##### | CDC5L,DMRT1,E2F1,EGR3,ELK1,FOS,FOSB,GBX2,HOXA7,HOXD13,JUNB,MEF2D,NFATC1,NHLH1,PAX6,SHOX,SOX12,SRY,STAT3,STAT5B,TCF4,TFE3,USF1,ZIC1,ZBTB16,NR4A3,MAFB,PRDM4,ZNF319,ALX4,ZNF750,ZNF786,ARX | 33/491 | 33 | 5.4 |
| 14_Member | GO Molecular Functions | GO:0001228 | DNA-binding transcription activator activity, RNA polymerase II-specific | −5.2594 | −2.27 | ##### | CDC5L,DMRT1,EGR3,ELK1,FOS,FOSB,GBX2,HOXA7,HOXD13,JUNB,MEF2D,NFATC1,NHLH1,PAX6,SHOX,SOX12,SRY,STAT3,STAT5B,TCF4,TFE3,USF1,ZIC1,ZBTB16,NR4A3,MAFB,PRDM4,ZNF319,ALX4,ZNF750,ZNF786,ARX | 32/484 | 32 | 5.2 |
| 15_Member | GO Biological Processes | GO:1902105 | regulation of leukocyte differentiation | −5.4951 | −2.39 | ##### | CASP8,CD74,EGR3,EP300,FOS,HOXA7,IL4R,JUNB,MMP14,TNFRSF11B,PIK3R1,PTPRC,SLC4A2,SOX12,STAT5B,TAL1,TFE3,ZBTB16,SOCS1,TNFSF18,MAFB,HAX1,BRD7,LOXL3,EEIG1,NRARP | 26/340 | 26 | 5.6 |
| 15_Member | GO Biological Processes | GO:1903706 | regulation of hemopoiesis | −4.8737 | −2.08 | ##### | B2M,CASP8,CD74,EGR3,EP300,FOS,HOXA7,IL4R,JUNB,MMP14,TNFRSF11B,PIK3R1,PTPRC,SLC4A2,SOX12,STAT3,STAT5B,TAL1,TFE3,ZBTB16,SOCS1,TNFSF18,MAFB,HAX1,KAT6B,BRD7,LOXL3,EEIG1,NRARP | 29/436 | 29 | 5 |
| 15_Member | GO Biological Processes | GO:0007162 | negative regulation of cell adhesion | −4.2149 | −1.62 | ##### | APOD,CD74,CDH1,CYP1B1,GBP1,GCNT2,HOXA7,IL4R,LGALS3,MMP14,PIK3R1,PTK2,PTPRC,SLC4A2,TBCD,SOCS1,TNFSF18,SOCS6,CLASP2,TNFAIP8L2,LOXL3,NRARP | 22/312 | 22 | 4.7 |
| 15_Member | GO Biological Processes | GO:0045580 | regulation of T cell differentiation | −3.5294 | −1.23 | ##### | CD74,EGR3,EP300,IL4R,JUNB,PTPRC,SLC4A2,SOX12,STAT5B,ZBTB16,SOCS1,TNFSF18,BRD7,LOXL3,NRARP | 15/192 | 15 | 4.3 |
| 15_Member | GO Biological Processes | GO:1902107 | positive regulation of leukocyte differentiation | −3.4574 | −1.21 | ##### | CASP8,CD74,EGR3,EP300,FOS,IL4R,MMP14,PTPRC,SOX12,STAT5B,ZBTB16,SOCS1,HAX1,BRD7,EEIG1 | 15/195 | 15 | 4.2 |
| 15_Member | GO Biological Processes | GO:1903708 | positive regulation of hemopoiesis | −3.4574 | −1.21 | ##### | CASP8,CD74,EGR3,EP300,FOS,IL4R,MMP14,PTPRC,SOX12,STAT5B,ZBTB16,SOCS1,HAX1,BRD7,EEIG1 | 15/195 | 15 | 4.2 |
| 15_Member | GO Biological Processes | GO:1902106 | negative regulation of leukocyte differentiation | −3.3114 | −1.11 | ##### | CD74,HOXA7,IL4R,TNFRSF11B,PIK3R1,SLC4A2,SOCS1,TNFSF18,MAFB,LOXL3,NRARP | 11/120 | 11 | 4.3 |
| 15_Member | GO Biological Processes | GO:0002683 | negative regulation of immune system process | −3.2897 | −1.1 | ##### | A2M,APOD,CD74,CD55,GBP1,HOXA7,IL4R,LGALS3,MNDA,OAS3,TNFRSF11B,PIM1,PIK3R1,PTGER4,PTPRC,PTPRJ,SLC4A2,TNFAIP3,TWIST1,SOCS1,TNFSF18,SOCS6,MAFB,SYT11,RNF115,TNFAIP8L2,LOXL3,ZDHHC12,NRARP,ACOD1 | 30/564 | 30 | 3.8 |
| 15_Member | GO Biological Processes | GO:0045619 | regulation of lymphocyte differentiation | −3.2692 | −1.08 | ##### | CD74,EGR3,EP300,IL4R,JUNB,MMP14,PTPRC,SLC4A2,SOX12,STAT5B,ZBTB16,SOCS1,TNFSF18,BRD7,LOXL3,NRARP | 16/225 | 16 | 4 |
| 15_Member | GO Biological Processes | GO:0046634 | regulation of alpha-beta T cell activation | −3.2205 | −1.06 | ##### | CD55,EP300,IL4R,JUNB,LGALS3,PTPRC,SLC4A2,ZBTB16,SOCS1,TNFSF18,LOXL3 | 11/123 | 11 | 4.2 |
| 15_Member | GO Biological Processes | GO:0045581 | negative regulation of T cell differentiation | −3.1752 | −1.05 | ##### | CD74,IL4R,SLC4A2,SOCS1,TNFSF18,LOXL3,NRARP | 7/54 | 7 | 4.6 |
| 15_Member | GO Biological Processes | GO:1903707 | negative regulation of hemopoiesis | −3.1039 | −1 | ##### | CD74,HOXA7,IL4R,TNFRSF11B,PIK3R1,SLC4A2,SOCS1,TNFSF18,MAFB,LOXL3,NRARP | 11/127 | 11 | 4.1 |
| 15_Member | GO Biological Processes | GO:0046639 | negative regulation of alpha-beta T cell differentiation | −2.9024 | −0.9 | ##### | IL4R,SLC4A2,SOCS1,TNFSF18,LOXL3 | ####### | 5 | 4.7 |
| 15_Member | GO Biological Processes | GO:0045621 | positive regulation of lymphocyte differentiation | −2.8343 | −0.85 | ##### | CD74,EGR3,EP300,IL4R,MMP14,PTPRC,SOX12,STAT5B,ZBTB16,SOCS1,BRD7 | 11/137 | 11 | 3.8 |
| 15_Member | GO Biological Processes | GO:0002695 | negative regulation of leukocyte activation | −2.7862 | −0.84 | ##### | CD74,IL4R,LGALS3,MNDA,PTPRC,SLC4A2,TNFAIP3,SOCS1,TNFSF18,SOCS6,SYT11,TNFAIP8L2,LOXL3,NRARP | 14/204 | 14 | 3.6 |
| 15_Member | GO Biological Processes | GO:0046637 | regulation of alpha-beta T cell differentiation | −2.7599 | −0.82 | ##### | EP300,IL4R,JUNB,SLC4A2,ZBTB16,SOCS1,TNFSF18,LOXL3 | 8/81 | 8 | 3.9 |
| 15_Member | GO Biological Processes | GO:0045620 | negative regulation of lymphocyte differentiation | −2.7329 | −0.81 | ##### | CD74,IL4R,SLC4A2,SOCS1,TNFSF18,LOXL3,NRARP | 7/64 | 7 | 4 |
| 15_Member | GO Biological Processes | GO:0045582 | positive regulation of T cell differentiation | −2.6919 | −0.79 | ##### | CD74,EGR3,EP300,IL4R,PTPRC,SOX12,STAT5B,ZBTB16,SOCS1,BRD7 | 10/122 | 10 | 3.7 |
| 15_Member | GO Biological Processes | GO:0010453 | regulation of cell fate commitment | −2.6631 | −0.78 | ##### | CHD3,EP300,PAX6,TNFSF18,ESRP1,LOXL3 | 6/49 | 6 | 4.1 |
| 15_Member | GO Biological Processes | GO:0022407 | regulation of cell–cell adhesion | −2.6392 | −0.76 | ##### | B2M,CD74,CDH1,CD55,EGR3,EP300,GCNT2,IL4R,LGALS3,PTK2,PTPRC,ST3GAL4,SLC4A2,SOX12,STAT5B,ZBTB16,NR4A3,SOCS1,TNFSF18,SOCS6,PKP3,BRD7,TNFAIP8L2,MEGF10,LOXL3,NRARP | 26/513 | 26 | 3.2 |
| 15_Member | GO Biological Processes | GO:0046636 | negative regulation of alpha-beta T cell activation | −2.6176 | −0.75 | ##### | IL4R,LGALS3,SLC4A2,SOCS1,TNFSF18,LOXL3 | 6/50 | 6 | 4 |
| 15_Member | GO Biological Processes | GO:0010721 | negative regulation of cell development | −2.6012 | −0.74 | ##### | B2M,CD74,CDH1,HOXA7,IL4R,TNFRSF11B,PAX6,PIK3R1,SLC4A2,ABCC8,SOCS1,TNFSF18,MAFB,SEMA6C,SEMA6D,LOXL3,NRARP | 17/285 | 17 | 3.3 |
| 15_Member | GO Biological Processes | GO:0002697 | regulation of immune effector process | −2.5622 | −0.72 | ##### | A2M,AP1G1,B2M,C3,CD1A,CD74,CD55,DNASE1L3,EP300,IL4R,JUNB,LAMP1,LBP,LGALS3,PTPRC,STAT5B,TWIST1,FZD5,NR4A3,TNFSF18,PKP3,LOXL3 | 22/414 | 22 | 3.2 |
| 15_Member | GO Biological Processes | GO:0051250 | negative regulation of lymphocyte activation | −2.5044 | −0.69 | ##### | CD74,IL4R,LGALS3,MNDA,SLC4A2,TNFAIP3,SOCS1,TNFSF18,SOCS6,TNFAIP8L2,LOXL3,NRARP | 12/173 | 12 | 3.4 |
| 15_Member | GO Biological Processes | GO:1903037 | regulation of leukocyte cell–cell adhesion | −2.4737 | −0.67 | ##### | B2M,CD74,CD55,EGR3,EP300,IL4R,LGALS3,PTPRC,ST3GAL4,SLC4A2,SOX12,STAT5B,ZBTB16,NR4A3,SOCS1,TNFSF18,SOCS6,BRD7,TNFAIP8L2,LOXL3,NRARP | 21/395 | 21 | 3.1 |
| 15_Member | GO Biological Processes | GO:0002694 | regulation of leukocyte activation | −2.3677 | −0.6 | ##### | B2M,CD74,CD55,EGR3,EP300,IL4R,JUNB,LBP,LGALS3,MMP14,MNDA,PTPRC,SLC4A2,SOX12,STAT5B,TNFAIP3,ZBTB16,NR4A3,SOCS1,TNFSF18,SOCS6,SYT11,BRD7,ZNF335,TNFAIP8L2,LOXL3,TIRAP,NRARP | 28/593 | 28 | 3 |
| 15_Member | GO Biological Processes | GO:0050866 | negative regulation of cell activation | −2.3649 | −0.6 | ##### | CD74,IL4R,LGALS3,MNDA,PTPRC,SLC4A2,TNFAIP3,SOCS1,TNFSF18,SOCS6,SYT11,TNFAIP8L2,LOXL3,NRARP | 14/227 | 14 | 3.2 |
| 15_Member | GO Biological Processes | GO:0050868 | negative regulation of T cell activation | −2.3506 | −0.6 | ##### | CD74,IL4R,LGALS3,SLC4A2,SOCS1,TNFSF18,SOCS6,TNFAIP8L2,LOXL3,NRARP | 10/136 | 10 | 3.3 |
| 15_Member | GO Biological Processes | GO:0051249 | regulation of lymphocyte activation | −2.2588 | −0.55 | ##### | B2M,CD74,CD55,EGR3,EP300,IL4R,JUNB,LGALS3,MMP14,MNDA,PTPRC,SLC4A2,SOX12,STAT5B,TNFAIP3,ZBTB16,SOCS1,TNFSF18,SOCS6,BRD7,ZNF335,TNFAIP8L2,LOXL3,TIRAP,NRARP | 25/521 | 25 | 2.9 |
| 15_Member | GO Biological Processes | GO:0045785 | positive regulation of cell adhesion | −2.2024 | −0.52 | ##### | B2M,CD74,CRKL,CD55,EGR3,EP300,GCNT2,IL4R,PIK3R2,PTPRC,PTPRJ,ST3GAL4,SOX12,STAT5B,TFE3,UTRN,ZBTB16,NR4A3,SOCS1,TNFSF18,PKP3,BRD7,DOCK5,MEGF10 | 24/499 | 24 | 2.8 |
| 15_Member | GO Biological Processes | GO:0050863 | regulation of T cell activation | −2.1544 | −0.5 | ##### | B2M,CD74,CD55,EGR3,EP300,IL4R,JUNB,LGALS3,PTPRC,SLC4A2,SOX12,STAT5B,ZBTB16,SOCS1,TNFSF18,SOCS6,BRD7,TNFAIP8L2,LOXL3,NRARP | 20/395 | 20 | 2.8 |
| 15_Member | GO Biological Processes | GO:2000328 | regulation of T-helper 17 cell lineage commitment | −2.1326 | −0.49 | ##### | EP300,TNFSF18,LOXL3 | ####### | 3 | 4.1 |
| 15_Member | GO Biological Processes | GO:0043370 | regulation of CD4-positive, alpha-beta T cell differentiation | −2.1168 | −0.48 | ##### | EP300,IL4R,JUNB,SOCS1,TNFSF18,LOXL3 | 6/63 | 6 | 3.3 |
| 15_Member | GO Biological Processes | GO:2000319 | regulation of T-helper 17 cell differentiation | −2.1073 | −0.47 | ##### | EP300,JUNB,TNFSF18,LOXL3 | ####### | 4 | 3.6 |
| 15_Member | GO Biological Processes | GO:0045596 | negative regulation of cell differentiation | −2.0796 | −0.45 | ##### | B2M,CD74,CDH1,COL5A1,E2F1,FOXE3,HOXA7,IL4R,NFATC1,TNFRSF11B,PAX6,PIK3R1,PPARD,RARB,SLC4A2,SMO,STAT3,STAT5B,ABCC8,TWIST1,ZBTB16,SOCS1,TNFSF18,MAFB,SEMA6C,MBNL3,BRD9,ZNF750,SEMA6D,ADGRV1,LOXL3,NRARP | 32/739 | 32 | 2.7 |
| 15_Member | GO Biological Processes | GO:0050865 | regulation of cell activation | −2.0748 | −0.45 | ##### | B2M,CD74,CD55,EGR3,EP300,IL4R,JUNB,LBP,LGALS3,MMP14,MNDA,PTPRC,PTPRJ,SLC4A2,SOX12,STAT5B,TNFAIP3,ZBTB16,NR4A3,SOCS1,TNFSF18,SOCS6,SYT11,BRD7,ZNF335,TNFAIP8L2,LOXL3,TIRAP,NRARP | 29/653 | 29 | 2.7 |
| 15_Member | GO Biological Processes | GO:2000514 | regulation of CD4-positive, alpha-beta T cell activation | −2.0468 | −0.45 | ##### | CD55,EP300,IL4R,JUNB,SOCS1,TNFSF18,LOXL3 | 7/85 | 7 | 3.1 |
| 16_Member | GO Biological Processes | GO:0061564 | axon development | −5.4877 | −2.39 | ##### | ADARB1,APOD,MEGF8,FOLR1,GBX2,MAP1B,NCAM1,NCAM2,PAX6,PTK2,PTPRJ,SCN1B,SMO,TOP2B,CDK5R2,KALRN,TAOK2,MYOT,SEMA6C,SLITRK3,NFASC,CAMSAP2,ATP8A2,SPTBN4,NEUROG2,SEMA6D,SLITRK2,PLEKHG4B,ARX,OR10A4 | 30/427 | 30 | 5.4 |
| 16_Member | GO Biological Processes | GO:0031175 | neuron projection development | −4.9931 | −2.15 | ##### | ADARB1,APOD,CDH1,CRKL,MEGF8,FOLR1,GBX2,MAP1B,NCAM1,NCAM2,NTF3,PAX6,PTK2,PTPRJ,SCN1B,SMO,TOP2B,CDK5R2,KALRN,TAOK2,MYOT,SEMA6C,SLITRK3,NFASC,CAMSAP2,CECR2,ATP8A2,CC2D1A,UBA6,DOCK10,SLC12A5,SPTBN4,ZNF335,NEUROG2,SEMA6D,ADGRV1,SLITRK2,PLEKHG4B,ARX,ADGRF1,OR10A4 | 41/717 | 41 | 4.9 |
| 16_Member | GO Biological Processes | GO:0000902 | cell morphogenesis | −4.7944 | −2.02 | ##### | ADARB1,CDH1,CDH5,DMRT1,EP300,GBX2,MAP1B,MYH9,NCAM1,NTF3,PAX6,PTK2,PTPRJ,SCN1B,SMO,STC1,TAL1,TBCD,TOP2B,CDK5R2,KALRN,TAOK2,MYOT,SEMA6C,SLITRK3,NFASC,NBEAL2,ATP8A2,CC2D1A,DOCK10,SPTBN4,ZNF335,SEMA6D,COL18A1,SLITRK2,PLEKHG4B,ARX,RILPL2,OR10A4,RILPL1 | 40/706 | 40 | 4.8 |
| 16_Member | GO Biological Processes | GO:0007409 | axonogenesis | −3.9731 | −1.48 | ##### | ADARB1,GBX2,MAP1B,NCAM1,PAX6,PTK2,PTPRJ,SCN1B,SMO,TOP2B,CDK5R2,KALRN,TAOK2,MYOT,SEMA6C,SLITRK3,NFASC,ATP8A2,SPTBN4,SEMA6D,SLITRK2,PLEKHG4B,ARX,OR10A4 | 24/370 | 24 | 4.4 |
| 16_Member | GO Biological Processes | GO:0048667 | cell morphogenesis involved in neuron differentiation | −3.8436 | −1.42 | ##### | ADARB1,GBX2,MAP1B,NCAM1,PAX6,PTK2,PTPRJ,SCN1B,SMO,TBCD,TOP2B,CDK5R2,KALRN,TAOK2,MYOT,SEMA6C,SLITRK3,NFASC,ATP8A2,CC2D1A,DOCK10,SPTBN4,SEMA6D,SLITRK2,PLEKHG4B,ARX,OR10A4 | 27/449 | 27 | 4.3 |
| 16_Member | GO Biological Processes | GO:0048812 | neuron projection morphogenesis | −3.4849 | −1.21 | ##### | ADARB1,GBX2,MAP1B,NCAM1,NTF3,PAX6,PTK2,PTPRJ,SCN1B,SMO,TOP2B,CDK5R2,KALRN,TAOK2,MYOT,SEMA6C,SLITRK3,NFASC,ATP8A2,CC2D1A,DOCK10,SPTBN4,ZNF335,SEMA6D,SLITRK2,PLEKHG4B,ARX,OR10A4 | 28/498 | 28 | 4 |
| 16_Member | GO Biological Processes | GO:0120039 | plasma membrane bounded cell projection morphogenesis | −3.416 | −1.17 | ##### | ADARB1,GBX2,MAP1B,NCAM1,NTF3,PAX6,PTK2,PTPRJ,SCN1B,SMO,TOP2B,CDK5R2,KALRN,TAOK2,MYOT,SEMA6C,SLITRK3,NFASC,ATP8A2,CC2D1A,DOCK10,SPTBN4,ZNF335,SEMA6D,SLITRK2,PLEKHG4B,ARX,OR10A4 | 28/503 | 28 | 3.9 |
| 16_Member | GO Biological Processes | GO:0048858 | cell projection morphogenesis | −3.3216 | −1.12 | ##### | ADARB1,GBX2,MAP1B,NCAM1,NTF3,PAX6,PTK2,PTPRJ,SCN1B,SMO,TOP2B,CDK5R2,KALRN,TAOK2,MYOT,SEMA6C,SLITRK3,NFASC,ATP8A2,CC2D1A,DOCK10,SPTBN4,ZNF335,SEMA6D,SLITRK2,PLEKHG4B,ARX,OR10A4 | 28/510 | 28 | 3.8 |
| 16_Member | GO Biological Processes | GO:0007411 | axon guidance | −3.2068 | −1.05 | ##### | GBX2,NCAM1,PAX6,PTK2,PTPRJ,SCN1B,SMO,CDK5R2,KALRN,MYOT,SEMA6C,NFASC,SEMA6D,PLEKHG4B,ARX,OR10A4 | 16/228 | 16 | 4 |
| 16_Member | GO Biological Processes | GO:0097485 | neuron projection guidance | −3.1863 | −1.05 | ##### | GBX2,NCAM1,PAX6,PTK2,PTPRJ,SCN1B,SMO,CDK5R2,KALRN,MYOT,SEMA6C,NFASC,SEMA6D,PLEKHG4B,ARX,OR10A4 | 16/229 | 16 | 3.9 |
| 17_Member | GO Biological Processes | GO:0071345 | cellular response to cytokine stimulus | −3.4736 | −1.21 | ##### | CD74,CNTFR,CRKL,CYP1B1,EPHB4,FOS,GBP1,HSPA5,IFNA10,IFNA14,IFNGR1,IL4R,MNDA,NFATC1,NTRK3,OAS3,PAX6,PIM1,PIK3R1,PRL,PTPRJ,ABCD4,ROS1,CXCL11,STAT3,STAT5B,TRAF3,KMO,SOCS1,TNFSF18,USP10,HAX1,CCR9,TEX14,IFNK,EPG5,EDA2R,MYLK3,ACOD1 | 39/787 | 39 | 3.8 |
| 17_Member | GO Biological Processes | GO:0019221 | cytokine-mediated signaling pathway | −3.0146 | −0.96 | ##### | CD74,CNTFR,EPHB4,IFNA10,IFNA14,IFNGR1,IL4R,NTRK3,OAS3,PIK3R1,PRL,PTPRJ,ROS1,CXCL11,STAT3,STAT5B,TRAF3,SOCS1,TNFSF18,HAX1,CCR9,IFNK,EPG5,EDA2R | 24/431 | 24 | 3.6 |
| 18_Member | GO Biological Processes | GO:0010038 | response to metal ion | −5.3573 | −2.34 | ##### | AMELX,B2M,CASP8,CDH1,DPEP1,FOS,FOSB,JUNB,KCNC1,TNFRSF11B,OTC,ABCC8,SLC30A3,CACNA1G,LONP1,TESMIN,AHCYL1,SETD2,EEF2K,SLC25A39,ADGRV1,MAP1LC3A,CYP2R1,NEK7,MICU2,CPNE2 | 26/346 | 26 | 5.4 |
| 18_Member | GO Biological Processes | GO:0071277 | cellular response to calcium ion | −2.866 | −0.87 | ##### | DPEP1,FOS,FOSB,JUNB,EEF2K,ADGRV1,MICU2,CPNE2 | 8/78 | 8 | 4.1 |
| 18_Member | GO Biological Processes | GO:0071248 | cellular response to metal ion | −2.7803 | −0.83 | ##### | B2M,CDH1,DPEP1,FOS,FOSB,JUNB,EEF2K,SLC25A39,ADGRV1,MAP1LC3A,NEK7,MICU2,CPNE2 | 13/182 | 13 | 3.6 |
| 18_Member | GO Biological Processes | GO:0051592 | response to calcium ion | −2.3061 | −0.58 | ##### | AMELX,DPEP1,FOS,FOSB,JUNB,AHCYL1,EEF2K,ADGRV1,MICU2,CPNE2 | 10/138 | 10 | 3.2 |
| 19_Member | GO Molecular Functions | GO:0140657 | ATP-dependent activity | −5.1541 | −2.23 | ##### | ABCD1,CHD2,CHD3,DYNC1I1,HSPA5,MYH9,MYO9A,PEX6,ABCD4,RFC1,ABCC8,TOP2A,TOP2B,ATP6V0D1,LONP1,DDX20,ATP10B,SMC5,MDN1,SMCHD1,ABCA6,VPS4A,TOR2A,CECR2,RTEL1,ATP8A2,DDX56,TOR4A,UBA6,ATF7IP,TMEM30A,CHD8,MYH14,FBH1,NAV3,SLFN11 | 36/584 | 36 | 5.1 |
| 19_Member | GO Molecular Functions | GO:0016887 | ATP hydrolysis activity | −3.9731 | −1.48 | ##### | ABCD1,CHD2,CHD3,HSPA5,PEX6,ABCD4,RFC1,ABCC8,LONP1,DDX20,ATP10B,SMC5,MDN1,SMCHD1,ABCA6,VPS4A,TOR2A,RTEL1,ATP8A2,DDX56,TOR4A,ATF7IP,CHD8,FBH1,NAV3,SLFN11 | 26/417 | 26 | 4.4 |
| 19_Member | GO Molecular Functions | GO:0140097 | catalytic activity, acting on DNA | −3.3559 | −1.14 | ##### | CHD2,CHD3,DNASE1L3,HSPA5,RAD1,RBBP8,RFC1,TOP2A,TOP2B,DDX20,POLG2,SMCHD1,VPS4A,POLM,CECR2,RTEL1,DDX56,CHD8,FTO,FBH1,POLN | 21/335 | 21 | 4 |
| 19_Member | GO Molecular Functions | GO:0140640 | catalytic activity, acting on a nucleic acid | −3.0291 | −0.97 | ##### | CHD2,CHD3,DNASE1L3,HSPA5,RAD1,RBBP8,RFC1,TOP2A,TOP2B,N4BP1,POP1,DDX20,POLG2,SMCHD1,SND1,VPS4A,POLM,CECR2,RTEL1,DDX56,CDKAL1,NYNRIN,CHD8,FTO,USB1,FBH1,SLFN11,MTFMT,PIWIL4,PLD6,ZC3H12B,POLN | 32/639 | 32 | 3.5 |
| 19_Member | GO Molecular Functions | GO:0017111 | ribonucleoside triphosphate phosphatase activity | −2.8203 | −0.85 | ##### | ABCD1,RHOC,CHD2,CHD3,GBP1,ERAS,HSPA5,PEX6,ABCD4,RFC1,ABCC8,LONP1,DNM1L,RGS14,DDX20,ATP10B,SMC5,MDN1,SMCHD1,ABCA6,VPS4A,TOR2A,RTEL1,ATP8A2,DDX56,TOR4A,LSG1,ATF7IP,CHD8,FBH1,NAV3,SLFN11,AGAP4,DIRAS1,AGAP6 | 35/741 | 35 | 3.3 |
| 19_Member | GO Molecular Functions | GO:0008094 | ATP-dependent activity, acting on DNA | −2.7076 | −0.79 | ##### | CHD2,CHD3,HSPA5,RFC1,TOP2A,TOP2B,DDX20,SMCHD1,VPS4A,CECR2,RTEL1,DDX56,CHD8,FBH1 | 14/208 | 14 | 3.5 |
| 19_Member | GO Molecular Functions | GO:0140658 | ATP-dependent chromatin remodeler activity | −2.3522 | −0.6 | ##### | CHD2,CHD3,HSPA5,DDX20,SMCHD1,VPS4A,CECR2,RTEL1,DDX56,CHD8,FBH1 | 11/158 | 11 | 3.2 |
| 19_Member | GO Molecular Functions | GO:0003689 | DNA clamp loader activity | −2.3113 | −0.58 | ##### | CHD2,CHD3,HSPA5,RFC1,DDX20,SMCHD1,VPS4A,RTEL1,DDX56,CHD8,FBH1 | 11/160 | 11 | 3.2 |
| 19_Member | GO Biological Processes | GO:0140588 | chromatin looping | −2.1744 | −0.51 | ##### | CHD2,CHD3,HSPA5,DDX20,SMC5,SMCHD1,VPS4A,RTEL1,DDX56,CHD8,FBH1 | 11/167 | 11 | 3 |
| 19_Member | GO Biological Processes | GO:0071103 | DNA conformation change | −2.0701 | −0.45 | ##### | CHD2,CHD3,RPA1,TOP2A,TOP2B,RTEL1,CHD8,FBH1 | 8/105 | 8 | 3.1 |
| 19_Member | GO Molecular Functions | GO:0000510 | H3-H4 histone complex chaperone activity | −2.039 | −0.44 | ##### | CHD2,CHD3,HSPA5,DDX20,SMCHD1,VPS4A,RTEL1,DDX56,CHD8,FBH1 | 10/151 | 10 | 2.9 |
| 19_Member | GO Molecular Functions | GO:0140584 | chromatin extrusion motor activity | −2.039 | −0.44 | ##### | CHD2,CHD3,HSPA5,DDX20,SMCHD1,VPS4A,RTEL1,DDX56,CHD8,FBH1 | 10/151 | 10 | 2.9 |
| 19_Member | GO Molecular Functions | GO:0140665 | ATP-dependent H3-H4 histone complex chaperone activity | −2.039 | −0.44 | ##### | CHD2,CHD3,HSPA5,DDX20,SMCHD1,VPS4A,RTEL1,DDX56,CHD8,FBH1 | 10/151 | 10 | 2.9 |
| 19_Member | GO Molecular Functions | GO:0140849 | ATP-dependent H2AZ histone chaperone activity | −2.039 | −0.44 | ##### | CHD2,CHD3,HSPA5,DDX20,SMCHD1,VPS4A,RTEL1,DDX56,CHD8,FBH1 | 10/151 | 10 | 2.9 |
| 19_Member | GO Molecular Functions | GO:0061749 | forked DNA-dependent helicase activity | −2.0366 | −0.44 | ##### | CHD2,CHD3,RTEL1,CHD8,FBH1 | 5/47 | 5 | 3.3 |
| 19_Member | GO Molecular Functions | GO:1990518 | single-stranded 3′-5' DNA helicase activity | −2.0366 | −0.44 | ##### | CHD2,CHD3,RTEL1,CHD8,FBH1 | 5/47 | 5 | 3.3 |
| 19_Member | GO Molecular Functions | GO:0015616 | DNA translocase activity | −2.0199 | −0.44 | ##### | CHD2,CHD3,HSPA5,DDX20,SMCHD1,VPS4A,RTEL1,DDX56,CHD8,FBH1 | 10/152 | 10 | 2.9 |
| 19_Member | GO Molecular Functions | GO:0140674 | ATP-dependent histone chaperone activity | −2.0199 | −0.44 | ##### | CHD2,CHD3,HSPA5,DDX20,SMCHD1,VPS4A,RTEL1,DDX56,CHD8,FBH1 | 10/152 | 10 | 2.9 |
| 19_Member | GO Molecular Functions | GO:0061775 | cohesin loader activity | −2.001 | −0.43 | ##### | CHD2,CHD3,HSPA5,DDX20,SMCHD1,VPS4A,RTEL1,DDX56,CHD8,FBH1 | 10/153 | 10 | 2.9 |
|
|
|
|
|
|
|
|
|
|
|---|---|---|---|---|---|---|---|---|
| hsa05221 | KEGG Pathway | Acute myeloid leukemia | 847 | 68 | 9.956579010296642e-05 | 9 | 0.13 | 0.792 |
| hsa04935 | KEGG Pathway | Growth hormone synthesis, secretion and action | 847 | 122 | 1.413772993250137e-04 | 12 | 0.1 | 0.588 |
| hsa04668 | KEGG Pathway | TNF signaling pathway | 847 | 119 | 4.531485865651061e-04 | 11 | 0.09 | 0.552 |
| hsa05203 | KEGG Pathway | Viral carcinogenesis | 847 | 205 | 5.888436550840925e-04 | 15 | 0.07 | 0.438 |
| hsa04917 | KEGG Pathway | Prolactin signaling pathway | 847 | 71 | 7.283551762929163e-04 | 8 | 0.11 | 0.678 |
| hsa05223 | KEGG Pathway | Non-small cell lung cancer | 847 | 73 | 3.923338614721054e-03 | 7 | 0.1 | 0.576 |
| hsa05222 | KEGG Pathway | Small cell lung cancer | 847 | 93 | 4.119737089772278e-03 | 8 | 0.09 | 0.516 |
| hsa04062 | KEGG Pathway | Chemokine signaling pathway | 847 | 193 | 7.413126253150530e-03 | 12 | 0.06 | 0.372 |
| hsa04012 | KEGG Pathway | ErbB signaling pathway | 847 | 86 | 9.543842827385311e-03 | 7 | 0.08 | 0.486 |
| hsa04630 | KEGG Pathway | JAK–STAT signaling pathway | 847 | 168 | 4.282544466484046e-06 | 17 | 0.1 | 0.606 |
| hsa04060 | KEGG Pathway | Cytokine-cytokine receptor interaction | 847 | 298 | 8.831763135891698e-03 | 16 | 0.05 | 0.324 |
| hsa05161 | KEGG Pathway | Hepatitis B | 847 | 163 | 1.199279412037945e-05 | 16 | 0.1 | 0.588 |
| hsa05167 | KEGG Pathway | Kaposi sarcoma-associated herpesvirus infection | 847 | 196 | 3.280684461878119e-05 | 17 | 0.09 | 0.522 |
| hsa05162 | KEGG Pathway | Measles | 847 | 139 | 1.272111055330517e-04 | 13 | 0.09 | 0.564 |
| hsa04620 | KEGG Pathway | Toll-like receptor signaling pathway | 847 | 109 | 2.113489987063978e-04 | 11 | 0.1 | 0.606 |
| hsa05171 | KEGG Pathway | Coronavirus disease - COVID-19 | 847 | 238 | 3.471081216715737e-04 | 17 | 0.07 | 0.426 |
| hsa05152 | KEGG Pathway | Tuberculosis | 847 | 182 | 5.428785647420490e-04 | 14 | 0.08 | 0.462 |
| hsa05169 | KEGG Pathway | Epstein–Barr virus infection | 847 | 204 | 5.614610525771224e-04 | 15 | 0.07 | 0.444 |
| hsa04621 | KEGG Pathway | NOD-like receptor signaling pathway | 847 | 189 | 7.875531193662043e-04 | 14 | 0.07 | 0.444 |
| hsa05160 | KEGG Pathway | Hepatitis C | 847 | 159 | 1.551451997432882e-03 | 12 | 0.08 | 0.45 |
| hsa05417 | KEGG Pathway | Lipid and atherosclerosis | 847 | 216 | 2.764175030388518e-03 | 14 | 0.07 | 0.39 |
| hsa05164 | KEGG Pathway | Influenza A | 847 | 173 | 3.119625071556026e-03 | 12 | 0.07 | 0.414 |
| hsa04622 | KEGG Pathway | RIG-I-like receptor signaling pathway | 847 | 72 | 3.630165704656456e-03 | 7 | 0.1 | 0.582 |
| hsa05168 | KEGG Pathway | Herpes simplex virus 1 infection | 847 | 182 | 4.698786512943331e-03 | 12 | 0.07 | 0.396 |
| hsa04936 | KEGG Pathway | Alcoholic liver disease | 847 | 144 | 6.630779483506825e-03 | 10 | 0.07 | 0.414 |
| 1,GO pathway enrichment analysis of the Conv1D | ||||||||||
|---|---|---|---|---|---|---|---|---|---|---|
| ONTOLOGY | ID | Description | GeneRatio | BgRatio | pvalue | p.adjust | qvalue | geneID | Count | |
| BP | GO:0032703 | negative regulation of interleukin-2 production | 15/3375 | 28/18870 | 2.10457927126818e-05 | 0.0367689447889173 | 0.0350009391068565 | 7430/5621/84868/50943/9455/7128/3902/10524/64127/5987/51564/89795/1378/5788/7538 | 15 | |
| BP | GO:0034135 | regulation of toll-like receptor 2 signaling pathway | 9/3375 | 12/18870 | 2.41816873259544e-05 | 0.0367689447889173 | 0.0350009391068565 | 1535/7128/730249/64127/9867/114609/9258/7096/10333 | 9 | |
| BP | GO:0034134 | toll-like receptor 2 signaling pathway | 11/3375 | 17/18870 | 2.51640097629239e-05 | 0.0367689447889173 | 0.0350009391068565 | 1535/79155/7128/3654/730249/64127/9867/114609/9258/7096/10333 | 11 | |
| BP | GO:0051090 | regulation of DNA-binding transcription factor activity | 105/3375 | 406/18870 | 3.28244915502979e-05 | 0.0367689447889173 | 0.0350009391068565 | 6872/22954/1540/55859/602/93649/8322/22976/3169/338699/4921/7804/8995/79092/55906/83737/140/7037/200186/5292/5621/84868/50943/7546/4838/64170/59307/60401/367/4793/7128/23028/3654/3586/6608/149951/79918/730249/3606/5314/100533105/23678/9641/5716/7158/3815/4615/10738/8807/6376/25950/58509/306/6280/150372/64127/959/5727/5610/4794/4914/190/8928/1649/8320/6911/117854/5987/7334/4825/8887/107/409/2033/84875/8945/56849/3397/114609/8553/55367/10892/7124/5925/8792/6737/7984/222487/285315/1440/4761/655/57121/6283/80279/5988/10333/26471/137735/9684/9314/3728/5336/9181/65992 | 105 | |
| BP | GO:0061008 | hepaticobiliary system development | 46/3375 | 145/18870 | 3.66578007890298e-05 | 0.0367689447889173 | 0.0350009391068565 | 10,269/5914/2487/5106/4851/55036/3482/5009/4838/2002/54658/54575/54577/54576/54600/7128/123872/3586/9821/10419/6648/23322/55959/2627/26257/5727/8928/6927/3720/51733/83606/7124/10370/9104/11231/34/7494/54903/80279/6928/2735/8140/3184/25836/5253/6926 | 46 | |
| BP | GO:0000725 | recombinational repair | 54/3375 | 179/18870 | 3.9450655639696e-05 | 0.0367689447889173 | 0.0350009391068565 | 8295/348654/196528/5892/2072/8438/7515/158880/3014/23028/2074/2187/55317/78995/56160/65123/79677/9985/7158/115004/10524/7156/27343/56893/29128/7454/23347/23126/63979/64859/79000/387893/4172/375757/7334/57697/2521/64110/22891/5889/7517/254394/79035/675/26122/6119/64710/55183/25939/254225/25836/6118/3364/79728 | 54 | |
| BP | GO:0000724 | double-strand break repair via homologous recombination | 53/3375 | 175/18870 | 4.11812181635874e-05 | 0.0367689447889173 | 0.0350009391068565 | 8295/348654/196528/5892/2072/8438/7515/158880/3014/23028/2074/2187/55317/56160/65123/79677/9985/7158/115004/10524/7156/27343/56893/29128/7454/23347/23126/63979/64859/79000/387893/4172/375757/7334/57697/2521/64110/22891/5889/7517/254394/79035/675/26122/6119/64710/55183/25939/254225/25836/6118/3364/79728 | 53 | |
| BP | GO:0007249 | canonical NF-kappaB signal transduction | 81/3375 | 300/18870 | 5.28138518853611e-05 | 0.0394248437513385 | 0.037529131264432 | 330/22954/6574/387/602/84336/356/554/6363/6366/57162/8904/79753/7037/5187/64170/57153/60401/4793/10758/79594/79155/7128/245937/55870/3654/389/338339/9641/4615/51523/541468/10738/6376/81858/58509/64127/54469/7098/841/93978/10783/55179/9020/10133/4055/684/84270/117854/7334/79671/6284/27032/56848/51311/409/28511/23636/8945/114609/5536/170506/55367/10892/7124/6737/8454/6093/6285/84292/51284/6283/5988/9516/6275/10333/284/4790/7105/5336/65992 | 81 | |
| BP | GO:0042113 | B cell activation | 76/3375 | 278/18870 | 5.67717750019274e-05 | 0.0394248437513385 | 0.037529131264432 | 975/5395/2213/602/22976/165918/1316/3446/6778/4773/57162/3467/7037/3449/8503/3447/3440/50943/2874/4323/3635/10758/79155/7128/1137/3516/3623/6777/3586/54440/4332/3443/3439/3445/7158/3815/3448/3451/23228/259307/10312/150372/64127/959/5074/6461/5585/841/4914/5580/343/684/100141515/2033/9984/114609/7163/51010/10892/1378/359948/64332/2355/11314/55183/3087/222487/5788/939/7494/27242/3567/112616/1141/1026/5336 | 76 | |
| CC | GO:0005925 | focal adhesion | 111/3520 | 421/19886 | 4.93469978870809e-06 | 0.00338833886578312 | 0.0031816066343954 | 6840/7529/975/387/7041/6385/4921/2195/10787/7430/811/3689/6202/5058/3655/5754/3693/3482/4323/5595/6207/3309/4162/998/71/54914/2321/867/126353/8394/4179/58497/120534/118/5094/64098/5880/2580/6278/6522/57514/10971/7052/6203/89/55827/374872/26986/7534/23164/7094/8462/11135/88/57477/6235/2317/6175/5329/3987/6237/10298/8573/11078/3603/5786/6130/9590/9564/2314/10094/6146/6136/57669/375/84951/3936/79038/6645/102/6181/6133/7791/50507/81/23114/3897/7145/83692/22919/5788/23122/567/2037/10544/23385/4008/6730/57175/6641/23545/79853/91179/9902/25996/3728/928/9181/9260/823/23768 | 111 | |
| CC | GO:0030055 | cell-substrate junction | 112/3520 | 431/19886 | 9.14531407768724e-06 | 0.00338833886578312 | 0.0031816066343954 | 6840/7529/975/387/7041/6385/4921/2195/10787/7430/811/3689/6202/5058/3655/5754/3693/3482/4323/5595/6207/3309/4162/998/71/54914/2321/867/126353/8394/4179/58497/120534/118/5094/64098/5880/2580/6278/6522/57514/10971/7052/6203/89/55827/374872/26986/7534/23164/7094/8462/11135/88/57477/6235/2317/6175/5329/3987/6237/10298/8573/11078/3603/5786/6130/9590/9564/2314/10094/6146/6136/57669/375/84951/3936/79038/6645/102/6181/6133/7791/50507/81/23114/3897/7145/83692/22919/5788/23122/567/2037/10544/23385/4008/6730/57175/6641/23545/23676/79853/91179/9902/25996/3728/928/9181/9260/823/23768 | 112 | |
| CC | GO:0000786 | nucleosome | 44/3520 | 134/19886 | 1.60871781166943e-05 | 0.00397353299482348 | 0.00373109639829295 | 8295/8369/8357/8360/8358/257218/8339/8345/8969/3006/8348/8362/8968/3010/8354/3014/7994/3008/55766/8351/7052/85236/10524/3662/8346/8294/54737/8340/8366/8364/8363/56848/440689/8342/26122/3015/64431/85235/23522/8355/7141/3012/3018/8970 | 44 | |
| CC | GO:0098687 | chromosomal region | 98/3520 | 399/19886 | 0.000307165683354358 | 0.0462225969107251 | 0.0434024242602305 | 1639/29117/545/54433/1786/8360/54108/9183/79980/196528/55920/5892/283489/81930/2072/1059/57459/3181/5515/5499/115426/92822/8362/7515/55355/1263/5424/3014/23028/5119/79902/56160/10734/25909/51490/79677/9985/5314/7158/10524/5048/5905/5518/8294/10111/23347/9735/11258/5001/8366/1063/8850/64859/25983/8364/79577/6602/81620/4172/54069/1060/10428/5976/8363/56897/991/4998/56155/7517/9984/79035/6847/675/1062/170506/23353/11004/11243/79682/55183/10664/7514/23122/3104/151246/57132/27085/57082/3012/9031/6118/5253/3018/6839/8970/5347/25936/84516 | 98 | |
| CC | GO:0036064 | ciliary basal body | 49/3520 | 172/19886 | 0.00031189336646913 | 0.0462225969107251 | 0.0434024242602305 | 1639/10013/1540/11092/7430/164395/5692/84080/6792/257177/643037/10807/85302/11190/8556/56912/5314/23322/2733/29070/353116/583/1063/27152/55717/55212/196383/9786/9867/1069/83547/27077/26005/283726/118491/79960/26146/84140/89891/22919/124590/158297/54903/729440/26259/95681/5578/755/25886 | 49 | |
| MF | GO:0140297 | DNA-binding transcription factor binding | 124/3443 | 477/18496 | 3.50747471375936e-05 | 0.0430367147378274 | 0.0427911915078642 | 6872/22954/10413/55859/6256/5396/602/93649/338699/7041/8328/9969/84660/811/8013/8345/8856/1609/8904/200186/2648/5187/50943/115426/10766/5595/2002/11176/8861/2623/7391/367/8638/7290/23028/64324/3516/7994/23019/6777/118/4209/6789/149951/23013/26043/79918/22984/7159/5705/51085/5716/7158/10524/51523/8022/468/7534/2627/4087/60491/10634/6879/583/4824/9611/55809/1387/5585/1063/190/10783/8850/3204/5978/8928/55212/79885/1649/8320/6911/2114/6880/117854/51339/4101/51564/2033/1869/84875/3301/1482/27063/1406/8553/10370/7508/5925/2353/171023/81/51053/1390/10865/11218/64710/10463/79447/3087/84792/59336/80139/26155/80279/9862/7110/1385/4780/9314/3728/8545/2932/6926/65992 | 124 | |
|
| ||||||||||
|
|
|
|
|
|
|
|
|
|
|
|
| Organismal Systems | Immune system | hsa04613 | Neutrophil extracellular trap formation | 62/1709 | 196/9521 | 1.98557527200052e-06 | 0.00069098019465618 | 0.000608213057002264 | 10,013/8369/1535/8357/23236/5332/8360/8358/2212/1184/8339/8345/3689/2214/8969/5894/110117499/8503/5595/8348/8362/8968/71/8354/3014/8331/5880/55766/8351/85236/8346/8294/4689/8340/8366/8364/79885/820/51564/6300/8363/83933/51311/2209/440689/8342/1378/79792/3015/85235/7419/8355/51284/3012/291/4790/5578/2215/3018/8970/7450/5336 | 62 |
| Environmental Information Processing | Signal transduction | hsa04630 | JAK–STAT signaling pathway | 52/1709 | 168/9521 | 2.56063112410219e-05 | 0.00445549815593781 | 0.00392180872165125 | 598/3592/3446/149233/3595/133396/6778/282617/3467/5894/3449/5292/110117499/8503/3447/3440/55801/1271/3587/58985/3572/6777/4170/3586/29949/5156/4352/3443/3439/3445/9306/3448/1442/3451/1439/3953/1387/3455/5617/282616/10379/2033/5781/9180/3562/3590/1440/30837/3567/246778/50615/1026 | 52 |
| Human Diseases | Infectious disease: bacterial | hsa05152 | Tuberculosis | 54/1709 | 182/9521 | 6.59030945166322e-05 | 0.00623072201831116 | 0.00548439233916681 | 387/2213/3592/5993/3446/2212/3689/2214/5894/3449/3929/3447/3440/5595/64170/1263/3587/3654/3920/3586/11151/1509/3606/3443/3439/3445/4615/3448/3451/51806/10312/64127/1387/841/8411/820/6300/56848/2209/2033/114609/10892/7124/1378/5994/23545/7096/10333/1385/9902/4790/2215/51606/7879 | 54 |
| Environmental Information Processing | Signaling molecules and interaction | hsa04060 | Cytokine-cytokine receptor interaction | 80/1709 | 298/9521 | 7.16174944633467e-05 | 0.00623072201831116 | 0.00548439233916681 | 27,189/356/3592/3446/8995/149233/3595/133396/6363/6366/282617/3467/8784/3449/658/3447/3440/93/4838/55801/60401/1271/3587/58985/3623/3572/1233/3586/29949/269/353500/4352/3606/3443/3439/3445/3448/8807/1442/2920/6376/3451/1439/959/3953/3455/5617/282616/9210/2661/3603/4055/6370/151449/6372/10663/9180/7046/8771/285613/656/9966/944/7124/8792/4804/3562/3590/5197/6362/10563/1440/939/27242/655/3567/4982/4283/246778/50615 | 80 |
| Human Diseases | Immune disease | hsa05322 | Systemic lupus erythematosus | 44/1709 | 144/9521 | 0.000145511255361465 | 0.010127583373158 | 0.00891447901267082 | 8369/8357/8360/8358/2212/8339/8345/941/2214/8969/8348/8362/8968/8354/3014/8331/3586/55766/8351/85236/8346/8294/959/8340/8366/8364/8363/2209/440689/729/8342/7124/712/6737/81/3015/85235/8355/3012/721/100293534/2215/3018/8970 | 44 |
| Human Diseases | Cancer: overview | hsa05203 | Viral carcinogenesis | 57/1709 | 205/9521 | 0.000287999651333598 | 0.0167039797773487 | 0.0147031400943995 | 10,013/8369/7529/387/1019/5933/8360/8339/8345/2648/110117499/8503/5595/8348/8362/998/2966/730394/3516/3572/6777/1233/5423/10971/85236/8346/468/7534/8294/8340/5610/1387/841/8366/8850/8364/10379/79885/4055/51564/8363/83933/1027/991/440689/2033/8342/5925/81/728340/7419/1385/4790/1026/3018/8970/23352 | 57 |
| Environmental Information Processing | Signal transduction | hsa04350 | TGF-beta signaling pathway | 34/1709 | 110/9521 | 0.000629924036831327 | 0.0313162235453288 | 0.0275650969500626 | 387/7018/5933/7036/7037/658/5515/93/4838/5595/79639/269/353500/23592/60436/5518/4087/9611/1387/6199/151449/2033/7046/3397/656/7124/9765/8454/6093/64750/4091/655/1875/5519 | 34 |
| Environmental Information Processing | Signal transduction | hsa04151 | PI3K-Akt signaling pathway | 89/1709 | 362/9521 | 0.00076349884028945 | 0.0332121995525911 | 0.0292339687531882 | 9965/7529/1298/6256/2277/598/10110/1019/356/6194/7248/3446/5106/80310/3655/200186/5894/3326/3449/110117499/8503/3693/3447/3440/3911/5515/256076/5595/5528/2321/7422/1292/7143/4170/5156/2792/10971/3667/3443/3439/57818/100533105/23678/3445/3815/3448/253314/1442/3451/468/7534/5518/57521/4902/6199/5585/3455/5617/4914/55844/2997/4254/2251/23035/131873/2264/2253/1288/117145/1027/7424/2255/9180/3481/4846/4804/3562/51764/1440/26291/57121/1385/284/4790/1026/5578/5519/7450/2932 | 89 |
| Organismal Systems | Immune system | hsa04620 | Toll-like receptor signaling pathway | 33/1709 | 109/9521 | 0.0011194660212048 | 0.0432860194865858 | 0.0381011242304793 | 3592/3446/941/3449/3929/110117499/8503/3447/3440/5595/3654/3443/3439/3445/9641/4615/3448/3451/7098/841/3455/10379/6300/51311/114609/7124/2353/5608/51284/7096/10333/4283/4790 | 33 |
| Cellular Processes | Cell growth and death | hsa04110 | Cell cycle | 44/1709 | 158/9521 | 0.00130785915584101 | 0.0445136618096855 | 0.0391817168379265 | 545/7529/9587/1019/5933/29945/51433/5515/5528/8556/10971/994/902/494551/7534/5518/4087/51529/1387/5001/81620/4172/995/1027/991/2033/1869/4998/7029/51343/5925/8454/80174/23594/85417/27085/57082/1026/25836/1875/5519/168448/2932/5347 | 44 |
| Human Diseases | Infectious disease: viral | hsa05161 | Hepatitis B | 45/1709 | 163/9521 | 0.0014070410342142 | 0.0445136618096855 | 0.0391817168379265 | 7529/356/4318/3446/6778/4773/5894/3449/110117499/8503/3447/3440/4214/5595/2002/3654/6777/10971/6554/3443/3439/3445/9641/4615/3448/3451/468/7534/7098/1387/841/6300/2033/1869/7046/114609/7124/5925/2353/7419/5608/1385/4790/1026/5578 | 45 |
| Environmental Information Processing | Signal transduction | hsa04015 | Rap1 signaling pathway | 55/1709 | 212/9521 | 0.00214193606398242 | 0.0614880932369095 | 0.054122913284757 | 999/9965/387/2277/23236/5332/80310/3689/5894/110117499/8503/5595/998/7410/71/2321/84612/2902/7422/2775/5156/5880/3815/51806/7094/889/6237/4254/83593/2251/2264/50855/9855/2253/9564/6300/107/5028/7424/2255/6494/3397/5881/4804/3937/23094/64411/9002/5608/26291/11069/57121/27040/284/5578 | 55 |
| Human Diseases | Endocrine and metabolic disease | hsa04931 | Insulin resistance | 32/1709 | 109/9521 | 0.00229696900022938 | 0.0614880932369095 | 0.054122913284757 | 11,000/5524/5106/10062/200186/6197/10724/110117499/8503/5499/5837/376497/5792/3667/10999/57818/51085/22877/6199/2997/5580/11001/9945/5565/5781/5507/7124/4846/5564/1385/4790/2932 | 32 |
| Metabolism | Carbohydrate metabolism | hsa00040 | Pentose and glucuronate interconversions | 14/1709 | 36/9521 | 0.0024949595631183 | 0.0620175662832264 | 0.0545889648772501 | 54,658/54575/54659/54657/54579/54578/54577/54576/54600/6652/2990/7360/51181/55277 | 14 |
| Human Diseases | Infectious disease: viral | hsa05171 | Coronavirus disease - COVID-19 | 60/1709 | 238/9521 | 0.00284872327072552 | 0.066090379880832 | 0.0581739278442895 | 7311/6194/3592/3446/2212/6202/3449/110117499/8503/3447/3440/4142/5595/6230/6207/4793/4314/3654/3572/9045/3443/6192/3439/3445/9641/6203/51187/4615/115004/3448/3451/6235/7098/103/5610/6175/3455/10379/6130/10747/6146/6300/51311/6157/6136/729/6181/6133/7124/712/2353/6227/1440/51284/721/100293534/4790/5578/7450/5336 | 60 |
| Human Diseases | Cardiovascular disease | hsa05417 | Lipid and atherosclerosis | 55/1709 | 216/9521 | 0.00331850961694038 | 0.0721775841684533 | 0.0635319933243191 | 6256/387/1535/598/356/3592/23236/5332/4318/3446/4773/3326/3449/3929/110117499/8503/3447/3440/6257/5595/1558/3309/998/7410/4314/3654/6648/3606/3443/3439/3445/9641/4615/3448/2920/3451/468/51806/4689/959/841/1649/6300/114609/7124/4846/2081/2353/7494/5608/10333/4780/4790/5578/2932 | 55 |
| Organismal Systems | Immune system | hsa04650 | Natural killer cell mediated cytotoxicity | 37/1709 | 134/9521 | 0.00356406810144224 | 0.0729585705471706 | 0.064219431425368 | 356/3446/4773/3689/5058/2214/5894/3449/110117499/8503/3447/3440/5595/7410/51744/5880/3443/3439/3445/3448/3451/3455/6452/5781/7124/5881/3937/3802/3803/3804/100132285/3808/27040/5578/2215/3932/5336 | 37 |
| Organismal Systems | Immune system | hsa04660 | T cell receptor signaling pathway | 34/1709 | 122/9521 | 0.00433103904613155 | 0.0837334215585434 | 0.0737036469253966 | 387/1019/5062/4773/5058/5894/110117499/8503/5515/5595/998/7410/4793/5528/3586/5518/959/4794/55844/10298/9020/6300/5781/10892/7124/2353/3937/5788/3567/27040/4790/3932/5519/2932 | 34 |
| Human Diseases | Substance dependence | hsa05034 | Alcoholism | 49/1709 | 191/9521 | 0.00459607326522146 | 0.0841807103314246 | 0.074097358458695 | 10,013/8369/8357/8360/8358/8339/8345/8969/5894/5499/5595/8348/8362/8968/8354/3014/2902/2775/6531/8331/2792/55766/8351/85236/8346/468/51806/8294/8340/8366/8364/79885/1392/51564/8363/83933/2030/440689/8342/3015/2905/85235/8355/51764/84152/3012/1385/3018/8970 | 49 |
| Metabolism | Carbohydrate metabolism | hsa00053 | Ascorbate and aldarate metabolism | 12/1709 | 31/9521 | 0.00521903888787691 | 0.0908112766490583 | 0.0799337008616938 | 54,658/54575/54659/54657/54579/54578/54577/54576/54600/219/2990/9104 | 12 |
| Genetic Information Processing | Replication and repair | hsa03420 | Nucleotide excision repair | 20/1709 | 63/9521 | 0.00559159127480614 | 0.0926606554110733 | 0.0815615569407814 | 5426/2072/5981/2966/730394/5435/5424/2074/8450/57654/902/1069/7508/5427/3978/728340/6119/1161/4331/6118 | 20 |
|
| ||||||||||
|
|
|
|
|
|
|
|
|
|
| |
| BP | GO:0034329 | cell junction assembly | 81/1896 | 446/18870 | 9.37201588110588e-08 | 0.000545638764597984 | 0.000525523458933168 | 89,780/4208/222256/7057/389941/23229/56288/1005/28513/10391/3556/84612/1501/10395/1813/351/5728/5911/7481/57669/3273/10718/56940/10686/596/28316/1500/9693/94030/91862/387804/158038/575/8777/577/7010/10207/53942/2047/79983/84189/11141/5789/92737/60437/57502/324/2895/4131/1006/2824/23077/114798/395/26050/2889/79953/7368/22829/5818/55203/27253/1003/1812/257194/6616/3673/7058/149461/140689/287/9948/83700/5317/2596/100506658/84628/3915/2890/1002/2258 | 81 | |
| BP | GO:0055074 | calcium ion homeostasis | 61/1896 | 331/18870 | 2.15513395675874e-06 | 0.00627359494812468 | 0.00604231504613357 | 309/1258/196541/27069/8600/783/6352/729230/10523/2811/5023/489/3358/3356/2835/1813/351/1908/6262/9472/491/596/392862/8048/55177/1193/3062/6444/666/344905/817/2915/84239/65266/8614/25769/1756/664/55013/5144/5910/3357/1003/1812/23236/100507043/287/525/7224/1816/2149/662/2898/54499/845/5336/57620/2890/79572/6375/2280 | 61 | |
| BP | GO:0006874 | intracellular calcium ion homeostasis | 57/1896 | 308/18870 | 4.01740705652711e-06 | 0.00779644796103361 | 0.00750902715442804 | 309/1258/196541/27069/783/6352/729230/10523/2811/5023/489/3358/3356/2835/1813/351/1908/6262/9472/491/596/392862/8048/55177/1193/3062/666/344905/817/2915/84239/8614/25769/1756/664/55013/5144/5910/3357/1003/1812/23236/100507043/287/7224/1816/2149/662/2898/54499/845/5336/57620/2890/79572/6375/2280 | 57 | |
| BP | GO:0007416 | synapse assembly | 41/1896 | 200/18870 | 7.12167550269801e-06 | 0.010365598694177 | 0.00998346457970324 | 89,780/4208/389941/23229/3556/1813/351/5728/5911/10718/94030/387804/158038/575/577/53942/2047/84189/11141/5789/92737/57502/2895/4131/23077/114798/26050/79953/22829/5818/55203/27253/1812/257194/6616/7058/140689/2596/84628/2890/2258 | 41 | |
| BP | GO:0050808 | synapse organization | 78/1896 | 483/18870 | 1.64579812446193e-05 | 0.0191636733612348 | 0.018457192861071 | 1432/57689/89780/4208/389941/728/783/9499/23229/3556/1501/23181/440915/5621/1813/351/5728/5911/66000/10718/23657/94030/387804/8828/158038/575/23237/58504/5063/9758/577/53942/4009/91851/2047/84189/11141/5789/92737/158866/4774/57502/2895/4131/1488/11122/1287/2915/1006/55906/85461/23077/114798/26050/79953/22829/91752/5818/55203/27253/1812/257194/8898/6616/7058/27145/140689/2149/51104/3480/2596/3587/2064/153090/84628/57497/2890/2258 | 78 | |
| BP | GO:0099172 | presynapse organization | 16/1896 | 52/18870 | 3.11258468958062e-05 | 0.0281587840831912 | 0.0271206933430653 | 89,780/728/3556/351/5728/94030/53942/84189/11141/5789/57502/114798/26050/22829/27253/84628 | 16 | |
| BP | GO:0099054 | presynapse assembly | 15/1896 | 47/18870 | 3.38563188908174e-05 | 0.0281587840831912 | 0.0271206933430653 | 89,780/3556/351/5728/94030/53942/84189/11141/5789/57502/114798/26050/22829/27253/84628 | 15 | |
| BP | GO:0007409 | axonogenesis | 72/1896 | 448/18870 | 4.03115967291846e-05 | 0.0293367645196641 | 0.0282552468126798 | 80,031/57689/89780/2297/9499/56288/4692/4684/6696/84612/5362/6285/440915/1813/25942/351/5728/1908/284656/9706/7976/8301/596/8828/1785/575/3800/203228/5063/6586/3730/85440/53942/8239/4009/2047/1600/64283/84189/9355/57453/9353/4131/10494/23077/133418/114798/4781/26050/3670/4825/5818/655/4853/6616/26999/474/7224/673/3320/1947/3480/10716/2596/886/2064/84628/2737/9334/170302/1002/2258 | 72 | |
| BP | GO:0070588 | calcium ion transmembrane transport | 59/1896 | 352/18870 | 5.90456823508165e-05 | 0.0381959958496059 | 0.0367878771792748 | 7416/309/89780/196541/130507/27069/931/9254/783/10368/10523/2811/5023/489/5664/24145/3358/3356/116444/5621/1813/6262/9472/59284/491/117144/773/596/2906/5533/1193/140803/117532/4988/817/777/6332/25769/1756/5142/55013/80036/5144/3357/117531/6335/1812/23236/2332/287/7224/2149/662/54499/845/5336/57620/6375/2280 | 59 | |
| CC | GO:0097060 | synaptic membrane | 73/1977 | 393/19886 | 1.08110831986386e-07 | 7.23261465988922e-05 | 6.81667245893107e-05 | 57,689/51107/10368/1145/5023/3756/5664/23345/3356/22986/8572/116444/6511/1813/5911/59284/8301/491/94030/392862/8828/2906/1785/23237/57451/57706/577/22999/53942/57537/1144/1146/2892/401190/11141/22997/56479/5789/348980/57502/2742/2895/11122/2915/1006/55906/114798/1740/1756/79953/3760/1741/8573/22829/57692/5818/27253/1812/8898/2332/6616/287/115548/2149/51104/53826/10159/2898/2064/84628/57497/2890/9829 | 73 | |
| CC | GO:0014069 | postsynaptic density | 61/1977 | 315/19886 | 2.69337701618193e-07 | 9.00934611912856e-05 | 8.49122543522619e-05 | 57,689/23043/6711/10368/23229/3756/9922/2171/1501/22986/116444/54487/5621/5728/66000/59284/491/1500/94030/339451/392862/2906/6207/1785/575/23237/5063/8777/577/6790/9743/57537/2892/401190/22997/158866/57502/2895/4131/80315/11122/2915/85461/114798/1740/5142/664/79953/5071/1741/22829/120/8898/2332/23705/51104/2596/2898/100131897/2890/9829 | 61 | |
| CC | GO:0045211 | postsynaptic membrane | 54/1977 | 275/19886 | 8.16387333388248e-07 | 0.000144892020200749 | 0.000136559389662889 | 57,689/10368/1145/5023/3756/23345/3356/22986/8572/116444/1813/59284/8301/491/94030/392862/8828/2906/1785/23237/57451/577/57537/1144/1146/2892/401190/11141/22997/348980/57502/2742/2895/11122/2915/55906/114798/1740/1756/79953/1741/22829/57692/27253/1812/2332/287/2149/51104/53826/10159/2898/57497/2890 | 54 | |
| CC | GO:0098984 | neuron to neuron synapse | 66/1977 | 362/19886 | 8.66320001200295e-07 | 0.000144892020200749 | 0.000136559389662889 | 57,689/23043/389941/6711/10368/23229/3756/9922/143425/2171/1501/22986/116444/54487/5621/5728/66000/59284/491/1500/94030/339451/392862/2906/6207/1785/575/23237/5063/8777/577/6790/9743/57537/2892/401190/22997/5789/158866/57502/2895/4131/80315/11122/2915/85461/114798/1740/5142/664/79953/5071/1741/22829/120/5818/8898/2332/23705/51104/2596/2898/100131897/9465/2890/9829 | 66 | |
| CC | GO:0032279 | asymmetric synapse | 61/1977 | 331/19886 | 1.54169182033803e-06 | 0.00017795959043905 | 0.000167725268937127 | 57,689/23043/6711/10368/23229/3756/9922/2171/1501/22986/116444/54487/5621/5728/66000/59284/491/1500/94030/339451/392862/2906/6207/1785/575/23237/5063/8777/577/6790/9743/57537/2892/401190/22997/158866/57502/2895/4131/80315/11122/2915/85461/114798/1740/5142/664/79953/5071/1741/22829/120/8898/2332/23705/51104/2596/2898/100131897/2890/9829 | 61 | |
| CC | GO:0099572 | postsynaptic specialization | 63/1977 | 346/19886 | 1.59605013846681e-06 | 0.00017795959043905 | 0.000167725268937127 | 57,689/23043/6711/10368/23229/3756/9922/2171/1501/22986/116444/54487/5621/5728/66000/59284/491/1500/94030/339451/392862/2906/6207/1785/575/23237/5063/8777/577/6790/9743/57537/1144/2892/401190/22997/158866/57502/2895/4131/80315/11122/2915/85461/114798/1740/5142/664/79953/5071/55914/1741/22829/120/8898/2332/23705/51104/2596/2898/100131897/2890/9829 | 63 | |
| CC | GO:0098839 | postsynaptic density membrane | 26/1977 | 99/19886 | 2.8029848067299e-06 | 0.000267885262243186 | 0.000252479383343039 | 57,689/10368/3756/22986/116444/59284/491/94030/2906/23237/577/57537/2892/401190/57502/2895/11122/2915/114798/1740/79953/1741/22829/51104/2898/2890 | 26 | |
| CC | GO:0005912 | adherens junction | 38/1977 | 188/19886 | 1.67951911794973e-05 | 0.00140449786238546 | 0.00132372625217354 | 27,295/222256/8613/56288/83692/83461/1005/28513/54800/1501/8572/29964/57669/55966/247/28316/1500/117583/1525/9414/357/79983/60437/83478/324/1006/23650/1740/182/1741/5818/1003/5317/301/5239/23336/55691/1002 | 38 | |
| CC | GO:0099634 | postsynaptic specialization membrane | 27/1977 | 122/19886 | 5.31770329208233e-05 | 0.00395282611378119 | 0.00372550207246469 | 57,689/10368/3756/22986/116444/59284/491/94030/2906/23237/577/57537/1144/2892/401190/57502/2895/11122/2915/114798/1740/79953/1741/22829/51104/2898/2890 | 27 | |
| CC | GO:0034703 | cation channel complex | 36/1977 | 193/19886 | 0.000156684664984685 | 0.00945146280682661 | 0.00890791632647178 | 126,755/1258/9254/783/10368/7881/3754/3756/57657/6262/9472/59284/117144/93107/10060/773/3763/257062/80333/3762/26251/56479/348980/777/6332/5142/55013/5144/3760/6335/1260/7224/2898/845/6833/2280 | 36 | |
| CC | GO:0043025 | neuronal cell body | 74/1977 | 489/19886 | 0.000163316873265462 | 0.00945146280682661 | 0.00890791632647178 | 9499/4692/729230/58157/54800/1728/3756/5664/11075/3356/57657/1501/2695/116444/6581/6285/1813/80975/351/59284/23245/6515/7976/8301/491/445/1536/773/6860/9693/339451/23237/3800/203228/6790/5126/80333/57537/401190/1393/92737/4988/3672/1620/4131/777/57282/345193/7150/55906/85461/1740/1996/23001/6653/91752/339479/2690/257194/2332/6616/57626/51218/5562/7224/8507/3320/3480/2596/2898/65109/153090/60481/2890 | 74 | |
| CC | GO:0042734 | presynaptic membrane | 32/1977 | 165/19886 | 0.000169532965144872 | 0.00945146280682661 | 0.00890791632647178 | 51,107/5023/3756/5664/3356/6511/1813/8301/491/94030/2906/57706/22999/53942/401190/56479/5789/348980/3760/8573/5818/27253/1812/2332/6616/115548/53826/2898/2064/84628/2890/9829 | 32 | |
| CC | GO:0005769 | early endosome | 65/1977 | 427/19886 | 0.000336487276560193 | 0.0173161529245207 | 0.0163203140615025 | 1238/9100/23041/10239/51107/55198/89780/125058/4430/913/753/3756/5664/3105/81609/3135/8572/351/11156/66000/59284/23245/8301/3833/11031/23516/10938/7251/23237/57705/57537/2047/1183/666/92737/1730/84239/9910/121260/8905/10228/399979/2889/79953/51617/3140/6653/23317/55614/8898/6456/287/84868/10269/2149/55435/301/286410/2150/2064/51554/2890/112936/79572/9711 | 65 | |
| CC | GO:0098978 | glutamatergic synapse | 62/1977 | 407/19886 | 0.000447031457929247 | 0.0213617175253333 | 0.0201332213007233 | 1432/57689/89780/23043/389941/6711/10368/5023/3556/3356/81609/22986/6511/54487/1813/59284/10718/491/1500/6860/93664/94030/339451/392862/8828/2906/5573/5533/23237/58504/5063/577/6790/2047/401190/11141/5789/348980/57502/2895/1488/11122/2915/1006/85461/114798/1996/55914/1741/22829/27253/1812/23236/6616/6456/1977/10082/27145/53826/2898/84628/2890 | 62 | |
| CC | GO:0016342 | catenin complex | 10/1977 | 31/19886 | 0.000576102851011488 | 0.0256941871551124 | 0.0242165338776057 | 222,256/1005/28513/28316/1500/60437/324/1006/1003/1002 | 10 | |
| CC | GO:0034704 | calcium channel complex | 18/1977 | 79/19886 | 0.000617379768891008 | 0.0258141915867553 | 0.0243296369451127 | 9254/783/10368/6262/9472/59284/117144/773/257062/777/6332/5142/55013/5144/6335/7224/845/2280 | 18 | |
| CC | GO:0043204 | perikaryon | 28/1977 | 149/19886 | 0.000708910846665239 | 0.0278977268481791 | 0.0262933496688841 | 4692/729230/58157/54800/3756/1501/1813/351/23245/6515/445/203228/5126/57537/401190/1393/4988/3672/4131/57282/345193/7150/1740/1996/23001/2332/2596/2898 | 28 | |
| CC | GO:0045177 | apical part of cell | 68/1977 | 469/19886 | 0.000967207586965833 | 0.0359478819822301 | 0.0338805464673997 | 947/479/115584/23043/728/134288/4430/56288/960/5664/60676/3570/84612/6583/9497/10456/6581/6579/28232/55630/5420/351/5728/349633/10913/2195/90/7976/528/55966/23657/491/9693/117583/23516/8842/8777/7010/140803/84552/4646/10207/357/57710/2028/56606/57282/286204/4935/182/5144/1896/92521/9962/2191/287/525/5562/5593/55/131578/3320/301/100506658/3587/2064/64116/10083 | 68 | |
| CC | GO:0034702 | monoatomic ion channel complex | 47/1977 | 300/19886 | 0.00114576772357454 | 0.0403430845827035 | 0.0380229842892603 | 126,755/1258/9254/783/10368/1145/7881/3754/3756/57657/116444/6262/9472/59284/1187/117144/93107/10060/773/3763/257062/2906/1193/80333/1144/2892/3762/26251/56479/348980/2742/2895/777/6332/5142/55013/5144/3760/1741/6335/1260/7224/2898/845/2890/6833/2280 | 47 | |
| CC | GO:0005923 | bicellular tight junction | 24/1977 | 126/19886 | 0.0013562327058533 | 0.0453659840107928 | 0.0427570205687435 | 26/56288/84612/10686/9693/91862/117583/1525/9414/8777/84552/10207/357/79983/324/65266/54587/1741/1003/149461/387597/83700/100506658/55691 | 24 | |
| MF | GO:0030695 | GTPase regulator activity | 83/1891 | 486/18496 | 1.88405411196192e-06 | 0.00105318624858671 | 0.00100251510904921 | 9411/57514/125058/23229/54974/57533/9922/3257/89781/10395/23550/10045/255426/3843/51195/10144/6002/5996/6000/9610/7481/58480/100271927/126432/10928/9462/55616/50619/7409/9693/9815/11033/729540/3156/8729/201627/58504/203228/57706/577/85440/1950/22999/9743/10788/1121/23179/64283/116984/139818/26575/23216/9353/57568/83478/9882/23637/9515/1794/55103/9910/23077/55296/395/5922/140885/26130/2889/57186/84364/5910/3357/9754/23236/60682/116987/54453/23677/93627/23365/55667/153090/9855 | 83 | |
| MF | GO:0060589 | nucleoside-triphosphatase regulator activity | 83/1891 | 486/18496 | 1.88405411196192e-06 | 0.00105318624858671 | 0.00100251510904921 | 9411/57514/125058/23229/54974/57533/9922/3257/89781/10395/23550/10045/255426/3843/51195/10144/6002/5996/6000/9610/7481/58480/100271927/126432/10928/9462/55616/50619/7409/9693/9815/11033/729540/3156/8729/201627/58504/203228/57706/577/85440/1950/22999/9743/10788/1121/23179/64283/116984/139818/26575/23216/9353/57568/83478/9882/23637/9515/1794/55103/9910/23077/55296/395/5922/140885/26130/2889/57186/84364/5910/3357/9754/23236/60682/116987/54453/23677/93627/23365/55667/153090/9855 | 83 | |
| MF | GO:0005096 | GTPase activator activity | 50/1891 | 272/18496 | 2.92132277949876e-05 | 0.010886796224932 | 0.0103630081756956 | 9411/57514/125058/57533/10395/10144/6002/5996/6000/9610/7481/100271927/126432/10928/9462/55616/9693/9815/11033/729540/58504/577/9743/10788/1121/116984/26575/23216/57568/83478/9882/23637/9515/1794/9910/55296/395/5922/26130/57186/84364/3357/9754/23236/60682/116987/54453/93627/23365/153090 | 50 | |
| MF | GO:0044325 | transmembrane transporter binding | 29/1891 | 133/18496 | 6.33722546498059e-05 | 0.0167035341727308 | 0.0158998898866687 | 126,755/7416/9100/10523/489/7881/51185/24145/5716/5621/285966/9472/23327/93107/10060/9414/22999/2257/817/5142/5144/1003/2332/6616/287/3320/6833/2280/2258 | 29 | |
| MF | GO:0001965 | G-protein alpha-subunit binding | 11/1891 | 29/18496 | 7.47027467474543e-05 | 0.0167035341727308 | 0.0158998898866687 | 1813/23328/5996/6000/4988/3357/1812/2149/3480/2150/2890 | 11 | |
| MF | GO:0008143 | poly(A) binding | 10/1891 | 27/18496 | 0.000200247709220392 | 0.0317808706890227 | 0.0302518221133622 | 9987/390748/79882/202559/1654/645974/340529/1996/5937/140886 | 10 | |
| MF | GO:0030552 | cAMP binding | 9/1891 | 23/18496 | 0.000257792846957203 | 0.0317808706890227 | 0.0302518221133622 | 1258/57657/9693/5573/10846/348980/5142/5144/1260 | 9 | |
| MF | GO:0005244 | voltage-gated monoatomic ion channel activity | 37/1891 | 200/18496 | 0.000264326071573915 | 0.0317808706890227 | 0.0302518221133622 | 126,755/7416/9254/783/10368/7881/3754/3756/57657/116444/59284/1187/117144/93107/1536/10060/773/3763/2906/1193/3758/80333/1183/3762/90134/26251/56479/117532/4988/348980/777/6332/3760/117531/6335/6616/6833 | 37 | |
| MF | GO:0022832 | voltage-gated channel activity | 37/1891 | 200/18496 | 0.000264326071573915 | 0.0317808706890227 | 0.0302518221133622 | 126,755/7416/9254/783/10368/7881/3754/3756/57657/116444/59284/1187/117144/93107/1536/10060/773/3763/2906/1193/3758/80333/1183/3762/90134/26251/56479/117532/4988/348980/777/6332/3760/117531/6335/6616/6833 | 37 | |
| MF | GO:0070717 | poly-purine tract binding | 11/1891 | 33/18496 | 0.000284265390778379 | 0.0317808706890227 | 0.0302518221133622 | 9987/390748/79882/202559/1654/645974/340529/1996/2332/5937/140886 | 11 | |
| MF | GO:0022843 | voltage-gated monoatomic cation channel activity | 30/1891 | 153/18496 | 0.000351884393572152 | 0.0357642501830606 | 0.0340435523350666 | 126,755/9254/783/10368/7881/3754/3756/57657/59284/117144/93107/10060/773/3763/2906/3758/3762/90134/26251/56479/117532/4988/348980/777/6332/3760/117531/6335/6616/6833 | 30 | |
| MF | GO:0022839 | monoatomic ion gated channel activity | 53/1891 | 325/18496 | 0.000419572450857082 | 0.038901201474594 | 0.0370295779030359 | 126,755/7416/309/1258/9254/783/10368/1145/5023/7881/3754/3756/57657/116444/6262/59284/1187/117144/93107/1536/10060/773/3763/441027/2906/1193/3758/80333/357/1183/1144/1146/2892/3762/90134/26251/56479/117532/4988/348980/2742/2895/777/6332/3760/117531/6335/6616/1260/662/2898/2890/6833 | 53 | |
| MF | GO:0022836 | gated channel activity | 53/1891 | 326/18496 | 0.000452339552030162 | 0.038901201474594 | 0.0370295779030359 | 126,755/7416/309/1258/9254/783/10368/1145/5023/7881/3754/3756/57657/116444/6262/59284/1187/117144/93107/1536/10060/773/3763/441027/2906/1193/3758/80333/357/1183/1144/1146/2892/3762/90134/26251/56479/117532/4988/348980/2742/2895/777/6332/3760/117531/6335/6616/1260/662/2898/2890/6833 | 53 | |
| MF | GO:1901981 | phosphatidylinositol phosphate binding | 33/1891 | 179/18496 | 0.000588359625690103 | 0.0469847186801096 | 0.0447241790656161 | 4430/56288/3756/143425/81609/56270/4689/8301/11033/8729/29916/55062/9758/57706/79109/3758/9743/10788/116984/695/139285/5321/55614/23236/55102/54843/115548/2596/115004/153090/79685/285590/9711 | 33 | |
| Human Diseases | Neurodegenerative disease | hsa05017 | Spinocerebellar ataxia | 30/921 | 144/9521 | 3.88238757252057e-05 | 0.0133554132494708 | 0.0115654282423507 | 7416/387332/489/116444/6511/5601/9706/10000/7494/773/2906/55062/6315/2892/1600/5704/5602/5295/115209/4976/6908/5707/5290/5713/10213/5695/23236/55102/5689/2890 | 30 |
| Human Diseases | Infectious disease: viral | hsa05165 | Human papillomavirus infection | 52/921 | 333/9521 | 0.000324519391182036 | 0.0392772182527754 | 0.0340130133584316 | 6932/1978/89780/8313/7157/7057/56288/387332/284217/1285/256076/131873/6696/84612/3105/23493/3135/57801/5315/5728/1869/10000/7481/7976/528/1027/55534/1950/84552/10207/5523/3672/324/5295/1287/6908/1740/3918/182/1297/5290/1741/4853/3673/7058/525/8992/3845/5522/5734/3915/5527 | 52 |
| Human Diseases | Cardiovascular disease | hsa05418 | Fluid shear stress and atherosclerosis | 27/921 | 142/9521 | 0.000449565157813773 | 0.0392772182527754 | 0.0340130133584316 | 1432/5603/4205/4208/7157/652/1728/221357/2940/6383/5601/90/10000/3554/445/596/4259/5602/5295/4688/1843/5290/1003/5562/3320/6401/92 | 27 |
| Environmental Information Processing | Signal transduction | hsa04012 | ErbB signaling pathway | 19/921 | 86/9521 | 0.000456711840148551 | 0.0392772182527754 | 0.0340130133584316 | 1978/9542/5601/10000/10718/1027/5063/1950/57144/27/5602/817/5295/5290/3845/3084/673/5336/2064 | 19 |
| Environmental Information Processing | Signaling molecules and interaction | hsa04512 | ECM-receptor interaction | 19/921 | 89/9521 | 0.000717172033937992 | 0.0431903268662005 | 0.037401660046312 | 7057/960/284217/2811/1285/256076/131873/6696/341640/22987/3672/1287/158326/3918/80144/1297/3673/7058/3915 | 19 |
| Metabolism | Amino acid metabolism | hsa00270 | Cysteine and methionine metabolism | 13/921 | 52/9521 | 0.00105743651234008 | 0.0431903268662005 | 0.037401660046312 | 4548/3939/3948/1788/58478/29968/23743/160287/2729/4507/137362/2806/6611 | 13 |
| Human Diseases | Drug resistance: antineoplastic | hsa01522 | Endocrine resistance | 20/921 | 99/9521 | 0.00109578373456348 | 0.0431903268662005 | 0.037401660046312 | 1432/5603/7157/1869/5601/10000/596/1870/1027/5602/5295/182/5290/4853/3845/673/3480/2064/1031/1029 | 20 |
| Human Diseases | Cancer: specific types | hsa05213 | Endometrial cancer | 14/921 | 59/9521 | 0.00119657678579931 | 0.0431903268662005 | 0.037401660046312 | 6932/8313/7157/4292/5728/10000/1950/324/5295/51426/5290/3845/673/2064 | 14 |
| Human Diseases | Cancer: specific types | hsa05222 | Small cell lung cancer | 19/921 | 93/9521 | 0.00125601492869514 | 0.0431903268662005 | 0.037401660046312 | 7157/284217/1285/5728/1869/10000/596/1870/1027/6258/5295/1287/51426/331/3918/5290/3673/7185/3915 | 19 |
| Cellular Processes | Cellular community - eukaryotes | hsa04550 | Signaling pathways regulating pluripotency of stem cells | 26/921 | 144/9521 | 0.00126735916585317 | 0.0431903268662005 | 0.037401660046312 | 1432/5603/6932/89780/8313/652/3720/5013/80712/2103/90/10000/7481/7976/6929/324/5295/3670/5290/1852/3845/463/3480/9421/92/7547 | 26 |
| Environmental Information Processing | Signaling molecules and interaction | hsa04514 | Cell adhesion molecule (CAM) interaction | 28/921 | 160/9521 | 0.00138108603351223 | 0.0431903268662005 | 0.037401660046312 | 57,689/947/4684/83692/2734/3105/3135/6383/10686/94030/1525/84189/5789/57502/6403/114798/26050/22829/5818/1003/257194/149461/23705/83700/6401/100506658/84628/1002 | 28 |
| Cellular Processes | Cell growth and death | hsa04216 | Ferroptosis | 11/921 | 42/9521 | 0.00168411382141365 | 0.0467383488281779 | 0.0404741515250133 | 23,305/643246/7157/2180/5621/23657/1536/23516/2729/30061/64116 | 11 |
| Environmental Information Processing | Signal transduction | hsa04066 | HIF-1 signaling pathway | 21/921 | 110/9521 | 0.00176627481036719 | 0.0467383488281779 | 0.0404741515250133 | 1978/3939/3948/3570/3098/2034/10000/2027/1536/596/1027/160287/1950/7010/817/5295/5290/1977/3480/5336/2064 | 21 |
| NA | NA | hsa04517 | IgSF CAM signaling | 45/921 | 302/9521 | 0.00212154367625393 | 0.0521293589022395 | 0.0451426210811927 | 1432/5603/57689/7280/6711/56288/4684/3556/84612/5362/351/5601/10000/653857/7409/9693/94030/8828/1525/9414/5063/6586/8777/22999/84552/84189/11141/57144/5789/4068/57502/9353/10092/5602/5295/114798/26050/5290/8573/22829/5818/23705/287/83700/5336 | 45 |
| Organismal Systems | Sensory system | hsa04750 | Inflammatory mediator regulation of TRP channels | 19/921 | 99/9521 | 0.00268875145668354 | 0.0616620334066092 | 0.0533976605081714 | 1432/5603/3556/3358/3356/5601/3827/3554/5602/817/5295/5290/3357/5321/23236/1573/5734/5336/2150 | 19 |
| Human Diseases | Drug resistance: antineoplastic | hsa01521 | EGFR tyrosine kinase inhibitor resistance | 16/921 | 80/9521 | 0.00369477619676708 | 0.0750213147549594 | 0.0649664384199924 | 1978/9542/3570/5728/10000/596/1950/5295/5290/1977/3845/3084/673/3480/5336/2064 | 16 |
| Human Diseases | Cancer: specific types | hsa05223 | Non-small cell lung cancer | 15/921 | 73/9521 | 0.00371863590170918 | 0.0750213147549594 | 0.0649664384199924 | 7157/1869/10000/1870/3800/1950/6258/5295/51426/5290/3845/673/5336/2064/1029 | 15 |
| Human Diseases | Cancer: specific types | hsa05224 | Breast cancer | 25/921 | 148/9521 | 0.00395796345322492 | 0.0750213147549594 | 0.0649664384199924 | 6932/89780/8313/7157/8600/23493/5728/1869/10000/7481/7976/1870/4791/1950/324/5295/51426/182/5290/4853/3845/673/5241/3480/2064 | 25 |
| Organismal Systems | Nervous system | hsa04728 | Dopaminergic synapse | 23/921 | 133/9521 | 0.00414361912890764 | 0.0750213147549594 | 0.0649664384199924 | 1432/5603/2784/1813/5601/10000/773/3763/5533/3800/5523/2892/3762/5602/817/3760/1812/23236/1816/5522/5527/2890/9575 | 23 |
| Human Diseases | Cancer: specific types | hsa05214 | Glioma | 15/921 | 76/9521 | 0.00552771842315465 | 0.0937549787085195 | 0.0811892869477081 | 7157/5728/1869/10000/1870/1950/817/5295/51426/5290/3845/673/3480/5336/1029 | 15 |
| Human Diseases | Cancer: specific types | hsa05215 | Prostate cancer | 19/921 | 106/9521 | 0.00588064945660464 | 0.0937549787085195 | 0.0811892869477081 | 6932/7157/5728/1869/10000/596/1870/1027/2119/2078/1950/5295/2915/5290/3845/673/3320/3480/2064 | 19 |
| Environmental Information Processing | Signal transduction | hsa04024 | cAMP signaling pathway | 34/921 | 226/9521 | 0.00605191702163458 | 0.0937549787085195 | 0.0811892869477081 | 1258/5733/489/4852/2695/116444/1813/1908/5601/6262/10000/491/7409/2906/4772/10846/2892/2735/5602/817/5295/7434/5142/5144/486/5290/1812/1260/1816/2149/673/3350/2890/2737 | 34 |
| Human Diseases | Cancer: specific types | hsa05212 | Pancreatic cancer | 15/921 | 77/9521 | 0.00626850148341845 | 0.0937549787085195 | 0.0811892869477081 | 7157/1869/5601/10000/10928/1870/1950/5602/5295/51426/5290/3845/673/2064/1029 | 15 |
| Cellular Processes | Cellular community - eukaryotes | hsa04530 | Tight junction | 27/921 | 170/9521 | 0.00666313340277623 | 0.0944774658252172 | 0.0818149413357909 | 56,288/910/913/84612/51762/5601/653857/23327/10686/9693/91862/9414/2626/53632/8777/84552/10207/10092/5602/1740/1741/149461/5562/83700/5522/100506658/2064 | 27 |
| Cellular Processes | Cellular community - eukaryotes | hsa04510 | Focal adhesion | 31/921 | 203/9521 | 0.00686609490008846 | 0.0944774658252172 | 0.0818149413357909 | 7057/284217/1285/256076/131873/6696/64098/5728/5601/10000/596/7409/5063/1950/57144/3672/5602/5295/1287/331/3918/2889/8395/1297/5290/3673/7058/673/3480/2064/3915 | 31 |
- —Dalian Science and Technology Bureau10.13039/501100009965
- —Guidance Program of Life and Health Field of Dalian City
Peer Reviews
No public reviews on file for this paper yet. If you reviewed it on a platform where reviews are public (OpenReview, ICLR, NeurIPS, ICML), you can paste yours below so the community can read it here.
Videos
No videos yet. Explain this paper in a talk, walkthrough, or lecture? Add one.
Taxonomy
TopicsFerroptosis and cancer prognosis · Gene expression and cancer classification · Cancer Genomics and Diagnostics
Introduction
Cancer is a complex disease characterized by uncontrolled cell growth, often resulting in severe morbidity and mortality if not detected early. Accurate cancer classification is essential for precision oncology, as it guides targeted therapeutic strategies [1, 2]. Traditional methods, such as histopathology, have limitations in capturing the molecular heterogeneity of tumors, necessitating more advanced approaches that leverage genetic information for precise categorization and personalized treatment strategies.
The complexity of genomic data poses significant challenges in distinguishing between pathogenic variants and benign polymorphisms, and silent mutations can further complicate predictive tasks in cancer diagnosis and treatment planning [3–5]. The inherent heterogeneity within cancer genomes means that even patients with the same cancer subtype may exhibit significant variability in mutational landscapes, complicating clinical decision-making [6, 7]. Next-generation sequencing (NGS) has proven invaluable in identifying novel and rare cancer mutations across various cancer types, such as lung, colorectal, and breast cancers, leading to the development of targeted treatments with improved outcomes [8–11]. Additionally, NGS has facilitated molecular profiling of solid tumors, demonstrating high diagnostic yields in cancers like pancreatic and endometrial cancer [12].
Current cancer classification systems, predominantly based on anatomical origin and histology, often fail to capture the full molecular heterogeneity of tumors, resulting in suboptimal treatment strategies and variable patient outcomes. For instance, breast cancers with similar TNM characteristics can exhibit divergent molecular profiles, leading to different responses to therapy [13–15]. This disconnect underscores the need for sophisticated approaches that accurately reflect the biological diversity of tumors. Traditional methods often group heterogeneous cancers together, obscuring crucial molecular differences and limiting the effectiveness of targeted therapies [16].
The integration of advanced analytical techniques, such as artificial intelligence (AI) and machine learning (ML), is crucial for addressing these limitations [17, 18]. AI and ML can efficiently process large datasets and identify complex patterns that are not readily apparent through traditional methods [19]. AI has been pivotal in deciphering complex genetic mutations and signaling pathways in cancer, enhancing our understanding of its molecular intricacies [20, 21]. For example, AI has been used to classify lung cancer types with high accuracy, demonstrating its potential to improve cancer diagnosis and treatment planning [22]. Studies have shown that AI-driven models can identify novel cancer subtypes and predict patient responses to treatment more effectively than traditional methods [23]. Additionally, AI has been applied in predicting adverse events and survival outcomes in patients receiving immunotherapy, further supporting its role in clinical decision-making. For example, DeepCues utilizes convolutional neural networks (CNNs) to classify seven different types of major cancers using raw whole-exome sequencing data from The Cancer Genome Atlas (TCGA), achieving an overall accuracy of 77.6% [24]. While DeepCues represents a significant advancement, its reliance on raw sequencing data limits its applicability in real clinical settings where panel capture sequencing data is more commonly used. This highlights the need for alternative approaches that can better capture the nuanced patterns within genomic data and provide more flexibility for clinical use.
Our study introduces a groundbreaking self-attention based Conv1D machine learning network specifically designed for panel capture sequencing data, achieving an impressive overall classification accuracy of 90.20%. This model demonstrated high precision and recall rates, with colon cancer classification reaching 89.61% precision and 93.24% recall, and lung squamous cell carcinoma at 96.43% precision and 93.91% recall. Through our approach, we identified key genes such as C3orf36, JHY, and TASP1, which showed significant differences in mutation counts across various cancer types. Gene enrichment analysis revealed critical pathways like Acute myeloid leukemia and Growth hormone synthesis, secretion and action.
Materials and methods
Data accumulation and preparation
Our data were sourced from somatic mutation data from The Cancer Genome Atlas (TCGA), as well as from local datasets including BGI's 688 Panel sequencing data, whole genome sequencing data, and exome sequencing data (Table 1). We collected mutation annotation format (MAF) files, which contained detailed information about somatic mutations across various cancer types. Specifically, we targeted 8 cancer types, ensuring a comprehensive representation of diverse malignancies. In total, we retrieved data from 3674 samples, including both tumor and adjacent normal tissues. The distribution of samples across cancer types is presented in Fig. 1, with detailed information available in Table S1. To enhance the robustness of our analysis, we filtered out samples lacking primary tumor data and excluded silent mutations to focus solely on non-silent alterations. This curated dataset served as the foundation for subsequent analyses and model development.
The distribution of samples by source and cancer type. TCGA: Data provided by The Cancer Genome Atlas; Local: Data provided by the authors. CESC: Cervical squamous cell carcinoma and endocervical adenocarcinoma; CHOL: Cholangiocarcinoma; COAD: Colon adenocarcinoma; LIHC: Liver hepatocellular carcinoma; LUAD: Lung adenocarcinoma; LUSC: Lung squamous cell carcinoma; OV: Ovarian serous cystadenocarcinoma; STAD: Stomach adenocarcinoma.
Quality control, variant calling and imputation
The sequencing data processing pipeline was meticulously designed to ensure the accuracy and reliability of variant calling and subsequent imputation for our targeted cancer gene panel (Fig. 2A). To standardize genomic data formats for subsequent integrative analysis, we performed systematic conversion of MAF files obtained from The Cancer Genome Atlas (TCGA) to variant call format (VCF) using VCF2MAF (v1.6.17). This conversion procedure ensured compatibility with locally generated VCF files through rigorous format normalization.
Overview of the cancer classification model. (A) Pipeline for processing mutation data to generate a mutation count matrix; (B) example of annotating mutation files into a mutation count matrix; (C) deep learning architecture.
Subsequently, we addressed missing variants and enhanced dataset completeness by performing genotype imputation on the consolidated VCF files using BEAGLE 5.5 (version 17Dec24.224). BEAGLE was chosen for its state-of-the-art imputation algorithms, which are particularly effective in handling the complexities of genomic data. This step was crucial in filling gaps in the mutation data from the cancer gene panel, thereby ensuring a robust dataset for downstream analyses.
Mutation annotation, gene-based feature matrix construction and feature pruning
To precisely map variants identified in our cancer gene panel to their corresponding genomic loci, we employed the RefSeq Release 110 annotation (hg38 assembly), a stable reference resource depicted in Fig. 2B, for comprehensive variant annotation. The annotation process was carried out using the ANNOVAR software (version 2020-06-08), which is renowned for its robust capabilities in variant annotation. ANNOVAR allowed us to map each variant to its respective gene by considering the genomic coordinates and the specific annotation categories provided by RefSeq. This step ensured that each variant was accurately assigned to the appropriate gene, laying the groundwork for the subsequent construction of our mutation feature matrix.
Following the annotation of variants, we constructed a mutation count matrix to encapsulate the number of variants within each gene across all samples in our dataset. The matrix was structured such that each row represented a unique sample \documentclass[12pt]{minimal} \usepackage{amsmath} \usepackage{wasysym} \usepackage{amsfonts} \usepackage{amssymb} \usepackage{amsbsy} \usepackage{upgreek} \usepackage{mathrsfs} \setlength{\oddsidemargin}{-69pt} \begin{document} i\end{document} , and each column corresponded to a gene \documentclass[12pt]{minimal} \usepackage{amsmath} \usepackage{wasysym} \usepackage{amsfonts} \usepackage{amssymb} \usepackage{amsbsy} \usepackage{upgreek} \usepackage{mathrsfs} \setlength{\oddsidemargin}{-69pt} \begin{document} j\end{document} . The value at the intersection of row \documentclass[12pt]{minimal} \usepackage{amsmath} \usepackage{wasysym} \usepackage{amsfonts} \usepackage{amssymb} \usepackage{amsbsy} \usepackage{upgreek} \usepackage{mathrsfs} \setlength{\oddsidemargin}{-69pt} \begin{document} i\end{document} and column \documentclass[12pt]{minimal} \usepackage{amsmath} \usepackage{wasysym} \usepackage{amsfonts} \usepackage{amssymb} \usepackage{amsbsy} \usepackage{upgreek} \usepackage{mathrsfs} \setlength{\oddsidemargin}{-69pt} \begin{document} j\end{document} , denoted as \documentclass[12pt]{minimal} \usepackage{amsmath} \usepackage{wasysym} \usepackage{amsfonts} \usepackage{amssymb} \usepackage{amsbsy} \usepackage{upgreek} \usepackage{mathrsfs} \setlength{\oddsidemargin}{-69pt} \begin{document} {n}_{ij}\end{document} , represented the total number of variants identified in gene \documentclass[12pt]{minimal} \usepackage{amsmath} \usepackage{wasysym} \usepackage{amsfonts} \usepackage{amssymb} \usepackage{amsbsy} \usepackage{upgreek} \usepackage{mathrsfs} \setlength{\oddsidemargin}{-69pt} \begin{document} j\end{document} for sample \documentclass[12pt]{minimal} \usepackage{amsmath} \usepackage{wasysym} \usepackage{amsfonts} \usepackage{amssymb} \usepackage{amsbsy} \usepackage{upgreek} \usepackage{mathrsfs} \setlength{\oddsidemargin}{-69pt} \begin{document} i\end{document} . The construction of the mutation count matrix was executed through the following steps:
(1) For each sample, we iterated through the list of annotated variants and tallied the number of variants associated with each gene. This process was performed using a custom script written in Python.(2) The resulting counts were organized into a matrix format. Each entry \documentclass[12pt]{minimal} \usepackage{amsmath} \usepackage{wasysym} \usepackage{amsfonts} \usepackage{amssymb} \usepackage{amsbsy} \usepackage{upgreek} \usepackage{mathrsfs} \setlength{\oddsidemargin}{-69pt} \begin{document} {n}_{ij}\end{document} in the matrix was calculated by summing the number of variants in gene \documentclass[12pt]{minimal} \usepackage{amsmath} \usepackage{wasysym} \usepackage{amsfonts} \usepackage{amssymb} \usepackage{amsbsy} \usepackage{upgreek} \usepackage{mathrsfs} \setlength{\oddsidemargin}{-69pt} \begin{document} j\end{document} for sample \documentclass[12pt]{minimal} \usepackage{amsmath} \usepackage{wasysym} \usepackage{amsfonts} \usepackage{amssymb} \usepackage{amsbsy} \usepackage{upgreek} \usepackage{mathrsfs} \setlength{\oddsidemargin}{-69pt} \begin{document} i\end{document} . The final matrix was saved as a CSV file to facilitate further analysis and machine learning modeling.
In the initial mutation count matrix, genes (columns) were ordered alphabetically by official gene symbols for standardization and reproducibility, without implying any biological or functional relationship. Prior to model training, genes with low mutation count variance were removed, and the remaining genes were reordered in descending order according to their Fisher scores, such that the final feature sequence reflected statistical discriminative power rather than predefined biological assumptions.
Self-attention structured machine learning model
To classify cancer subtypes based on the mutation count matrix derived from our cancer gene panel, we developed a deep learning model utilizing PyTorch. The model architecture was designed to integrate convolutional neural networks (CNNs) with attention mechanisms, aiming to enhance classification accuracy and interpretability.
The mutation count matrix served as the input to our model, providing a representation of the mutational landscape across different samples and genes. The model's architecture began with an input layer that fed the mutation count matrix into convolutional layers for feature extraction. These layers were followed by max pooling layers to reduce dimensionality while retaining crucial information. The convolutional layers were succeeded by a self-attention layer, which allowed the model to dynamically weigh the importance of different features, thereby improving its ability to discern significant patterns within the mutation data and enhancing classification performance.
The output from the self-attention layer was then passed through fully connected dense layers. To prevent overfitting and enhance the model's generalization capabilities, dropout was applied to the dense layers. The final layer of the model utilized a softmax activation function, facilitating the classification of samples into distinct cancer subtypes by providing a probability distribution over the possible subtypes.
The entire model was constructed using PyTorch, a deep learning framework that enabled efficient model development and training. The Conv1D and other models’ hyperparameters are detailed in Table S2.
Training, parameter optimization, and model evaluation
The dataset was divided into a training set (64%), a validation set (16%), and a testing set (20%). This partitioning was designed to ensure robust training, validation, and testing of the model across different subsets of the data.
The model structure is shown in Fig. 2C, it was trained using random weight initialization with a batch size of 256 over 65 epochs. We employed the Adam optimization method with a learning rate of 1e−5 and binary cross-entropy as the loss function. To prevent overfitting, dropout was incorporated into the model architecture. We utilized a grid search approach to optimize the hyperparameters, systematically exploring different combinations to identify the settings that yielded the best performance. The specific hyperparameters and their tuning ranges are detailed in Table S3.
The classification threshold was set to 0.5 by default, indicating that any prediction above this threshold was considered indicative of a specific cancer subtype.
We utilized a confusion matrix derived from the validation dataset to measure the effectiveness of the classification model. From this matrix, we calculated several metrics: accuracy (the percentage of samples correctly predicted), precision (the percentage of predicted positive cases that were correctly predicted), recall (the percentage of actual positive cases that were correctly predicted), and F1-score (the harmonic mean of precision and recall). These metrics provided a comprehensive view of the model's classification performance. We also generated a receiver operating characteristic (ROC) curve to demonstrate the model's performance across all classification thresholds and calculated the area under the ROC curve (AUC) as an aggregate measure of performance.
To estimate the uncertainty of the model, we applied direct bootstrapping through random sampling. We performed 10 000 experiments, calculating the average AUC with a confidence interval for each experiment. Additionally, we measured the correlation coefficient to assess the relationship between the model-predicted values and the true labels, with the P calculated using the ‘pearsonr’ function from the Python package ‘scipy’.
Key genes identified and enrichment
We utilized the self-attention mechanism within our model to derive feature scores for each gene. These feature scores provided a quantitative measure of the importance of each gene in the model's decision-making process. By ranking these scores, we identified the top 1000 genes with the highest impact on the model's performance. These genes were deemed crucial for distinguishing between different cancer subtypes based on their mutation patterns.
To elucidate the biological significance of these high-impact genes, we annotated them to the human genome using RefSeq Release 110. Subsequently, we conducted gene enrichment analyses using both the Kyoto Encyclopedia of Genes and Genomes (KEGG) pathways and Gene Ontology (GO) terms by Metascape (https://metascape.org/). For the enrichment analyses, we employed the R package ‘clusterProfiler.’ To determine statistical significance, we applied the Benjamini-Hochberg correction for multiple testing, setting a threshold of an adjusted P < .05 for significance. The KEGG pathway analysis revealed specific biological pathways enriched among the top 1000 genes, providing insights into the molecular mechanisms and signaling pathways potentially altered in the cancer subtypes under study. Similarly, the GO term analysis identified enriched biological processes, molecular functions, and cellular components associated with these genes, allowing us to understand the broader functional categories in which these genes are involved.
Feature attribution via self-attention mechanism
For each trained model, we extracted attention weights from the self-attention layer for all test samples. Attention weights represent the relative importance assigned by the model to each genomic feature when making predictions. To identify the most influential features per model, we aggregated attention weights across all test samples within each run by computing the mean attention weight for each feature. Features were then ranked in descending order, and the top 1000 highest-weighted features were selected as the model's interpretable feature set for that run.
This procedure was repeated independently for all trained models, yielding 1000 sets of top-ranked features. To systematically quantify feature selection consistency across runs, we constructed a binary presence-absence matrix where rows represent individual model runs (n = 1000) and columns represent unique genomic features identified across all runs (n = 44 607 total features in the input data). A matrix entry was coded as 1 if a given feature appeared in the top 1000 for that specific run, and 0 otherwise. This representation enabled calculation of the selection frequency for each feature, defined as the proportion of runs in which the feature was selected.
Statistical identification of stably selected features
To distinguish features selected more frequently than expected by random chance, we applied a binomial test to each feature's selection frequency. Under the null hypothesis of random selection without biological signal, the probability that any given feature is selected in a single run is p_0_ = k/N, where k = 1000 (number of selected features per run) and N = 44,607 (total feature pool size). For each feature i with observed selection count x_i across n = 1000 runs, we computed the one-sided binomial test P-value as:
\documentclass[12pt]{minimal} \usepackage{amsmath} \usepackage{wasysym} \usepackage{amsfonts} \usepackage{amssymb} \usepackage{amsbsy} \usepackage{upgreek} \usepackage{mathrsfs} \setlength{\oddsidemargin}{-69pt} \begin{document} $$ \mathrm{P}\left(\mathrm{X}\ge \mathrm{x}\_\mathrm{i}|\mathrm{n}=1000,{\mathrm{p}}_0=1000/44607\right) $$\end{document}This tests whether the observed selection frequency significantly exceeds the random expectation. To control the false discovery rate arising from testing 44 607 features simultaneously, we applied Benjamini-Hochberg FDR correction using the multipletests() function from the statsmodels package (v0.14.2). Features with FDR-corrected q-values <0.05 were classified as significantly stable.
All stability analyses were implemented in Python 3.10.14 using NumPy (v1.26.4) for numerical operations, SciPy (v1.13.1) for statistical testing, pandas (v1.5.3) for data manipulation, and statsmodels (v0.14.2) for multiple testing correction. Visualizations were generated using Matplotlib (v3.8.4) and Seaborn (v0.13.2).
Gene annotation and functional enrichment analysis
To assess the biological relevance of stably selected features, we performed functional enrichment analysis on features with high selection frequency (FDR< 0.05). Each genomic feature index was first mapped to its corresponding gene symbol(s) based on genomic coordinates. For features spanning multiple genes or gene boundaries, all associated gene symbols were extracted. When a feature's annotation contained multiple genes separated by semicolons (encoded as \x3b in the data), we parsed and de-duplicated all symbols to create a comprehensive gene list.
Gene symbols were converted to Entrez Gene IDs using the bitr() function from the clusterProfiler R package (v4.10.1), querying the org.Hs.eg.db annotation database (v3.18.0) for Homo sapiens. We performed Gene Ontology (GO) enrichment analysis across all three ontologies—Biological Process.
Results
High accuracy of self-attention based Conv1D network in classifying variant cancer types
Our study focused on developing a self-attention based Conv1D machine learning network to enhance cancer classification accuracy using genomic variant data. This approach demonstrated remarkable performance in classifying various cancer types, as evidenced by our analysis of the learning curve, learning result statistics, and the Receiver Operating Characteristic (ROC) curve. The learning curve, depicted in Fig. 3A, showed the model's accuracy over 23 epochs. Initially, the training accuracy rapidly increased from ~40% to ~85% within the first few epochs, indicating quick learning of fundamental patterns. The validation accuracy followed a similar trend, starting at ~70% and reaching 90% by the 5th epoch, suggesting effective generalization to unseen data. As training progressed, both training and validation accuracies continued to improve, with training accuracy remained at or above 95% after the 10th epoch, while validation accuracy reached around 90% by the 15th epoch. This convergence at high levels indicated successful classification without overfitting. The final epochs showed minimal fluctuations, with training accuracy just above 95% and validation accuracy maintaining a steady 90%, demonstrating the model's robustness and ability to maintain high accuracy.
Performance of the deep learning model. (A) Learning curves for the training and testing sets; (B) confusion matrix for model predictions across eight cancer types; (C) ROC curves. Class 0: CESC; class 1: CHOL; class 2: COAD; class 3: LIHC; class 4: LUAD; class 5: LUSC; class 6: OV; class 7: STAD.
Our model achieved an overall classification accuracy of over 90%, as detailed in the learning result statistics, showcasing its effectiveness in distinguishing between various cancer types. The confusion matrix revealed high precision and recall across most cancer types (Table 2). For instance, lung squamous cell carcinoma was classified with a precision of 96.43% and a recall of 93.91%, indicating minimal misclassifications. Similarly, colon cancer showed a precision of 89.61% and a recall of 93.24%. However, it should be noted that certain malignancies exhibit lower diagnostic accuracy, which may be attributed to substantial genetic overlap with other cancer types that share common molecular signatures and pathogenic pathways. For example, cholangiocarcinoma and cervical cancer exhibited some overlap in classification, with a few instances of cervical cancer being misclassified as cholangiocarcinoma and vice versa. Despite these minor errors, the overall performance remained exceptionally high, with most cancer types achieving precision and recall rates around 90%. This high level of accuracy underscores the potential of our self-attention based Conv1D network in clinical settings. The model's ability to handle the complexity of genomic data was highlighted, effectively capturing nuanced patterns that distinguish one cancer type from another, with the attention mechanism playing a pivotal role in focusing on the most relevant genetic variants.
The confusion matrix heatmap (Fig. 3B) clearly illustrates the model's performance across eight different cancer types: cervical squamous cell carcinoma and endocervical adenocarcinoma (CESC), cholangiocarcinoma (CHOL), colon adenocarcinoma (COAD), liver hepatocellular carcinoma (LIHC), lung adenocarcinoma (LUAD), lung squamous cell carcinoma (LUSC), ovarian serous cystadenocarcinoma (OV), and stomach adenocarcinoma (STAD). The diagonal elements of the matrix show the correct classification rates, with CESC achieving 77.46%, CHOL at 84.62%, COAD at 93.24%, LIHC at 85.06%, LUAD at 90.08%, LUSC at 93.91%, OV at 94.55%, and STAD at 95.79%. These high values along the diagonal indicate the model's strong ability to correctly classify each cancer type. Off-diagonal elements represent misclassifications, with the most notable being 16.90% of CESC samples misclassified as CHOL and 15.38% of CHOL samples misclassified as COAD.
The ROC curve, as depicted in Fig. 3C provided another valuable perspective on the model's performance. The ROC curve illustrates the trade-off between the true positive rate (sensitivity) and the false positive rate (1-specificity) for different classification thresholds. The area under the curve (AUC) values for individual cancer classes ranged from 0.98 to 1.00, indicating excellent discrimination ability. Specifically, the AUC for class 0 was 0.99, class 1 was 0.98, class 2 was 0.99, class 3 was 0.99, class 4 was 0.99, class 5 was 0.98, class 6 was 1.00, and class 7 was 1.00. The micro-average ROC curve, which aggregates the performance across all classes, achieved an AUC of 0.99, further validating the high overall performance of our model. The ROC curves demonstrated that our model maintained high sensitivity and specificity across all cancer types, with minimal false positives and high true positives. This robust performance across different classes underscored the model's ability to accurately classify cancer types while minimizing misclassifications.
Genetic proximity of cancer types revealed through distance matrix and hierarchical clustering
We employed hierarchical clustering to explore the genetic proximity of different cancer types, utilizing both a comprehensive dataset encompassing all genes and a focused dataset consisting of the top 1000 genes identified through our self-attention based Conv1D network. This analysis aimed to uncover underlying genetic relationships between cancer types that may not be apparent through traditional clinical or organ-based classifications. The first dendrogram, depicted in Fig. 4A was constructed using all available genes. The spatial distance dendrogram, using complete linkage and Euclidean distance, reveals the hierarchical clustering of these cancer types based on their genetic profiles. In this dendrogram, the maximum spatial distance reaches up to 10 000 units, indicating significant genetic variation between the cancer types. The tree shows that COAD and LIHC cluster together at a relatively low distance, suggesting a closer genetic relationship between these two cancer types. Similarly, LUSC and OV also form a cluster, indicating shared genetic characteristics. On the other hand, CHOL and LUAD appear to be more genetically distant from the other cancer types, with CHOL branching off early in the dendrogram.
Spatial distance dendrogram of cancer types. (A) Complete linkage spatial distance dendrogram based on all genes; (B) complete linkage spatial distance dendrogram based on the top 1000 genes.
The second dendrogram, depicted in Fig. 4B was constructed using only the top 1000 genes identified by the attention layer in our self-attention based Conv1D network. This focused approach aims to highlight the genetic proximity of cancer types based on the most influential genes in our classification model. In this dendrogram, the maximum spatial distance is significantly reduced to 1500 units, indicating that the genetic variation captured by the top 1000 genes is less than that captured by all genes. The tree reveals a different clustering pattern compared to the all-genes dendrogram. Here, COAD and LIHC still cluster together, but at a much closer distance, reinforcing their genetic similarity. Interestingly, CESC and CHOL now form a distinct cluster, suggesting that these cancer types share significant genetic features when considering only the top 1000 genes. LUSC and OV, which clustered together in the all-genes dendrogram, are now more distant from each other, with LUSC aligning more closely with LUAD and STAD.
Identification of key genes in cancer classification using attention layer
The self-attention based Conv1D network played a crucial role in identifying key genes that significantly contribute to the classification of various cancer types. By leveraging the attention mechanism, our model focused on the most relevant genetic variants, enhancing its classification accuracy. We analyzed box plots for the top 10 genes with the largest intergroup differences from the top 50 weighted genes, and conducted KEGG and GO pathway enrichment analysis on the top 1000 genes to understand the biological pathways associated with these genes.
The box plots, depicted in Fig. 5 visually represent the distribution of mutation counts across different cancer types for genes such as C3orf36, JHY, PLAC8;COQ2, PLS3, TASP1, TSPYL2, TRIM53AP, LOC105372695;MIR296, SAP30L, and SLC16A2;RLIM, allowing us to assess the variability and significance of mutations in each gene across cancer types. For C3orf36, the box plot showed a significant difference in mutation counts across cancer types with Kruskal-Wallis P < 2.22e-308, indicating strong statistical significance. The median mutation count varied from 0 to 7.5, with CESC showing the highest median mutation count. Similarly, JHY exhibited significant differences in mutation counts, with Kruskal-Wallis P < 2.22e-308. The median mutation count ranged from 120 to 160, with COAD showing the highest median mutation count. PLAC8;COQ2 and PLS3 also showed significant differences in mutation counts across cancer types, with Kruskal-Wallis P < 2.22e-308. The median mutation counts for PLAC8;COQ2 ranged from 0 to 100, while for PLS3, they ranged from 10 to 40. TASP1, with Kruskal-Wallis P < 2.22e-308, showed median mutation counts ranging from 0 to 250, with LIHC having the highest median count. TSPYL2, TRIM53AP, LOC105372695;MIR296, SAP30L, and SLC16A2;RLIM also exhibited significant differences in mutation counts across cancer types, with Kruskal-Wallis P ranging from 1.04e-301 to 2.06e-183. These genes showed varying median mutation counts, with some cancer types consistently showing higher mutation counts than others, indicating their potential role in cancer classification and development.
Boxplots of the top 10 genes with the lowest Kruskal-Wallis test Ps among the top 50 genes by weight.
To identify key pathways involved in cancer type differentiation, we analyzed the top 1000 genes contributing to classification across eight cancer types (Table S4). We subsequently performed Gene Ontology (GO) enrichment analysis on these genes to elucidate the biological processes, molecular functions, and cellular components most relevant to each cancer type (Table 3). GO enrichment analysis revealed several significantly enriched pathways (Fig. 6A). Chromatin binding (GO:0003682) emerged as the most significantly enriched molecular function (LogP = −7.53), highlighting the critical role of epigenetic regulation in cancer type specificity. Cytoskeletal regulation pathways were prominently enriched, particularly regulation of protein-containing complex assembly (GO:0043254, LogP = −7.14) and microtubule-associated processes. These findings align with the established importance of cytoskeletal dynamics in cancer migration and invasion mechanisms. Tissue-specific developmental pathways were markedly enriched, including muscle structure development (GO:0061061, LogP = −7.03) and heart development (GO:0007507), suggesting developmental program reactivation as a distinguishing feature between cancer types. Immune-related processes, particularly leukocyte activation (GO:0045321, LogP = −6.88) and hemopoiesis (GO:0030097, LogP = −6.16), were significantly enriched, reflecting cancer type-specific immune microenvironment signatures. Angiogenesis (GO:0001525, LogP = −4.86) and vasculature development (GO:0001944) pathways demonstrated high enrichment scores, consistent with the varied vascularization patterns observed across different cancer types.
Enrichment plots of the top 1000 genes by weight. (A) GO enrichment analysis; (B) KEGG pathway enrichment.
To further characterize the molecular mechanisms distinguishing cancer types, we performed KEGG pathway enrichment analysis on the top 1000 classification-driving genes (Table 4). Figure 6B illustrates significant enrichment of multiple cancer-relevant pathways. JAK–STAT signaling (hsa04630, P = 4.28 × 10^−6^) emerged as the most significantly enriched pathway with 17 regulated genes, underscoring its central role in cancer type-specific signaling. Several pathways related to viral carcinogenesis were prominently enriched, including Epstein–Barr virus infection (hsa05169, P = 5.61 × 10^−4^), hepatitis B (hsa05161, P = 1.20 × 10^−5^), and human papillomavirus infection (hsa05165, P = 3.28 × 10^−5^), reflecting the established etiological role of viral infections in specific cancer types. Acute myeloid leukemia pathway (hsa05221, P = 9.96 × 10^−5^) showed the highest rich factor (0.132), suggesting particularly strong relevance despite involving fewer genes. TNF signaling (hsa04668, P = 4.53 × 10^−4^) and cytokine-cytokine receptor interaction (hsa04060, P = 8.83 × 10^−3^) pathways were significantly enriched, indicating important differences in inflammatory response across cancer types. Small cell lung cancer pathway (hsa05222, P = 4.12 × 10^−3^) and non-small cell lung cancer pathway (hsa05223, P = 3.92 × 10^−3^) enrichment corroborate the inclusion of lung cancer subtypes in our analysis. Prolactin signaling (hsa04917, P = 7.28 × 10^−4^) and ErbB signaling (hsa04012, P = 9.54 × 10^−3^) pathways, both involved in growth factor signaling, exhibited notable enrichment. These results highlight the distinct signaling networks that define and differentiate major cancer types.
Comprehensive performance assessment of Conv1D versus traditional machine learning models
To benchmark the Conv1D model against traditional machine learning approaches, we trained Random Forest (RFC), Logistic Regression (LR), and k-Nearest Neighbor (KNN) classifiers on the same 8-cancer classification task, performing 1000 independent runs for Conv1D and RFC. Both Conv1D and RFC demonstrated strong and stable discriminatory performance with near-ceiling AUC values (Fig. 7A). The Conv1D model achieved a mean AUC of 0.9916 (median = 0.9932; bootstrap 95% CI: [0.9911, 0.9920]) and a mean accuracy of 0.9296 (95% CI: [0.9283, 0.9310]). In comparison, RFC yielded a mean AUC of 0.9901 (median = 0.9902; 95% CI: [0.9899, 0.9902]) and mean accuracy of 0.9140 (95% CI: [0.9133, 0.9147]), while LR achieved an accuracy of 0.8871 and AUC of 0.9885, and KNN reached an accuracy of 0.8571 with AUC of 0.9740.
Performance comparison between Conv1D and RFC classification models. (A) Distribution of AUC values obtained from 1000 runs of the Conv1D and RFC models; (B) KEGG pathway enrichment analysis results based on significant features identified from 1000 runs of the Conv1D and RFC models.
AUC values of Conv1D, RFC, and LR were all significantly greater than random performance (AUC = 0.5; one-sided Wilcoxon signed-rank test, P < .001). While the Conv1D model exhibited moderately higher performance variability across runs, it consistently achieved superior median and upper-quartile AUC values. This pattern suggests that Conv1D is more capable of capturing complex, non-linear mutational patterns when adequately trained, albeit at the cost of increased sensitivity to initialization and training conditions.
Functional enrichment analysis of significantly stable features (FDR < 0.05) revealed fundamental differences in biological interpretability between the models (Fig. 7B). The Conv1D model identified 3776 significantly stable genes—60% more than RFC's significantly stable 2353 genes—with enrichment of cancer-type-specific pathways directly relevant to the classification task (Table 5, Supplementary Tables S5 and S6). Top-ranked Conv1D pathways included ‘Neutrophil extracellular trap formation’ (KEGG hsa04613, 62 genes, q = 0.0006; promotes progression in HCC, breast, pancreatic, gastric, ovarian, colon cancers via invasion, metastasis, EMT [25, 26]), ‘JAK-STAT signaling pathway’ (hsa04630, 52 genes, q = 0.0039; drives proliferation, survival, invasion, angiogenesis, immune suppression across multiple cancers [27]), ‘Cytokine-cytokine receptor interaction’ (hsa04060, 80 genes, q = 0.0055; enhances survival, proliferation, chemoresistance in epithelial cancers [28]), and tissue-specific drivers such as "Hepatitis B″ for LIHC (hsa05161, 45 genes, q = 0.064; promotes HCC via chronic inflammation, oncogenesis [29]), "Tuberculosis" for lung cancers (hsa05152, 54 genes, q = 0.0055; chronic Mycobacterium tuberculosis infection promotes lung carcinogenesis through sustained inflammation and oxidative stress [30]), and immune processes like ‘negative regulation of interleukin-2 production’ for other immune microenvironments (GO:0032703, 15 genes, q = 0.035; contributes to immune evasion, suppression [31, 32]). These pathways mechanistically align with known cancer biology: chronic inflammation driving COAD/STAD/OV tumorigenesis via NF-κB/STAT3, cytokine secretion, viral oncogenesis in LIHC, and immune dysregulation in ovarian cancer via PD-L1, TAMs/Tregs [33–35]. In stark contrast, RFC top enriched pathways were dominated by neuronal and generic processes mechanistically irrelevant to epithelial carcinoma pathogenesis, such as "Spinocerebellar ataxia" (hsa05017, 30 genes, q = 0.012; neurodegenerative, no direct role in carcinomas) and "Dopaminergic synapse" (hsa04728, 23 genes, q = 0.065; limited, context-dependent in some tumors like GBM but irrelevant broadly), despite including some relevant terms like ‘Human papillomavirus infection’ for CESC (hsa05165, 52 genes, q = 0.034; promotes via transformation), likely reflecting dataset-specific noise.
Cross-validation with the IntOGen Cancer Drivers database (v2024.09.20) [36] indicated that Conv1D-selected genes maintained slightly higher biological relevance compared to RFC. Among all selected genes (selection pval ≤0.05), 155/4329 (3.6%) of Conv1D genes overlapped with known cancer drivers, versus 90/2666 (3.4%) for RFC (Fisher's exact test, Conv1D versus RFC: P = .35), corresponding to a 6.1% relative enrichment gain over RFC. Although the difference was not statistically significant, these results suggest that Conv1D tends to select a broader and more biologically coherent set of genes.
These findings demonstrate that the Conv1D model's self-attention mechanism not only achieves higher classification accuracy but also prioritizes biologically meaningful, cancer-type-specific features over dataset-specific noise, outperforming traditional machine learning models in both predictive and functional relevance.
Discussion
The integration of advanced machine learning techniques into cancer classification represents a significant advancement in precision oncology. Our self-attention based Conv1D network achieved an overall classification accuracy of 90.20%, with the highest accuracy observed in STAD (95.79%) and the lowest in CESC (77.46%). The high precision and recall rates underscore the model's ability to accurately distinguish between cancer types despite their genetic complexity. In a clinical setting, precise cancer classification is crucial for guiding treatment strategies. The inclusion of local data, such as BGI's 688 Panel sequencing data with clinical applicability, enhancing the model's practicality and reliability in clinical environments.
The hierarchical clustering analysis using the top 1000 genes identified by our model revealed genetic relationships between cancer types that are not apparent through traditional classifications. In the dendrogram resulting from cluster analysis, CESC and CHOL exhibit relative proximity in spatial distance, which corresponds to the phenomenon observed in the confusion matrix where 16.90% of CESC samples are misclassified as CHOL. Similarly, LIHC and CHOL demonstrate mutual misclassification, which aligns with their close positioning in the dendrogram. These observations suggest that cancer types with closer spatial distances have a higher probability of being mutually misclassified during the classification process. This conclusion becomes more evident in the hierarchical clustering analysis conducted using the top 1000 genes. This suggests that focusing on the most influential genes can provide a more precise understanding of cancer's molecular characteristics, potentially guiding more effective treatment strategies.
Comparing dendrograms reveals the impact of focusing on influential genes. The all-genes dendrogram captures wider genetic variation with larger distances and dispersed clustering [37]. In contrast, the top 1000 genes dendrogram shows tighter clustering with smaller distances, suggesting these genes better indicate genetic relationships between cancer types. The CESC-CHOL cluster in the top 1000 genes dendrogram reveals shared genetic features not apparent when considering all genes, implying these genes more significantly define these cancers' molecular characteristics. The consistent COAD-LIHC clustering supports their genetic similarity, while LUSC and OV clustering differences highlight distinct aspects of their genetic profiles revealed by the top genes.
The identification of key genes such as C3orf36, JHY, and TASP1, and their significant mutation patterns across different cancers, provides valuable insights into the genetic landscape of these diseases [38]. Comprehensive pathway analysis provided molecular insights into different biological processes that define cancer type identities. The enrichment analysis further elucidated the biological pathways associated with the high-weight genes in the classification model, including Acute myeloid leukemia and TNF signaling, which are known to play crucial roles in cancer development and progression [39, 40]. The high statistical significance of these findings supports their relevance in understanding cancer biology.
A critical distinction between the Conv1D model and traditional machine learning approaches lies in biological interpretability rather than marginal performance gains. While Random Forest achieved comparable discriminatory power (mean AUC: 0.9901 versus Conv1D's 0.9916), functional enrichment analysis revealed fundamental differences: Conv1D identified 60% more significantly stable genes (3776 versus 2353) enriched for cancer-type-specific pathways—"Hepatitis B″ (q = 0.064) capturing viral etiology in hepatocellular carcinoma, ‘Neutrophil extracellular trap formation’ (q = 0.0006) and "JAK–STAT signaling" (q = 0.004) representing pan-cancer oncogenic drivers. In stark contrast, Random Forest's top pathways comprised neuronal processes mechanistically irrelevant to epithelial tumors: "Spinocerebellar ataxia" (q = 0.012) and "Dopaminergic synapse" (q = 0.065), likely reflecting batch artifacts rather than causal biology. This divergence stems from algorithmic design: Random Forest's greedy node-splitting prioritizes statistical variance maximization regardless of biological plausibility, whereas Conv1D's self-attention mechanism—optimized end-to-end via gradient descent—forces the model to learn multi-gene patterns with genuine cross-validation discriminatory power. Cross-validation with IntOGen Cancer Drivers confirmed Conv1D's superior biological coherence (3.6% driver gene overlap versus Random Forest's 3.4%). For clinical deployment, this interpretability advantage is essential. A model attributing predictions to tissue-specific oncogenic pathways (e.g. viral integration in LIHC, inflammation in STAD) provides actionable therapeutic hypotheses.
While our model showed remarkable performance, certain limitations must be acknowledged. Cholangiocarcinoma and other cancers exhibit a slight overlap in classification. These misclassifications indicate that the model can be further improved to enhance differentiation between closely related cancer types.
Regarding gene importance in our classification model, we emphasize the distinction between computational feature attribution and biological causality. When certain genes are reported to "improve" classification, this refers to their discriminative utility in the learned feature space rather than implying causal driver roles. The self-attention mechanism provides model interpretability by computing sample-specific weights that quantify each gene's contribution to predictions. For example, TP53 receives high attention weights because its mutation frequency varies systematically across cancer types—frequently mutated in ovarian and colorectal cancers but rarely in thyroid cancers—providing discriminative signals the model exploits. Statistical validation confirms that high-weight genes exhibit significant inter-group mutation burden differences (Kruskal-Wallis, P < .001) and enrich for cancer-relevant pathways. However, high attention weight indicates predictive utility but not necessarily driver status, as genes may be important due to co-mutation patterns or as proxies for broader mutational processes. This distinction between predictive utility and biological mechanism is fundamental to proper interpretation, positioning feature importance as hypothesis-generating rather than conclusive evidence of gene function.
A key consideration in interpreting our results is the distinction between mutation-based and expression-based approaches to cancer classification. While both modalities have demonstrated utility, they address different clinical scenarios and capture complementary biological information. Expression-based models excel when high-quality RNA-seq data are available and can leverage the rich information content of transcriptional profiles. However, clinical reality often presents constraints that favor mutation-based approaches. Panel capture sequencing is more widely implemented in routine clinical practice than RNA-seq, particularly for FFPE archival tissues where RNA degradation limits expression profiling. Moreover, mutation profiles represent stable genomic alterations that persist across disease progression and are less susceptible to technical variability from sample handling or batch effects. For cancer type classification—where the goal is to identify stable molecular identity rather than transient cellular states—mutation patterns may be particularly informative, as cancer type-specific driver mutations are diagnostically specific at the DNA level. Our study demonstrates that mutation count features, despite lower information density than expression data, can achieve robust classification performance (accuracy: 0.902, AUC: 0.990) using data routinely generated in clinical settings. This positions mutation-based classification as a valuable complementary approach that extends molecular diagnostics to scenarios where expression data are unavailable or impractical to obtain.
Additionally, the reliance on panel capture sequencing data, although more clinically applicable, may miss some nuances captured by whole-exome sequencing. Future studies should explore the integration of both sequencing methods to enhance the model's robustness.
Conclusion
In conclusion, our self-attention based Conv1D network offers a powerful tool for cancer classification, leveraging genomic data to improve diagnostic accuracy and treatment planning. The identification of key genes and significant mutations, coupled with pathway enrichment, provides a comprehensive framework for understanding cancer biology and advancing precision oncology. Further validation and refinement of this approach could significantly impact clinical practice, enhancing patient care and outcomes.
Key Points
- Developed a self-attention based Conv1D network for cancer classification using panel capture sequencing data with >90% overall accuracy
- Identified key discriminative genes including C3orf36, JHY, and TASP1 that show significant mutation pattern differences between cancer types
- Demonstrated robust performance across diverse cancer types, with high recall rates despite the molecular heterogeneity challenges of tumors
Supplementary Material
Supplementary_Table_bbag120
The reference list from the paper itself. Each links out to its DOI / PubMed record.
- 1Tsimberidou AM . Targeted therapy in cancer. Cancer Chemother Pharmacol 2015;76:1113–32. 10.1007/s 00280-015-2861-126391154 PMC 4998041 · doi ↗ · pubmed ↗
- 2Gubin MM, Zhang X, Schuster H et al. Checkpoint blockade cancer immunotherapy targets tumour-specific mutant antigens. Nature 2014;515:577–81. 10.1038/nature 1398825428507 PMC 4279952 · doi ↗ · pubmed ↗
- 3Albert FW, Kruglyak L. The role of regulatory variation in complex traits and disease. Nat Rev Genet 2015;16:197–212. 10.1038/nrg 389125707927 · doi ↗ · pubmed ↗
- 4Schaub MA, Boyle AP, Kundaje A et al. Linking disease associations with regulatory information in the human genome. Genome Res 2012;22:1748–59. 10.1101/gr.136127.11122955986 PMC 3431491 · doi ↗ · pubmed ↗
- 5Vogelstein B, Kinzler KW. Cancer genes and the pathways they control. Nat Med 2004;10:789–99. 10.1038/nm 108715286780 · doi ↗ · pubmed ↗
- 6Lawrence MS, Stojanov P, Polak P et al. Mutational heterogeneity in cancer and the search for new cancer-associated genes. Nature 2013;499:214–8. 10.1038/nature 1221323770567 PMC 3919509 · doi ↗ · pubmed ↗
- 7Hanahan D, Weinberg RA. Hallmarks of cancer: the next generation. Cell 2011;144:646–74. 10.1016/j.cell.2011.02.01321376230 · doi ↗ · pubmed ↗
- 8Chin L, Gray JW. Translating insights from the cancer genome into clinical practice. Nature 2008;452:553–63. 10.1038/nature 0691418385729 PMC 2730524 · doi ↗ · pubmed ↗