Air Pollution Monitoring with Nanoscaled Materials in Chemoresistive Gas Sensors
Reinaldo S. Theodoro, Gustavo S. M. Santos, Matteo D’Andria, Henrique S. Gropelo, Sebastian Kravecz, Andreas T. Güntner, Diogo P. Volanti

TL;DR
This paper reviews recent advances in using nanoscaled materials for chemoresistive gas sensors to monitor air pollutants and their integration into environmental monitoring devices.
Contribution
The paper provides a critical review of recent progress in nanostructured chemoresistive gas sensors for air pollution monitoring.
Findings
Nanostructured and porous materials improve gas sensor performance for detecting pollutants.
Engineering strategies like surface functionalization enhance pollutant adsorption and sensor signals.
Integration into consumer electronics and wearables is a promising direction for real-world applications.
Abstract
Air pollution is a pressing global concern due to its negative effects on human health and our ecosystem. For instance, pollutants, including particulate matter, volatile organic compounds, nitrogen- and sulfur-based gases, and ozone, are known to increase the incidence rates of respiratory, cardiovascular, and various cancer types, among others. Comprehensive monitoring of key gaseous pollutants is, therefore, critical to enforce adherence to regulatory limits or to control personal exposure. In this review, we analyze the progress on nanostructured and porous chemoresistive gas sensors over the last five years and critically compare their performance to air pollution guidelines. We start with a discussion of the major outdoor and indoor pollutants, describing their main sources and the associated health effects arising from short- and long-term exposures to concentrations exceeding…
Genes, proteins, chemicals, diseases, species, mutations and cell lines named across the full text — each resolved to its canonical identifier and authoritative record.
Click any figure to enlarge with its caption.
 1
1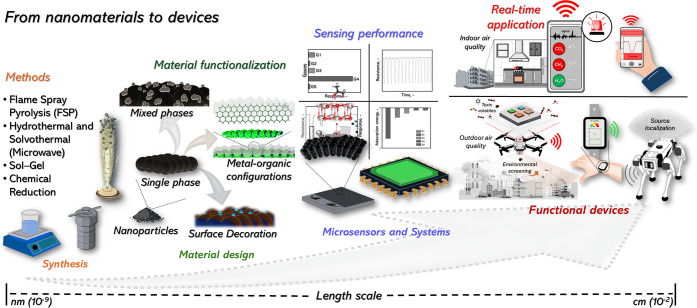 2
2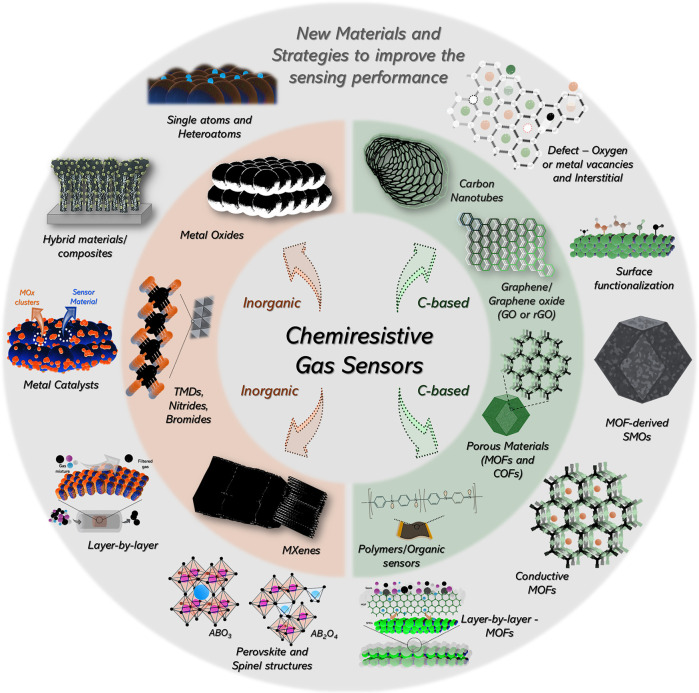 3
3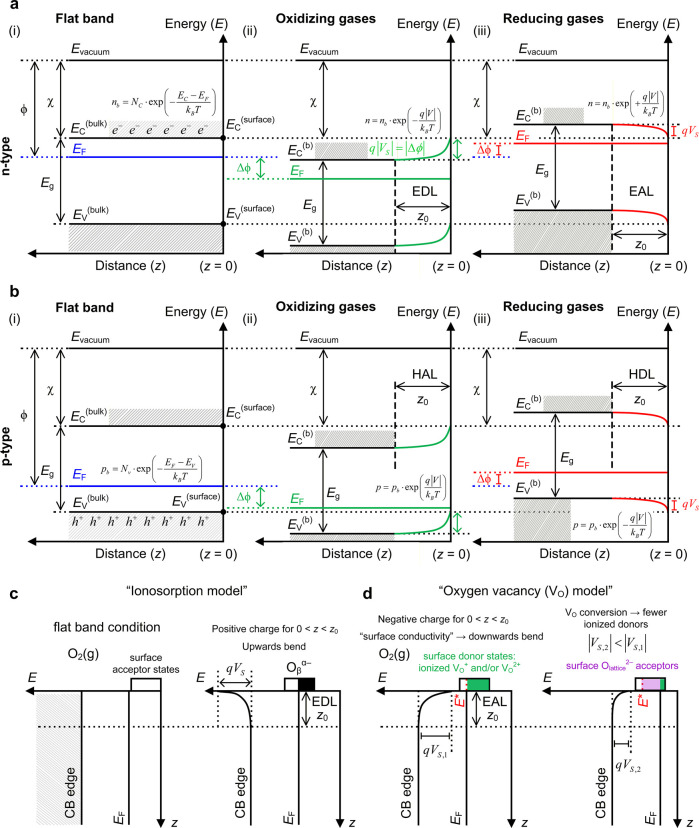 4
4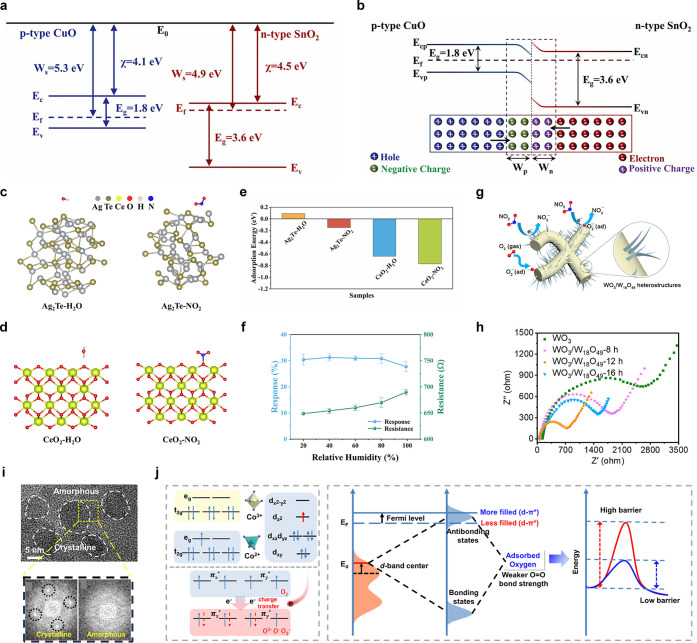 5
5 6
6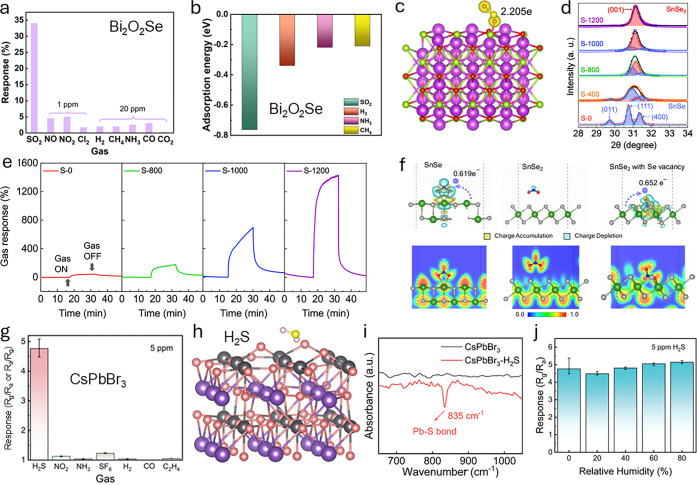 7
7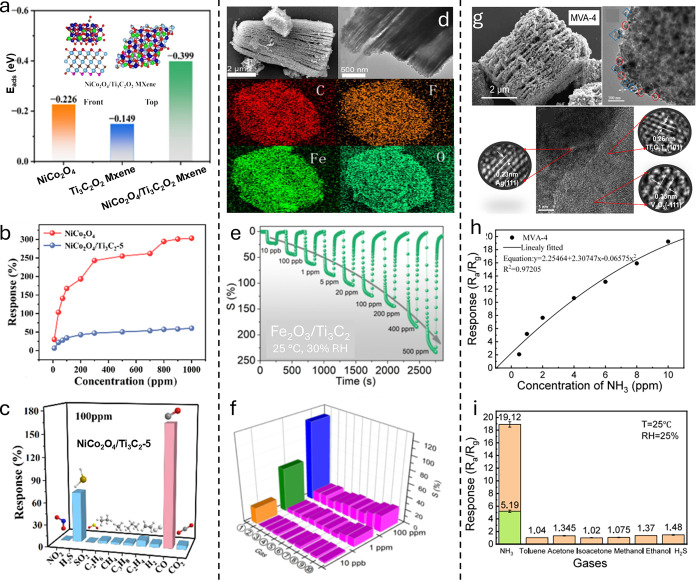 8
8 9
9 10
10 11
11 12
12 13
13| Exposure
guidelines | ||||
|---|---|---|---|---|
| Classes of gaseous pollutants | U.S.A. and Canada | European Union | China | |
| Alcohols | Methanol | 0.5 mg/kg/d or 10.0 mg/m3 (RfD
based on increased
liver enzymes and decreased brain weight in rats). The odor perception
threshold is 2.0 ppm (2.62 mg/m3) (EPA). | 260 mg/m3 (200 ppm) long-term
exposure (ECHA/OELs). | 50 mg/m3 short-term exposure and 25 mg/m3 -
8 h (MEE, NHC). |
| Ethanol | 1900.0 mg/m3 (1000 ppm) long-term
exposure (10 h)
(NIOSH, OSHA, CDC). | 1907 mg/m3 (1000 ppm) (EU-IOEL). | – | |
| Ketones | Acetone | 594.0 mg/m3 (250 ppm) long-term exposure (10 h)
(ACGIH). | 1210.0 mg/m3 (500 ppm)8 h (ECHA). | 450 mg/m3 short-term exposure and 300 mg/m38 h (MEE, NHC). |
| Aldehydes | Formaldehyde | 0.12 mg/m3 (0.1
ppm) long-term exposure
and 0.004 mg/m3 (0.003 ppm) based on respiratory effects
(ACGIH). | 0.37 mg/m3 limit value. (IFA, AGW). | 0.5 mg/m3 maximum allowable concentration (MAC). |
| ≤0.08 mg/m3 average hour indoor (MEE, NHC). | ||||
| Acetaldehyde | 45 mg/m3 (25 ppm) recommended limit. | 25 ppm short-term exposure. | 0.3 mg/m3 maximum allowable concentration
(MAC) (MEE). | |
| The odor perception threshold is 0.05 ppm (0.09 mg/m3)
(EPA, ACGIH). | 91 mg/m3 (50 ppm) (MAK, WHO) | |||
| Acrolein | Recommended limit 0.1 ppm. | 0.05 mg/m3 (0.02 ppm) long-term exposure
and 0.12 mg/m3 (0.05 ppm) short-term exposure (ECHA/OELs). | 0.3 mg/m3 maximum allowable concentration
(MAC) (MEE). | |
| 0.003 ppm (0.007 mg/m3, MRL - based on respiratory effects in humans). 0.0005 mg/Kg/d, (RfD - based on reduced survival after oral exposures in an animal study). | ||||
| The odor perception threshold is 0.25 ppm (0.60 mg/m3)
(NIOSH, EPA, OSHA). | ||||
| Aromatic hydrocarbons | Benzene | 0.02 ppm long-term exposure (ACGIH). | 0.66 mg/m3 (0.2 ppm) limit value (ECHA). | 10 mg/m3 short-term exposure and 6
mg/m3 - 8 h. ≤0.03 mg/m3 average hour
indoor (NHC, MEE). |
| 0.03 mg/m3RfC and 0.004 mg/Kg/dRfD
based on hematologic effects in humans. The odor perception threshold
is 1.5 ppm (5.0 mg/m3) (EPA). | Acceptable concentration: 0.2 mg/m3. Tolerable
concentration:
1.9 mg/m3 (IFA, TRGS 910). | |||
| 5 μg/m3 - 1 year (EC). | ||||
| Toluene | 20 ppm long-term exposure recommended limit (ACGIH). | 192 mg/m3 (50 ppm) - Long-term exposure
and 384 mg/m3 (100 ppm) - Short-term exposure (through
skin absorption) (ECHA/OELs). | 100 mg/m3 short-term exposure and 50
mg/m3 - 8 h. ≤0.20 mg/m3 average hour
indoor (NHC, MEE). | |
| 5.0
mg/m3 (RfC - based on neurological effects in
humans). 0.08 mg/Kg/d (RfD - based on increased kidney weight in rats).
The odor perception threshold is 2.9 ppm (EPA). | ||||
| Xylenes | Recommended
limit 100 ppm (ACGIH). | o,p,m-Xylene: 221 mg/m3 (50 ppm) - 8 h and 442 mg/m3 (100 ppm) - Short-term exposure (through skin absorption)
(IOELVs). | 100 mg/m3 short-term exposure and 50 mg/m3 - 8 h. ≤0.20
mg/m3 average hour indoor (NHC, MEE). | |
| Styrene | 10 ppm
long-term exposure recommended (ACGIH). | 20 ppm (8 h) long-term inhalation exposure
and
68 ppm short-term inhalation exposure. The odor perception threshold
is 0.1 ppm (0.43 mg/m3) (Plastics Europe, 2024). | 100 mg/m3 short-term exposure and 50
mg/m3 - 8 h (NHC, MEE). | |
| 1.0 mg/m3 (DfC -based on CNS effects
in occupationally
exposed workers). The odor perception threshold is 0.32 ppm (EPA). | ||||
| Ethylbenzene | 1.0 mg/m3 (DfC - based on the development in rats
and rabbits); 0.1 mg/Kg/d (DfR - based on hepatic and renal toxicity
in rats); The odor perception threshold is 2.3 ppm (EPA). | 442 mg/m3 (100 ppm)
- 8 h and 844 mg/m3 (200 ppm) short-term exposure (through
skin absorption) (HSE). | 150 mg/m3 short-term exposure and 100 mg/m3 - 8 h (NHC, MEE). | |
| Sulfur compounds | H2S | 7 mg/m3 (5 ppm) short-term exposure limit and 1.4
mg/m3 (1 ppm) long-term exposure (OSHA, ACGIH). | 7.0 mg/m3 (5 ppm)
long-term exposure and 14.0 mg/m3 (10 ppm) short-term exposure
(ECHA/OELs). | 10 mg/m3 maximum allowable concentration (MAC) (NHC,
MEE). |
| Organochlorines | Chloroform | 0.2 mg/m3 or 0.05 ppm for intermediate inhalation
(ATSDR - based on worker exposures resulting in liver effects in humans);
0.1 mg/m3 or 0.02 ppm for chronic inhalation (MRL - based
on liver effects in humans). The odor perception threshold is 85.0
ppm (EPA). | 10.0 mg/m3 (2 ppm) long-term exposure (8 h) (through
skin absorption) (ECHA, IOELVs). | 20 mg/m3 - 8 h (NHC, MEE). |
| Carbon tetrachloride | 31 mg/m3 (ppm) long-term exposure (ACGIH). | 6.4 mg/m3 (1 ppm) long-term exposure
and 32.0 mg/m3 (5 ppm) short-term exposure (through skin
absorption) (ECHA/OELs). | 25 mg/m3 short-term exposure and 15
mg/m3 - 8 h. (NHC, MEE). | |
| 1.3 mg/m3 or 0.2 ppm (ATSDR - based on
liver effects
in rats, inhalation acute); The odor perception threshold is 10.0
ppm (EPA). | ||||
| Other gases | CH4 | EEL of 5000 ppm (24 h) and CEL for 5000 ppm (90 days) (NIH). | No single occupational exposure limit. | No single occupational exposure limit (Standard GBZ 2.1–2019). |
| CO | 4
mg/m3 (24 h) exposure limits. Recommended limit
35 ppm (NIOSH, WHO, IARC, ACGIH). | 23 mg/m3 (20 ppm)
long-term exposure and 117.0 mg/m3 (100 ppm) short-term
exposure (through skin) (ECHA, IFA,
AGW). 0.5 μg/m3 - 8 h (EC). | 10 mg/m3 - 1 h or 4 mg/m3 - 24 h (NHC,
MEE). | |
| CO2 | 9000.0 mg/m3 (5000.0 ppm) (NIOSH). | 9000.0 mg/m3 (5000.0 ppm) long-term
exposure (ECHA). | 18,000
mg/m3 short-term exposure and 9000 mg/m3 - 8
h. ≤0.10 mg/m3 average hour indoor
(NHC, MEE). | |
| NO2 | 25 μg/m3 (24 h) and 10 μg/m3 annually. 0.38 mg/m3 (0.2 ppm) - 8 h long-term
exposure (WHO, IARC ACGIH). | 0.96 mg/m3 (0.5 ppm) long-term exposure
and 1.91
mg/m3 (1.0 ppm) short-term exposure (ECHA). | 10 mg/m3 short-term exposure and 5
mg/m3 - 8 h. 80 μg/m3 annual or 200 μg/m3 (24 h) (NHC, MEE). | |
| 200 μg/m3 - 1 h or 40 μg/m3 - 1 year (EC). | ||||
| NH3 | 18.0 mg/m3 (25 ppm) long-term
limit (10 h) (OSHA). | 14.0
mg/m3 (20 ppm) - 8 h or 36 mg/m3 (50 ppm) short-term
exposure (IOELVs). | 30
mg/m3 short-term exposure and 20 mg/m3 - 8 h.
≤0.20 mg/m3 average hour indoor (NHC, MEE). | |
| O3 | 0.1 ppm. 100
μg/m3 (8 h) exposure limit (ACGIH). | Daily maximum of 120 μg/m3 - 8 h (EC). | 200 μg/m3 - 1 h or 160 μg/m3 - 8 h (MEE). | |
| SO2 | 40 μg/m3 (2.0 ppm) - 24 h (ACGIH). | 350 μg/m3 -
1 h or 125 μg/m3 - 24 h (EC). | 10 mg/m3 short-term exposure and
5 mg/m3 - 8 h. 150 μg/m3 annual or 500
μg/m3 (24 h) (MEE). | |
| Toxic gas | Sensing material/morphology | Material synthesis/ Film deposition technique | Sensor response | Conc. (ppm) |
| Selectivity | LLOD |
| ref |
|---|---|---|---|---|---|---|---|---|---|
| CO | Pd–CuO Nanorods/SnSe2 Nanoflower | Hydrothermal/Spray |
| 200 | rt | CH4 (−), H2S (−), Acetone (−), SO2 (−) | – | 13 s/58 s |
|
| Hollow spherical-NiO/MXene | Hydrothermal-etching/Layer-by-layer coating |
| 400 | rt/20 | H2 (−), CH4 (−), SO2 (−), CO2 (−) | – | 8 s/16 s |
| |
| Nanoparticles NiCo2O4/Ti3C2O2 MXene nanosheets | Hydrothermal-etching/Paste |
| 100 | 110 | NO2 (−), H2S, SO2 (−), C2H6 (−), CH4 (−), C3H8 (−), C2H4 (−), H2 (−), CO2 (−) | 10 ppm | 39 s/234 s |
| |
| Boron subphosphide (B12P2)/- | Calcination in argon-Precipitation/Drop cast |
| 50 | 500 | Benzene, NH3 (−), SO2 (−), NO2 (−), NO (−) | – | –/– |
| |
| 1D Cu2DADHA-F2 MOF/nanosheets | Solvothermal/Liquid–liquid interface assembly |
| 40 | rt/10 | NO2 (4.7), CO2 (395.6), H2 (204.2), CH4 (6330), dimethyl carbonate (6330), diethyl carbonate (6330), ethyl methyl carbonate (6330) | [t]235 ppb | 230 s/260 s |
| |
| Sn-Co-based MOF - Co3O4-SnO2/nanoparticle | Precipitation-Annealed/Spin-coating deposition |
| 100 | 325/20 | H2 (10.6), H2S (>10.6), NH3 (>10.6), CH4 (>10.6) | – | 3 s/18 s |
| |
| Ga-Co3O4/nanosheets | Precipitation-ultrasonication-calcination/– |
| 100 | 210 | H2 (2.3), CH4 (3.9), NO2 (16.9), C3H8 (4.9), NH3 (10.1) | 1 ppm | 15 s/28 s |
| |
| CuO-SnO2/nanotubes | Layer-by-layer assembly on the carbon nanotubes (CNTs) templates, calcination/Drop cast |
| 300 | rt/50 | H2 (−), NH3 (−), NO2 (−), H2S (−) | [t]159 ppb | 56 s/23 s |
| |
| Pd-doped SnO2 nanoparticles | Flame spray pyrolysis/- |
| 1 | 350/50 | Acetone (−), ethanol (−) | [t]0.5 ppb | –/– |
| |
| CO2 | 5 wt % rGO/CuO–MOF/sheets-nanoparticles | Solvothermal-thermal decomposition/- |
| 500 | rt/40 | CO (−), NH3 (−), H2S (−), NO2 (−), CH4 (−), Ethanol (−), N2 (−) | [t]2 ppm | 37 s/26 s (300 ppm) |
|
| Li-Mg-MOF-74/Film | Solvothermal/Drop coating | ∼ 90 Hz | 500 | rt/0 | Acetone (>4.5), Methanol (>4.5), Ethanol (>4.5), NH3 (>4.5), CH4 (>4.5), NO2 (>4.5), H2 (>4.5), | 300 ppm | 84 s/69 s |
| |
| Urchin-like TiO2- 5 wt % 2D MXene/microsphere | Etching and delamination-Solvothermal-thermal decomposition (N2)/Drop casting |
| 500 | 30/50 | NH3 (5.5), Ethanol (10.6), NO2 (3.9), CH4 (9.3) | [t]10 ppm | 82 s/92 s |
| |
| MOF-808-Pebax/octahedral shape-membrane | Hydrothermal-sonication/Drop coating | 371.8 Hz | 1000 | rt/– | CH4 (−), NH3 (−), HCHO (−), Ethanol (−), Acetone (−) | 300 ppm | 41 s/20 s (5000 ppm) |
| |
| LaCoO3-MXene-15 wt %/microsphere-shaped-layers | Hydrothermal-etching/– |
| 800 | 60/11 | H2 (6.7), SO2 (9.3), C2H4 (12.7), CO (13.8), C2H6 (35.4), CH4 (38.1) | 50 ppm | 14 s/32 s |
| |
| MWCNTs decorated ZnO/nanograins | RF magnetron/e-beam deposition |
| 5000 | 150/– | H2Ov (1.9), CH4 (2.5), NH3 (2.5), Propane (2.3), Toluene (2.1), dimethylformamide (2.3) | 100 ppm | 670 s/450 s |
| |
| SO2 | Ag-PANI-SnO2/nanoparticles | Solvothermal-in situ polymerization-self-assembly method/Paste coating |
| 50 | 20/0 | CH4 (−), HCHO (−), Acetone (−), Methanol (−), NH3 (−) | <0.5 ppm | 110 s/100 s |
|
| 1.0 wt % Cu-rGO-In2O3/nanosphere-sheet-nanorices | Microwave-assisted hydrothermal + impregnation/Spin coating |
| 5 | 200/0 | NO2 (−), NO (−), CO (−), H2S (−), Ethanol (−), C2H4 (−), H2 (−), NH3 (−) | <0.5 ppm | 57 s/8.5 s |
| |
| Bi2O2Se/nanosheets | Hydrothermal/Drop cast |
| 1 | rt/11 | NO (>6.8), NO2 (6.8), Cl2 (>6.8), H2 (>6.8), CH4 (>6.8), NH3 (>6.8), CO (>6.8), CO2 (>6.8) | 20 ppb | 100 s/292.6 s |
| |
| BBTBSe/coral-reef-like | Solvothermal/Drop cast |
| 100 | rt/57 | H2S (10.7), NO2 (7.6), CO (7.97), CO2 (5.3), NH3 (9.49) | [t]0.23 ppb | 60 s/70 s |
| |
| Fe2O3-decorated MoS2/nanoparticles-nanoflakes | –/Radio frequency (RF) magnetron sputtering-shadow mask deposition |
| 1 | 150/20 | CH4 (1.63), CO (1.54), NH3 (1.49), NO2 (1.33) | [t]22.8 ppb | 152 s/114 s |
| |
| Microporous COF -NKCOF-12/Film | Melt polymerization/Direct fabrication | 0.18–0.20 | 1000 | rt/12 | Ethanol (10), Acetone (>10), MeOH (>10), NH3 (>10), C2H2 (>10), CH4 (>10), CO2 (>10), O2 (>10), N2 (>10) | [t]86 ppb | 3.47 min/4.03 min |
| |
| NO2 | Ag2Te/CeO2/nanocubes-hollow roll structure | Hydrothermal/– |
| 1 | 65/20 | NO (4.5), NH3 (14.87), SO2 (21.15), CO (−), CO2 (−), H2 (−), ethanol (−), methanol (−), acetone (−), Methylbenzene (−), benzene (−) | 5 ppb | 69 s/415 s |
|
| 0.1% Sb-doped SnO2/nanoparticles | Hydrothermal/Spin coating |
| 1 | 75/2 | NH3 (−), H2S (−), CO (−) | 20 ppb | 153 s/11 s |
| |
| gold-black NPs-Ga2O3/nanorods | Hydrothermal/RF sputtering |
| 10 | 230/30 | 100 ppm - Ethanol (12), NH3 (10) | 0.1 ppm | 27.3 s/69.2 s |
| |
| WO3/W18O49/branched | Solvothermal/in situ growth |
| 10 | 50/30 | Cl2 (−), CH4 (−), SO2 (−), C2H4 (−), H2S (−), NH3 (−), CO (−), CO2 (−) | 10 ppb | 50 s/38 s |
| |
| 0.5 wt % HGO/In2O3/sheet | Hydrothermal/– |
| 1 | 62.5/20 | CO (−), NH3 (−), Ethanol (−), Acetone (−), Formaldehyde (−), H2S (−) | [t] < 1 ppb | <10 min/<10 min |
| |
| SnSe | Hydrothermal/Spin-coating |
| 5 | rt/50 | NO2 (−), H2S (−), SO2 (−), NH3 (−), Acetone (−), H2 (−) | [t]∼105 ppt | 78 s/178 s |
| |
| Nb-MoS2/nanoflakes | Two-zone LP-CVD (Low-Pressure Chemical Vapor Deposition) |
| 0.5 | rt/80 | NO2 (−), NO (−), NH3 (−), CH4 (−), CO (−), CO2 (−), SO2 (−) | [t]0.117 ppb | 105.5 s/162.3 s |
| |
| SHI-modified MoS2-film | Radio frequency (RF) magnetron sputtering |
| 50 | 100/30 | NH3 (3), H2S (8), H2 (10), CO2 (6) | – | 59 s/152 s |
| |
| porous SnO2/nanopods | Sn-MOF–Precipitation + calcination/– |
| 1 | 250/90 | CO (−), H2S (−), Ethanol (−), NH3 (−), H2 (−), CH4 (−) | <10 ppb | 15 s/20 s |
| |
| rGO-5% ZnO/- | Pechini Method/Drop cast |
| 2.5 | rt/50 | CO (−), H2 (−), NH3 (−), Toluene (−), Benzene (−), Ethanol (−) | [t]2 ppb | 12 min/– |
| |
| Cs2AgBiBr6/SnO2/ZnO film/nanorods | Spin coating- Hydrothermal-Vacuum evaporation |
| 1 | rt/60 | CH4 (≫11), CO (≫11), H2 (>11), Ethanol (>11), Acetone (>11), NH3 (11), H2S (>11), SO2 (>11), NO (>11) | – | 12 s/9 s |
| |
| TeNT/TeO2/nanotubes | Hydrothermal-Thermal oxidation |
| 0.6 | rt/10 | NH3 (−), Acetone (−), Ethanol (−), Methanol (−), HCHO (−), Toluene (−) | – | 39 s/49 s |
| |
| C-MoS2/nanosheets | Hydrothermal/Drop cast |
| 10 | rt/– | CO2 (−), H2 (−), H2S (−) | [t]0.13 ppm | 43.1 s/301.2 s |
| |
| Black TiO2/burr-like nanorods | Liquid precipitation/Drop coating |
| 3 | rt/30–90 | H2 (−), Acetone (−), NH3 (−), Isopropanol (−), Ethanol (−), HCHO (−), CO2 (−) | 50 ppb | 38 s/– |
| |
| Cu3N/nanoparticles | Flame-spray pyrolysis + dry nitridation/– |
| 1 | 75/50 | Xylene (737), Toluene (>103), Benzene (>104), H2 (421), Acetone (>103), Ethanol (>103), NO (3.6), NH3 (73.5), H2S (>103) | [t]0.1 ppb | 11 min/99 min |
| |
| Porous WS2 Films | Flame spray pyrolysis + dry sulfidation/– |
| 1 | rt/50 | NH3 (164), NO (217), Acetone (361), H2S (>103), CO (>103), N2O (>103), Benzene (>103), Toluene (>103), Methanol (>103), Ethanol (>103) | 1 ppb | 60 s/32 min |
| |
| Porous WO3 Films | Flame spray pyrolysis/ flame-deposited directly |
| 0.1 | 125/50 | H2 (>104), NH3 (>105), CH4 (>104), Methanol (>105), Ethanol (>105), Acetone (>104), CO (>105), H2S (835), Formaldehyde (>103) | 3 ppb | 7.8 min/43.8 min |
| |
| Carbon nanotube-based | E-beam metal evaporation and in situ chemical vapor deposition | 5.6 μW | 1 | 23/45 | – | 9 ppb | 5 min/1 min |
| |
| MoS2/RGO-4 heterostructure | Infiltration/– |
| 1 | 100/50–60 | NH3 (−), CO (−), H2S (−), Ethylene (−), Formaldehyde (−) | [t]0.2 ppb | 195 s/279 s |
| |
| Au@ZnO/rGO-2 nanospheres | Solvothermal/– |
| 1 | 60/30 | Ethanol (11), Acetone (30), NH3 (16), Methanol (30), SO2 (16), CO2 (16) | [t]0.138 ppb | 248 s/170 s |
| |
| rGO/GO Interfaces | Laser microfabrication reduction/– |
| 100 | rt/dry | H2S (−), NH3 (−), Acetone (−), Ethanol (−) | [t]230 ppb | –/– |
| |
| NO | Cu-hemin MOF/rGO | One-pot construction: solvothermal/Drop-drying method |
| 1 | rt/0–75 | NH3 (3.2), Acetone (3.3), Ethanol (3.1), Methanol (3.0), Benzene (−), Toluene (−), Ethylbenzene (−), Xylene (−) | 0.05 ppm | 43 s/367 s |
|
| Hollow multishelled structured-WO3 | Emulsion polymerization, hydrothermal calcination/- | 1.7 | 0.05 | rt/– | NH3 (11.3), SO2 (17), CO (24.3), H2S (−) | [t]2.52 ppb | –/– |
| |
| Ni0.48Co0.52MOF-74/7%-CNT-polyacrylonitrile (PAN)/nanoflowers | Hydrothermal/in situ growth-physical deposition |
| 50 | rt/40 | H2S (−), NH3 (−), Acetone (−), Ethanol (−), Methanol (−), C2H4 (−), Hexanal (−), CO2 (−) | [t]18.6 ppb | 39 s/70 s |
| |
| 2 mol% Ta-WO3/nanoparticles | Solvothermal-calcination/packaging |
| 0.05 | 175/– | NH3 (−), H2S (−), Isoprene (−), Ethanol (−), Acetone (−), CO2 (−), CO (−), H2 (−), Acetonitrile (−), Acetaldehyde (−), NO2 (−), O2 (−) | 5 ppb | 30 s/10 s |
| |
| WO3 Thin film/nanorods | Hydrothermal/- |
| 10 | 50/– | H2 (−), NO2 (−), CO (−) | – | 56 s/79 s |
| |
| N2O | CuO-TiO2/nanorods | GLAD method-thermal annealing/- |
| 1 | rt/0 | CH4 (>5.3), NH3 (>5.3), CO (>5.3), NO2 (−), H2 (5.3), Ethanol (1.9), Acetone (2.0), Toluene (>2.0) | 50 ppb | 36 s/50 s |
|
| BaMoO4/nanoparticles | Coprecipitation method-calcination/Double-layer YSZ electrolyte (porous layer/dense layer)-coated | 25.30 mV | 2 | 375/0–11 | CH4 (11.1), CO2 (9.2), H2 (8.9), NH3 (6.2), NO (4.5), NO2 (5.0) | 200 ppb | 98 s/552 s |
| |
| TCN(II)-KOH-rGO/CF/2D rod-like amorphous crystals | Hydrothermal/Drop coating | –36.5 μA cm2 | 10 | rt | SOX (3.2), CO2 (>3.2), Acetone (>3.2), Benzene (>3.2), Tetrahydrofuran (>3.2) | 1 ppm | –/– |
| |
| NH3 | BA/MXene/PANI-HCl aerogel/fiber | Wet spinning and etching techniques/Coated |
| 100 | 20/45 | Ethanol (−), Methanol (−), Acetone (−), Methanal (−), Toluene (−) | 1 ppb | 24.1 s/2.2 s |
|
| Gr/TAPPPANI (GT-2-P)/nanorod-like and lamellar structures and nanoparticles | Polymerization/Drop cast deposition |
| 100 | rt/25 | O2 (25.4), CO2 (186.3), H2 (3.8), Ar (57.0), N2 (1017.7) | [t]1.99 ppm | 108 s/1310 s |
| |
| Co-doped ZnFe2O4-rGO/nanosheets and nanorods | Spray pyrolysis/Spin-coating |
| 1 | rt/– | Acetone (−), Ethanol (−), isopropanol (−), benzene (−), formaldehyde (−), xylene (−), acetaldehyde (−) | [t]0.004 ppb | 65 s/18 s |
| |
| Ti3C2T | Hydrothermal and chemical reduction method/Spin coating |
| 10 | rt/25 | Toluene (18.4), Acetone (14.2), Isoacetone (18.7), Methanol (17.8), Ethanol (14), H2S (12.9) | 0.5 ppm | 8 s/289 s |
| |
| Bimetallic-Pt2Ru3@SnO2/nanoparticles-nanosol | Hydrothermal-photochemical reduction/Spin coating | 8.2 | 2 | 195/80 | Acetone (−), H2S (−), CO (−), Ethanol (−), H2 (−), SO2 (−) | [t]5.4 ppb | 15 s/532 s |
| |
| PANI/PAN fabric sensor/nanofibers | Electrospinning and preoxidation/Growth |
| 50 | rt/30–40 | Ethanol (>30.6), Acetone (>30.6), HCHO (30.6), Methanol (>30.6), IPA (>30.6) | 2 ppm | 100 s/851 s |
| |
| 5CC-COOH-Ti3C2T | minimally intensive layer delamination (MILD) and molecular self-assembly methods/dip-coated |
| 80 | rt/23 | – | [t]539 ppb | 122.42 s/– |
| |
| P-BNT/needle-shaped | -/coated |
| 40 | rt/0 | TEA (5694), Ethanol (6882), H2S (7240), Toluene (8355), SO2 (8579), NO2 (13559), Acetone (15385), Avantin (15534), Methanol (18605) | – | 40 s/– |
| |
| BN-H/P-BNT/fibrous and needle-shaped | -/coated |
| 40 | rt/0 | TEA (138.1), Ethanol (178.2), H2S (101.3), Toluene (388.1), SO2 (128.0), NO2 (293.1), Acetone (635.4), Avantin (432.5), Methanol (565.4) | [t]13 ppb | 65 s/25 s |
| |
| SnO2 QDs-SnS2/nanosheets and quantum dots | Solvothermal/Spin-coating |
| 100 | rt/35 | NO2 (11.1), CH4 (11.1), H2 (11.1), Acetone (7.9), Ethanol (6.5) | [t]143 ppb | 5 s/876 s |
| |
| Fe2Mo3O8-MoO2@MoS2-900 °C/disks-polyhedral Structures | Hydrothermal-Annealed/Dripped |
| 1 | rt/5 | H2S (9.4), NO2 (9.5), Methanol (10.3), CO2 (10.3), Ethanol (10.8), Acetone (12), Acetaldehyde (15.1), allicin (39.8) and n-hexane (125) | [t]3.7 ppb | 3 min/60 min |
| |
| Porous CuBr films | Flame spray pyrolysis + dry bromination/– |
| 5 | rt/90 | Isoprene (>30), Ethanol (>38), CH4 (>48), Acetone (>56), H2 (>57), Acetic acid (>58), Methanol (>65), Formaldehyde (>184), CO (>260) | [t]0.210 ppb | 2.2 min/50 s (1 ppm) |
| |
| O3 | Cs2AgBiBr6 perovskite/microsheets | Precipitation/- |
| 2.3 | rt/70 | NO (−), H2 (−), CO2 (−), CH4 (−) | – | 30 s/<120 s |
|
| 3 wt % Ag-SnO2 by MOF/spherical structure | Sol–gel/NASICON- sintered | 232.36 | 0.420 | rt/22 | N2 (−), CO2 (−), Ethanol (−), Methanol (−) | 180 ppb | –/– |
| |
| Hexagonal-orthorhombic h/o-WO3/nanosheets-flake-like structure | Solvothermal-annealed/Paste- hook-and-loop applicator |
| 3 | 120/- | NH3 (−), Acetone (−), Ethanol (−), Methanol (−) | 40 ppb | 35 s/29 s |
| |
| IGZO@Mn3O4/nanoparticles | Radiofrequency magnetron sputtering-SILAR methods |
| 5 | rt/73 | NH3 (−), H2 (−), CO (−), NO (−), NO2 (−) | 0.1 ppm | 78 s/184 s |
| |
| CuSCN/polygon-like | Commercial powder/Drop casting technique |
| 0.015 | 25/0 | – | 15 ppb | 137.4 s/111 s |
| |
| Spinel CuCo2O4/nanosheets | Solution combustion method/Pasting |
| 1 | 90/70 | NO2 (8.4), NH3 (>8.4), SO2 (>8.4), Acetone (>8.4), Ethanol (>8.4), Methanol (>8.4) | [t]8.8 ppb | –/– |
| |
| ZnO/rGO-ZnO/quasi-spheres | Polymerization reaction-Heat treatment/Drop casting |
| 0.135 | 250/– | NO2 (>27) | 135 ppb | 10 min/15 min |
| |
| porous CuO/loosely stacked porous structures-nanoparticles | Simple solution combustion method/Drop casting |
| 0.050 | 70/70 | H2S (>4.5), SO2 (>4.5), NO2 (4.5), NH3 (>4.5), Ethanol (>4.5), Methanol (>4.5), Acetone (>4.5) | 10 ppb | <100 s/<30 min |
| |
| CH4 | Cd–In2O3/porous hollow nanospheres | Impregnation–calcination approach with self-made carbon nanospheres as a hard template-hydrothermal/Slurry-brush |
| 500 | 200/– | CO (5.69), HCHO (∼6), Ethanol (∼3.5), Methanol (∼5), Acetone (∼4.5), NH3 (∼4.5), Toluene (∼6) | 30 ppm | 30 s/82 s |
|
| Al-doped ZnO/nanorods | Precipitation/Slurry-brush |
| 500 | 280/0 | CO (−), NH3 (−), NO2 (−), Ethanol (−), Acetone (−), Toluene (−) | 100 ppm | 3.8 s/5 s |
| |
| N-3DrGO-CuO@Co3O4/core–shell from MOF | Solvothermal/Drop casting |
| 100 | rt/35 | CO2 (2.5), H2 (2.4), NO2 (5.1), Ethanol (4.4), Acetone (3.5) | 39.5 ppm | 16 s/11 s |
| |
| 5.0% Pt-SnO2 45 min/nanospheres | Photochemical deposition-Solvothermal/Drop-coating |
| 5000 | 400/20 | H2 (4.9), Ethanol (>4.9), NH3 (>4.9), Toluene (>4.9), Methanol (>4.9) | [t]1.18 ppm | 1 s/– |
| |
| Pd-PdO-CeO2/Hollow nanospheres-nanodots | Bubble confinement and in situ photochemical deposition/drop-coated |
| 500 | 250/74 | H2 (−), CO (−), NH3 (−), NO2 (−), H2S (−) | [t]0.1 ppm | 3 s/12 s |
| |
| Pd2Pt@m-SnO2/Mesoporous-nanoalloys | Solvent evaporation-induced coassembly method/- |
| 1000 | 400/– | H2 (6.9), CO (7.3), NH3 (7.0) | [t]0.175 ppm | 3 s/37 s |
| |
| SnO2-Zn2SnO4/nanosheets | Hydrothermal/Paste |
| 500 | 480/11 | SO2 (−), H2 (−), NO2 (−), and CO (−) | 5 ppm | 1 s/9 s |
| |
| V2O5-NiO/Nanorods | – |
| 4000 | 200/30 | Ethane (−), H2 (−), SO2 (−), CO (−) | 50 ppm | 72 s/113 s |
| |
| VO2-MoTe2/Layered and the silver ear-like special structures | Hydrothermal/drop coating |
| 500 | rt/11 | NH3 (−), Benzene (−), Methanol (−), Ethanol (−), Ethane (−), propane (−), H2 (−) | 500 ppm | 75 s/110 s |
| |
| In2O3/Belts-like | Electrospinning/- |
| 90 | 100/0 | CO (−), Ethene (−), NH3 (−), CO2 (−), SO2 (−) | [t]0.69 ppm | 36 s/44 s |
| |
| ZnO/spheres | Hydrothermal/Paste |
| 5000 | rt/30 | CO (−), H2S (−), NH3 (−), Methanol (−) | – | 6 s/134 s |
| |
| Pt-SnO2-ZnO/double layer structure | Hydrothermal/- |
| 800 | rt/35 | H2 (2.5), CO (>2.5), NO2 (>2.5) | [t]12.92 ppm | 147 s/132 s |
| |
| AuAg-ZnO/microspheres | Hydrothermal/- |
| 5000 | rt/38 | H2 (43.8), CO (50.5), H2S (44.7), NH3 (40.9), Methanol (12.4) | – | 5 s/105 s |
| |
| Acetone | SnO2-MoS2/Nanoparticles | Hydrothermal/Drop casting |
| 0.1 | rt/90 | Ethanol (6.6), Methanol (6.6), Toluene (4.4), Benzene (4.4), HCHO (2.2), NH3 (1.7) | 26 ppb | –/– |
|
| La0.8Ca0.2Fe0.98Pt0.02O3 (LCFP) perovskite oxide nanofibers decorated Pt–Fe2O3 nanoparticles | Solvothermal-Electrospinning-Calcination/Drop-coated | 39.8 | 10 | 250/40 | – | 0.16 ppm | –/10 min |
| |
| 5 wt % Pt-NiFe2O4/nanorods | Hydrothermal-one-step impregnation/Dripped | 221 | 100 | 180/50 | Toluene
(>5.45), | 500 ppb | 12 s/13 s (0.5 ppm) |
| |
| B-TiO2-SnS2/Nanosheets | Hydrothermal/Paste |
| 20 | rt/30 | NH3 (−), CO (−), NO2 (−), Ethanol (>6), H2S (−) | [t]757 ppb | 6.7 s/9.8 s |
| |
| Ti0.5Sn0.5O2/Nanoparticles | Hydrothermal/Slurry-coating |
| 100 | 200/– | Propylene glycol (7.5), Ethylene glycol (15.8), Acetaldehyde (10.8), NH3 (22.4) | 100 ppb | 1 s/12 s |
| |
| MgCr2O4/Spherical | Sol–gel-calcination/Hollow cylindrical alumina tube-Spin coating |
| 5 | 160/0 | Ethanol (−), NH3 (−), CO (−), Isoprene (−), H2S (−) | 100 ppb | 8.5 s/– |
| |
| WO3-MoS/flower-like sphere | Hydrothermal/- |
| 100 | 132/15 | Methanol (−), Ethanol (−), Toluene (−), NO2 (−), NH3 (−) | [t]79.46 ppb | 4 s/7 s |
| |
| Co0.57Fe2.43O4/Nanoparticles | Hydrothermal/- |
| 100 | 150/50 | Methanol (>5.4), Ethanol (>5.4), Glycol (>5.4), HCHO (5.4) | [t]44.7 ppb | –/85 s |
| |
| 3DIO NiO-SnO2/3D ordered macroporous architecture | Assembly-Photonic crystal template-Calcination/Paste-coating |
| 100 | 198.5/25 | H2 (−), NH3 (−), CH4 (−), Methanol, Ethanol (>4) | [t]0.136 ppm | 3 s/57 s |
| |
| MnFeCoNiCu (HEA)-loaded SnO2/Nanoparticles with granular morphology | Low-temperature oil-phase synthetic strategy-wet impregnation/– |
| 0.5 | 230/40 | H2 (2.96), N2O (3.29), NO2 (3.13), Ethanol (2.16), HF (2.78), NH3 (2.55), CHCl3 (2.70), HCHO (2.67), H2S (2.90) | [t]30 ppb | 4.6 s/5 s |
| |
| B–Co3O4/Wrinkled layered structures | Precipitation-Thermal treatment/Slurry-coating |
| 100 | 190/– | Ethanol (−), HCHO (−), Methanol (−), NH3 (−) | 20 ppb | 291 s/83 s |
| |
| β-Bi2Sn2O7-ZnO/Bilayer | Ultrasonic spray pyrolysis-Hydrothermal-Sintering/Spin coating |
| 50 | 280/30 | Ethanol (2.7), Benzene (9.8), HCHO (7.2), Toluene (6.1), Methanol (4.8) | [t]11.4 ppb | 13 s/– (5 ppm) |
| |
| 0.5 wt % Ir-loaded In2O3/Nanoparticles | Flame spray pyrolysis/Spin coating |
| 1 | 300/0 | Methanol (>2.5), Ethanol (>2.5), H2S (>2.5), Methyl mercaptan (>2.5), Dimethyl sulfide (>2.5), NO2 (>2.5), CH4 (>2.5), C2H2 (>2.5), H2 (>2.5), NH3 (>2.5), CO2 (>2.5), Propionic acid (>2.5), Acetic acid (>2.5), Butyric acid (>2.5) | [t]10.7 ppb | 42 s/– |
| |
| MOF-derived Ce-NiO/Nanowalls | Hydrothermal-Annealed/- |
| 10 | 175/20 | Methanol (−), Ethanol (−), NH3 (−), Acetaldehyde (−), Isoprene (−), Toluene (−) | 1 ppm | 8 s/10 s |
| |
| 0.5% Al-W18O49‑x/2D circular nanorod arrays | Solvothermal/- |
| 50 | 200/30 | Triethylamine (>3), Toluene (>3), 3H-2B (>3), HCHO (>3), Ethanol (>3), Methanol (>3), NH3 (>3), H2 (>3), H2S (>3) | 10 ppb | 8 s/24 s |
| |
| 3DOM-Co5%Ox
| Impregnation-Crystallization-Pyrolysis-Annealed/Slurry-brushed |
| 30 | rt/35 | Isopropanol (>8), Toluene (>8), Acetic acid (>8), Formic acid (>8), Formaldehyde (>8), NH3 (>8), Methanol (>8), Ethanol (>8), H2S (>8), cyclohexanone (>8) | [t]10.6 ppb | 8 s/12 s |
| |
| Co(OH)F-CQDs/hexagonal structure with hollow center | Hydrothermal/- |
| 100 | 120/40 | Butanone (4), Formic acid (6.8), NH3 (7.6), Ethanol (4.2), Toluene (7.2) | 200 ppb | 130 s/135 s |
| |
| K-Sn-Co3O4/porous microsphere | Solvothermal reaction-Annealing treatment/Slurry |
| 100 | 110/18 | Methanol (−), HCHO (−), Nitrobenzene (−), Benzene (−), NH3 (−), CO2 (−) | 100 ppb | 20 s/25 s |
| |
| SrFeO3-Ti3C2T | Electrostatic self-assembly method/Drop casting |
| 100 | rt/30 | NH3 (2.6), H2O (5.7), Ethanol (7.5), Methanol (8.5), Formalin (8.4) | 250 ppb | 7 s/17 s |
| |
| ZnO@MWCNTs-PANI/Nanoparticles-nanotubes |
|
| 20 | 150/2 | Toluene (−), Ethanol (−) | 0.2 ppm | 150 s/250 s |
| |
| CoFe2O4-TiO2@MXene-C/Spherical nanoparticles-layers | Hydrothermal/Paste |
| 100 | 185/25 | NH3 (−), HCHO (−), Methanol (−), Ethanol (−), Dimethylfumarate (−) | [t]70 ppb | 12 s/58 s |
| |
| Single-atom 8%Sn-doped ZnO/nanosheet | Ball-milling, followed by transformation and post-treatment-calcination/Drop casting |
| 10 | 290/20 | Ethanol (2.2), Methanol (4), HCHO (9.1), CO2 (27.3), N2 (53.9) | [t]0.52 ppb | 550 s/72 s |
| |
| SnO2-MoS2/Nanoparticles | Hydrothermal/Drop casting |
| 0.1 | rt/90 | Ethanol (6.6), Methanol (6.6), Toluene (4.4), Benzene (4.4), HCHO (2.2), NH3 (1.7) | [t]26 ppb | –/– |
| |
| La0.8Ca0.2Fe0.98Pt0.02O3 (LCFP) perovskite oxide nanofibers decorated Pt–Fe2O3 nanoparticles | Solvothermal-Electrospinning-Calcination/Drop-coated |
| 10 | 250/40 | – | 0.16 ppm | –/10 min |
| |
| 5 wt % Pt-NiFe2O4/nanorods | Hydrothermal-one-step impregnation/Dripped |
| 100 | 180/50 | Toluene (>5.45), | 500 ppb | 12 s/13 s (0.5 ppm) |
| |
| B-TiO2-SnS2/Nanosheets | Hydrothermal/Paste |
| 20 | rt/30 | NH3 (−), CO (−), NO2 (−), Ethanol (>6), H2S (−) | 757 ppb | 6.7 s/9.8 s |
| |
| Ti0.5Sn0.5O2/Nanoparticles | Hydrothermal/Slurry-coating |
| 100 | 200/– | Propylene glycol (7.5), Ethylene glycol (15.8), Acetaldehyde (10.8), NH3 (22.4) | 100 ppb | 1 s/12 s |
| |
| MgCr2O4/Spherical | Sol–gel-calcination/Hollow cylindrical alumina tube-Spin coating |
| 5 | 160/0 | Ethanol (−), NH3 (−), CO (−), Isoprene (−), H2S (−) | 100 ppb | 8.5 s/– |
| |
| Pt/PtOx-decorated Al2O3 + Si/WO3 nanoparticles | Flame spray pyrolysis/– |
| 1 | rt/90 | Acetaldehyde (315), H2 (789), Isoprene (263), CO (>1000), Methanol (263), Ethanol (>1000), Formaldehyde (225), 2-propanol (>1000) | [t]2 ppb | –/– |
| |
| Pt/Al2O3 + Si/WO3 nanoparticles | Flame spray pyrolysis/– |
| 1 | 135/90 | Ethanol (>500), Isoprene (>1000), H2 (>250), CO (>1000), NH3 (>1000) | [t]5.5 ppb | 55 s/100 s (500 ppb) |
| |
| CH2O | PtCu/In2O3 Hexagonal Hollow Nanotubes | MOF-derived solvothermal and bimetallic loading/– |
| 50 | 90/– | NH3 (−), Benzaldehyde (−), Acetone (−), Toluene (−), Methanol (−), Ethanol (−), Acetaldehyde (−), Benzene (−), H2S (−) | 50 ppb | 6 s/9 s |
|
| In2O3@TiO2 Double-Layer Nanospheres | Water-bath using a carbon template/Coated (slurry) |
| 1 | rt/25 | Acetone (−), NH3 (−), Methanol (−), Ethanol (−), Toluene (−), Benzene (−) | 100 ppb | 28 s/50 s |
| |
| Pt/Rh/SnO2 Hollow Nanotubes | Hydrothermal using a carbon template/Coated |
| 25 | 200/– | NH3 (−), Ethanol (−), Methanol (−), Acetone (−), Acetaldehyde (−), Benzaldehyde (−), Triethylamine (−), Trimethylamine (−) | 1000 ppb | 2.6 s/6.1 s |
| |
| Ru-doped CeO2 Nanoparticles | Chemical coprecipitation/Drop-casting-enabled spin-coating method |
| 5 | 25/– | Methanol (3), Ethanol (3), Propane-2-ol (2), Aniline (2), Ethylamine (2) | 10 ppb | 3.33 s/3.58 s |
| |
| SnO2/SnSe2 Honeycomb | Hydrothermal/Coated |
| 10 | 150/– | Acetone (−), Trimethylamine (−), H2S (−), Ethanol (−), CO (−), NO2 (−), benzene (−) | 100 ppb | 63 s/12 s |
| |
| La0.9FexSn1‑xO3 Hollow Microspheres | Hydrothermal/Paste |
| 20 | 200/– | Benzene (−), Toluene (−), Xylene (−), Acetone (−), Methanol (−), Ethanol (−) | 500 ppb | 52 s/248 s |
| |
| Mixed-Phase In2O3 Nanoparticle | Solvothermal/Paste + coated |
| 50 | 120/– | Methanol (6.6), Ethanol (6.1), Triethylamine (3.5), Toluene (5.9) | [t]11 ppb | 12 s/355 s |
| |
| CuOx clusters/Co3O4 Nanoparticles | Flame spray pyrolysis/flame-deposited directly |
| 1 | 75/50 | Acetone (7.3), Toluene (19), Ethanol (5.5), NH3 (58), CO (89), CH4 (52) | 3 ppb | 26–51 min (3–1000 ppb) |
| |
| PEI-doped In2O3 Nanospheres | Hydrothermal/Paste |
| 105 | 110/– | Ethanol (>30), Methanol (>30), Acetone (>30), Acetaldehyde (>30), Acetic acid (>30), Formic acid (>30), NH3 (>30), H2S (>30) | 50 ppb | 1.9 s/233 s |
| |
| Flower-like Microsphere ZnCo2O4/In2O3 | Hydrothermal/Coated |
| 100 | 258/– | Acetone (>4.68), Ethanol (>4.68), Methylbenzene (>4.68), NH3 (≫ 4.68), Cyclohexane (≫ 4.68) | [t]157 ppb | 51 s/52 s |
| |
| In-doped LaFeO3 Nanoparticles | Sol–gel/Paste |
| 100 | 125/– | Ethanol (4.9), Toluene (≫ 4.9), Xylene (≫ 4.9), Acetone (>4.9), NO (≫ 4.9), NO2 (≫ 4.9), CO (≫ 4.9), NH3 (≫ 4.9) | 1 ppb | 36 s/40 s |
| |
| Tb-doped SnO2 Composite | MOF-derived Solvothermal/Paste + coated |
| 10 | 200/80 | Methanol (>10), Acetone (>10), Triethylamine (>5), Ethanol (>5) | [t]0.251 ppb | 28 s/135 s |
| |
| ZnO Quantum Dots/ZnSnO3 Nanocubes | Sol–gel/– |
| 100 | 70/– | Formic acid (>10), Ethanol (>10), Acetaldedhyde (>10), Methanol (>10), NH3 (>10), Acetone (>10), Acetic acid (>10) | 100 ppb | 2 s/436 s |
| |
| Laminar SnO2 | Sn-MOF@SnO2-derived Water bath/Screen printing |
| 10 | 120/– | Triethylamine (>70), Ethanol (>534), Toluene (≫ 534), Acetone (≫ 534), Xylene (≫ 534), Methanol (≫ 534), NH3 (≫ 534), NO2 (≫ 534) | <10 ppb | 33 s/142 s |
| |
| Au Nanocage/In2O3 Nanoparticle | Solvothermal/Slurry + coated |
| 50 | 140/– | Methanol (≫ 15), Ethanol (≈15), Acetone (>15), NH3 (≫ 15), Benzene (≫ 15) | 25 ppb | 25.6 s/68.1 s |
| |
| Polypyrrole-Encapsulated MoO3 Hollow Nanostructures | Hydrothermal and cation-exchange-assisted Kirkendall effect/Slurry + drop coating |
| 100 | rt/65 | Triethylamine (−), Ethanol (−), Methanol (−), Acetaldehyde (−), Acetone (−), NH3 (−), NO2 (−), CO (−), Benzene (−), Toluene (−), Xylene (−) | 500 ppb | 13.3 s/46.37 s |
| |
| SnMOF/SnO2@TiO2 Nanotube Arrays | Solvothermal/– |
| 6 | rt/– | Methanol (>3), Ethanol (>3), Benzyl alcohol (>3), Acetonitrile (>3), Acetone (>3) | [t]80 ppb | 4 s/2.5 s |
| |
| Acetaldehyde | NiO Nanosheets-WO3 Nanorods | Hydrothermal/– |
| 100 | 250/– | CO2 (−), CO (−), NO2 (−), H2S (−) | – | 1177 s/632 s |
|
| SnO2 Nanoparticles | MOF-derived hydrothermal/Coated |
| 40 | 100/– | Formaldehyde (1.6), Ethylene glycol (2.3), Acetone (>2.3), Acetic acid (>2.3), Ethanol (>2.3) | 50 ppb | 3 s/4 s |
| |
| CuO NPs/rGO Composite | Hydrothermal/– |
| 100 | rt/70 | CO (6.2), NO2 (19.6), Methanol (), Acetone (>19.6), Ethanol (>19.6), Isoacetone (>19.6), n-Propionaldehyde (>19.6), n-Butyraldehyde (4.7), NH3 (3.1) | [t]95.1 ppb | 22 s/159 s |
| |
| MoS2 QDs/PEDOT: PSS | Hydrothermal and in situ polymerization/Drop coating |
| 100 | rt/– | Methanol (−), Ethanol (−), Acetone (−), Tetrahydrofuran (−), Formaldehyde (−) | 1000 ppb | 137 s/99 s |
| |
| H2S | CsPbBr3 perovskite | Antisolvent/Drop casting |
| 5 | rt/– | NO2 (>4), NH3 (>4), Ethylene (>4), CO (>4), SF6 (>4) | 200 ppb | 73.5 s/275.6 s |
|
| Ru@SnO2 Nanospheres | Solvothermal and deposition–precipitation/Drop coated |
| 20 | 160/– | Acetone (−), NH3 (−), NO2 (−), SO2 (−), CH4 (−), H2 (−), Ethanol (−), Trimethylamine (−) | 100 ppb | <1 s/47 s |
| |
| BVO/Ag spindles | Hydrothermal and wet impregnation/Paste - brush |
| 50 | 100/– | CO2 (>10), CO (>10), SO2 (>10), NH3 (>10), H2 (>10), CH4 (>10), Acetone (>10), Ethanol (>10) | 100 ppb | 24 s/27 s |
| |
| Co3O4/ZnO Hollow Nanofibers | MOF-derived electrospinning/- |
| 0.2 | 325/– | NH3 (−), Ethanol (−), Xylene (−), NO2 (−), SO2 (−), Formaldehyde (−), Acetone (−) | 200 ppb | 88.7 s/110.6 s |
| |
| CuWO4-WO3 Nanofibers | Electrospinning combined with a sacrificial template/Drop-coating |
| 5 | 200/– | CO (>50), Acetone (>50), H2 (>50), Toluene (>50) | 100 ppb | 283 s/151 s |
| |
| Cu2O-CuFe2O4 Nanoarrays | Electrochemical in situ assembly/Vacuum ion sputtering |
| 0.01 | rt/20–90 | Ethanol (≫ 50), Methanol (≫ 50), Butanol (≫ 50), H2 (≫ 50), Ethylene glycol (≫ 50), NH3 (≫ 50), CO (≫ 50), SO2 (≫ 50), Acetone (≫ 50), NO2 (>50) | 10 ppb | 283 s/– |
| |
| WO3/CuO Nanocomposite | Electrospinning/Brush-coated |
| 5 | 150/– | Ethanol (−), NH3 (−), Trimethylamine (−), Acetone (−) | 500 ppb | 24 s/78 s |
| |
| CdS-Co3O4 Porous Nanoflower Spherical | Hydrothermal and liquid-borne ultrasound assistance/Drop-coated |
| 10 | rt/43 | NO2 (−), H2 (−), CO (−), NH3 (−), Methanol (−), Ethanol (−), Acetone (−), Xylene (−), Triethylamine (−), DMF (−) | 200 ppb | 86 s/51 s |
| |
| Fe2O3/Ti3C2 Nanostructure | In situ self-assembly/Paste - brush |
| 20 | rt/30 | NH3 (−), Methanol (−), Acetone (−), Ethanol (−), Benzene (−), CO (−), NO2 (−), CH4 (−), Formaldehyde (−) | 10 ppb | <10 s/<15 s |
| |
| Flower-petal-like Au/SnO2 Nanostructure | Sol–gel/Spin-coated |
| 0.5 | rt/17.5 | Acetone (−), NH3 (−), CO (−), N2 (−), NO (6.95), NO2 (3.39) | 2 ppb | 30 s/126 s |
| |
| MoSe2@SnO2 Nanocomposite | Electrospinning and hydrothermal/Drop casted |
| 500 | rt/– | NH3 (−), NO2 (−), CO2 (−), CH4 (−) | [t]15 ppb | 35 s/64 s |
| |
| ZnO Nanoparticles | Coprecipitation/Slurry - loaded |
| 1 | 220/– | Ethanol (−), CHN (−), CF2H2 (−), Acetone (−), Propane (−), Toluene (−), CH4 (−), NH3 (−), CO (>13), Ethylene (−), Butane (−) | 50 ppb | 72 s/29 s |
| |
| CuO-WO3 Microflowers | Hydrothermal/– |
| 10 | 60/– | SO2 (−), CO (−), NO2 (−), Methanol (−), Ethanol (−), Ethylene glycol (−) | [t]1 ppb | 4 s/– |
| |
| CuO Nanoflowers | Laser ablation/Electrohydrodynamics inkjet printed |
| 0.1 | rt/– | CO (−), NH3 (−), Ethanol (−), Acetone (−), NO2 (−) | 10 ppb | 250 s/– |
| |
| MoO3 Nanobelts decorated with MnO2 Nanoparticles | Hydrothermal/Drop-casted |
| 100 | rt/– | H2 (−), NO2 (−), CO (−), NH3 (−), SO2 (−) | [t]4.58 ppb | 40 s/42 s |
| |
| Methanol | Carbon Nanofibers/NiCo2O4 Films | Hydrothermal/– |
| 50 | 150/– | Ethanol (5.9), Xylene (8.5), Acetone (7.9), Hexane (9.6), Butanol (10.4), Acetidin (10.4), Dichloromethane (19.2) | – | 96 s/116 s |
|
| Ag-LaFeO3@ZnO-Pt Core–shell Sphere | Hydrothermal/Screen printing |
| 5 | 86/– | Formaldehyde (>3.6), Ethanol (≫ 3.6), NH3 (≫ 3.6), Toluene (≫ 3.6), Acetone (≫ 3.6), Benzene (≫ 3.6), Xylene (≫ 3.6), Triethylamine (≫ 3.6) | [t]3.27 ppb | 81 s/79 s |
| |
| In2O3 Nanocubes/Ti3C2T | Hydrothermal self-assembly/Slurry - brush |
| 5 | rt/– | Acetone (−), Xylene (−), Triethylamine (−), Trimethylamine (−), Toluene (−) | – | 6.5 s/3.5 s |
| |
| ZnO Quantum Dots Decorated Carbon Nanotubes | Sparking and thermal chemical vapor/CNT - directly grown + drop-coated |
| 500 | rt/– | Acetone (−), Dimethylformamide (−), NH3 (−), Ethanol (−), Formalin (−), Toluene (−) | – | 49 s/26 s |
| |
| Hollow Urchin-like Ag-doped In2O3 Nanomaterial | Solvothermal/Paste - coated |
| 50 | 200/– | Ethanol (−), Isopropanol (−), Ethanediol (−), NH3 (−), Toluene (−), Acetone (−) | – | 2.4 s/9 s |
| |
| 0.1CeO2-coated SnO2 monolithic bilayer | Ultrasonic spray pyrolysis and screen-printing |
| 5 | 400/– | Ethanol (16.8), Formaldehyde (−), Acetone (−), CO (−), NH3 (−) | [t]0.021 ppm | 4 s/– |
| |
| Porous LaFeO3 nanoarchitectures | Precipitation and calcination/Thin-film coating + micro-welding process |
| 100 | 150/40 | Triethylamine (>20), NH3 (>250), Xylene (>100), Acetone (>100), Ethanol (>100), Formaldehyde (>100), Isopropanol (>50) | – | 23 s/25 s |
| |
| Pd-SnO2 microsensor | Microfabricated film integrated with a Tenax TA separation column/– |
| 148 (breath sample) | rt/100 | Ethanol (−) (breath sample) | 10 ppm | <2 min/15 min (10–1000 ppm) |
| |
| Ethanol | Fe2O3/Fe2(MoO4)3 Composite | Microwave-assisted
and |
| 50 | 200/– | Methanol (>4), NO (>4), CO (>4), NH3 (>4), H2S (>4), Isopropanol (>4), Formaldehyde (>4), Benzene (>4) | 1000 ppb | 5 s/30 s |
|
| In2S3/In2O3/In2S3 Hollow Nanofibers | Electrospinning and postvulcanization/Slurry - coated |
| 100 | 200/– | NO2 (1.82), Methanol (2.49), Acetone (11.79), NH3 (18.25), Toluene (19.66) | – | 1 s/25 s |
| |
| Au Nanoparticle-Adsorbed ZnO Nanorod Arrays | Hydrothermal and photochemical deposition/RF sputtering + HTM process + Ag evaporation |
| 100 | 270/– | Methanol (−), Isopropanol (−), Acetone (−) | – | 3.39 s/179.38 s |
| |
| Mesoporous In2O3-ZnO Hierarchical Structure | Hydrothermal/Paste - brush |
| 100 | 225/– | NO2 (>3.1), Acetone (>3.1), Methanol (≫ 3.1), Benzene (≫ 3.1), Toluene (≫ 3.1), CO (≫ 3.1), H2 (≫ 3.1), CH4 (≫ 3.1) | 200 ppb | 4 s/90 s |
| |
| Benzene | Au-ZnO/exfoliated WSe2 | Hydrothermal and liquid-phase exfoliation/Layer self-assembly technique |
| 50 | rt/– | Toluene (>6), NH3 (>6), Xylene (>6), Ethanol (>6), Formaldehyde (>6), Methanol (≫ 6), Acetone (≫ 6), H2S (≫ 6), NO2 (≫ 6), SO2 (≫ 6), O3 (≫ 6) | – | 47 s/70 s |
|
| Pd doped CoTiO3/TiO2 Nanospheres | Hydrothermal/Screen printing |
| 50 | rt/– | NH3 (−), Formaldehyde (−), Ethanol (−), Acetone (−) | 100 ppb | 49 s/9 s |
| |
| Raisin(Pd-Co3O4)-Bread(SnO2) Structure Film | Ultrasonic spray pyrolysis/Screen-printing |
| 5 | 325/– | Ethanol (>2.15), Formaldehyde (>2.15), CO (≫ 2.15), Toluene (2.15), Xylene (>2.15) | [t]4.4 ppb | 8 s/50 s |
| |
| Sr-CeO2 Nanopetals | Coprecipitation/Drop-casting aided spin-coating technique |
| 50 | rt/– | Aniline (4.15), Isopropanol (3.75), Methanol (3.25), Ethanol (3.14), Acetone (2.95) | – | 28 s/29 s |
| |
| Au-Pt Nanoparticle-supported ZnO Porous Nanobelts | In situ thermal oxidation/Coated |
| 50 | 300/– | Dimethylformamide (−), Methanol (−), Formaldehyde (−), Ethyl ether (−), Acetone (−), NH3 (−) | <100 ppb | 8 s/30 s |
| |
| WO3-Pd/SnO2 nanoparticles | Flame spray pyrolysis/– |
| 1 | 260/50 | Xylene (>200), Toluene (>200), Acetone (>200), Acetaldehyde (>200), Isoprene (>200), Methanol (>200), Ethanol (>200), CO (>200), H2 (>200), Ethylbenzene (>200) | 0.013 ppm | 36 s/47 s (100 ppb) |
| |
| CoCu2O3-Pd/SnO2 nanocrystals | Flame spray pyrolysis/– |
| 1 | 170/50 | Toluene (−), Xylene (−), Isoprene (−), Acetone (−), Ethanol (−), Methanol (−), H2 (−), NO (−), CO (−), NO2 (−), Formaldehyde (−), N2O (−) | 12 ppb | 3.8 ± 0.7 min/7.3 ± 0.9 min |
| |
| Toluene | Co3O4/ZIF-67 composite | Microwave-assisted hydrothermal and reflux/Drop casting |
| 100 | 250/– | Methanol (>5.43), Acetone (>5.43), 2-butanone (5.43), m-xylene (>5.43), Benzene (>5.43) | – | 93.2 s/224.3 s |
|
| SnO2@Co3O4 Nanospheres | Hydrothermal/Drop casting |
| 100 | 300/– | Methanol (1.8), Ethanol (2.3), Acetone (2.3), H2S (3.9) | [t]831 ppb | 25 s/10 s |
| |
| Au/ZnO-Al | Deposition–precipitation/Dropping |
| 5 | 275/– | Ethanol (3.1), Acetone (3.5), NH3 (3) | [t]1.1 ppb | – |
| |
| Urchin-like ZnFe2O4 Spheres | Solvothermal/Paste coated - brush |
| 100 | 250/– | Acetone (−), Ethanol (−), Methanol (−), Formaldehyde (−), Xylene (−) | 200 ppb | 3 s/208 s |
| |
| Xylene | CVD ZnO Nanorods | Thermal CVD/– |
| 200 | 300/– | Formaldehyde (−), Ethanol (−), Benzene (−), Toluene (−), Methylamine (−), Dimethylamine (−) | – | 16 s/48 s |
|
| NiO-yolk Triple-shell Microspheres | MOF-derived Microwave-assisted solvothermal/Drop casting |
| 100 | 350/dry | Methanol (5.53), 2-butanone (2.62), 3-methyl-1-butanol (5.53), Acetone (2.92), Ethanol (6.18) | [t]5.43 ppb | 89 s/191 s |
| |
| CuFe2O4 Nanotubes | Electrospinning and liquid precipitation/Coating |
| 100 | 260/30 | Methanol (>3), Ethanol (>2), Acetone (>2), Formaldehyde (>3), Benzene (4), Toluene (2) | [t]380 ppb | <5 s/(594 ± 40) s |
| |
| Sn-SnO2 Nanocomposite | Solvothermal/Drop casting |
| 60 | rt/40 | Toluene (−), Ethylbenzene (−), Benzene (−), Ethanol (−), Acetone (−) | 1.9 ppm | 1.5 s/40 s |
| |
| Mo-doped Co3O4 Nanorods | MOF-derived solution preparation/Coating |
| 100 | 140/– | NH3 (>2.1), Ethanol (2.1), Isopropanol (>2.1), Acetone (>2.1), Toluene (>2.1), Methanol (>2.1), Formaldehyde (>2.1), CO (≫ 2.1), NO (≫ 2.1), NO2 (≫ 2.1) | 500 ppb | 232 s/744 s |
|
- —Schweizerischer Nationalfonds zur F?rderung der Wissenschaftlichen Forschung10.13039/501100001711
- —Funda??o de Amparo ? Pesquisa do Estado de S?o Paulo10.13039/501100001807
- —Funda??o de Amparo ? Pesquisa do Estado de S?o Paulo10.13039/501100001807
- —Funda??o de Amparo ? Pesquisa do Estado de S?o Paulo10.13039/501100001807
- —Funda??o de Amparo ? Pesquisa do Estado de S?o Paulo10.13039/501100001807
- —Coordena??o de Aperfei?oamento de Pessoal de N?vel Superior10.13039/501100002322
- —Coordena??o de Aperfei?oamento de Pessoal de N?vel Superior10.13039/501100002322
- —Eidgen?ssische Technische Hochschule Z?rich10.13039/501100003006
- —Conselho Nacional de Desenvolvimento Cient?fico e Tecnol?gico10.13039/501100003593
- —Staatssekretariat f?r Bildung, Forschung und Innovation10.13039/501100007352
Peer Reviews
No public reviews on file for this paper yet. If you reviewed it on a platform where reviews are public (OpenReview, ICLR, NeurIPS, ICML), you can paste yours below so the community can read it here.
Videos
No videos yet. Explain this paper in a talk, walkthrough, or lecture? Add one.
Taxonomy
TopicsGas Sensing Nanomaterials and Sensors · Advanced Chemical Sensor Technologies · Covalent Organic Framework Applications
Introduction
1
Air pollution is a major social and environmental concern, causing severe impacts on both human health and the environment. Data published by the World Health Organization (WHO) on air quality standards indicate that 99% of the global population is routinely exposed to indoor and outdoor environments with pollution levels exceeding the recommended air quality limits.? This is particularly critical in urban settings due to intense transportation and concentrated industrial activities.? In 2019, air pollution was associated with approximately 6.7 million premature deaths worldwide,? with a higher prevalence in developing countries, particularly in the Southeast Asian and Western Pacific regions.?
Groups strongly susceptible to the adverse effects of air pollution include children and the elderly, middle-aged adults,? pregnant women,? and individuals with pre-existing health conditions, such as asthma,? hypertension, respiratory and cardiovascular diseases.? Furthermore, studies have shown that older women and African Americans living in urban areas of the United States are more vulnerable to respiratory problems associated with air pollution caused by wildfires and the generation of particulate matter (PM).? Further studies indicate that socioeconomic factors play a role; thus, low-income populations tend to be at higher risk.?
The main air pollutants include CO, O_3_, NO* x , SO x *, Pb, Cd, and fine particulate matter (PM_2.5_ and PM_10_),? volatile organic compounds (VOCs), and pathogens (fungi, bacteria, and viruses).? Long- and short-term exposure to high levels of air pollutants has been linked to an increased risk of respiratory and cardiovascular diseases,? headaches, dizziness, irritation of the mucous membranes, skin, eyes, and allergic reactions.? Furthermore, several compounds have toxic effects on the body, including neurotoxicity, neurodegenerative conditions, and carcinogenicity.? Among the carcinogenic? compounds are benzene, formaldehyde, acetaldehyde, naphthalene, ethylbenzene, tetrachloroethylene, and styrene that have been associated with the development of lung, breast, and thyroid cancer as well as leukemia. ?,? Air pollutants are also responsible for climate change and damage to ecosystems. Acid rain, particulate matter deposits? and other air pollutants interfere with plant metabolism and physiology,? promoting acidification and altered nutrient cycling in soils? that results in economic loss.
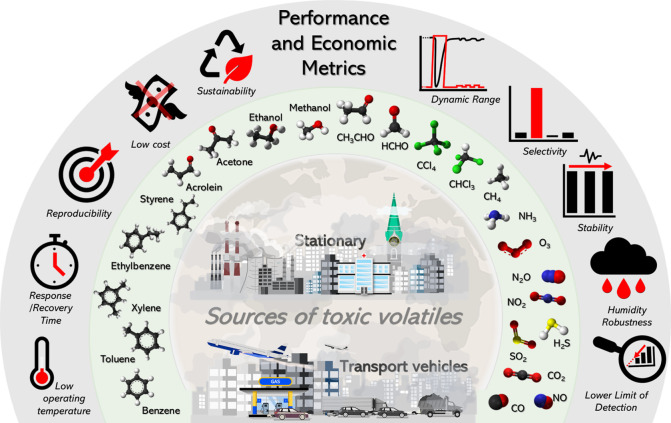
The development and application of innovative sensor materials and devices for monitoring and mitigating gaseous pollutants are of fundamental importance. However, most available air quality sensors lack the required performance to track critical pollutants.? Figure illustrates the key performance and economic metrics that air quality sensors need to meet. Detection challenges involve: (1) achieving a satisfactory lower limit of detection (LLOD) to recognize air pollutants at their typical trace concentrations, (2) selectivity to discriminate between different chemical species, (3) fast and reversible response needed for continuous monitoring, ?,? (4) operational stability and (5) robustness against environmental conditions, including temperature and relative humidity fluctuations. ?,? Furthermore, economic considerations encompass the scalable manufacturing and use of sustainable, low-cost materials with minimal energy consumption.
Schematic illustration of the main air pollutants, environmental sources, performance metrics, and economic aspects of chemoresistive sensors.
In solid-state chemoresistive sensors, surface interactions with gaseous molecules cause variations in the electrical conductivity of the material, ?,? enabling the detection of chemical species.? In this context, the response to air pollutants depends entirely on the interaction between these molecules and the active surface of the sensor, resulting in signal transduction at the interface. Promising strategies to design high-performance gas sensors rely on the deployment of nanometric porous materials (1–100 nm), ?−? ? semiconductor metal oxides, ?−? ? ? ? ? ? ? nitrides, ?,? sulfides, ?,? bromides, ?,? metal–organic frameworks (MOFs), ?−? ? ? ? ? zeolites, ?,? functionalized materials based on carbon nanotubes,? graphene, ?,? noble metals, and composites. ?,? The nature of the physical and chemical interactions between the VOCs and the sensor surface affects the detection mechanism.? Further, structural factors such as nanoparticle morphology, film architecture, specific surface area, density of active sites, grain size, and porosity influence the electrical gas responses of semiconductors. ?,? Altogether, these highlight the need for a thorough analysis of the intertwined physicochemical and mesoscale features that ultimately govern gas–solid interactions and charge-transport pathways.
Previous reviews have explored the development of chemoresistive gas sensor materials with high porosity, surface area, ?−? ? activated adsorption sites, gas diffusion ability, ?,? catalytic properties,? and material defectsoxygen and metal vacancies ?−? ? ? very often responsible for improving sensing performance of many material types. These reviews covered diverse synthesis technologies, such as hydrothermal and solvothermal (including microwave-assisted),? coprecipitation,? chemical reduction,? sol–gel,? flame spray pyrolysis (FSP),? electrospinning,? and others to obtain different chemoresistive gas sensor materials. Also, operational concepts (e.g., light activation)? and signal processing strategies? have been covered. A wide range of applications is targeted, among health/medical, ?−? ? ? ? ? ? ? ? space? and air quality,? with different approaches to environmental monitoring based, for instance, on emerging “Internet of Things” (IoT) and Artificial Intelligence (AI) capabilities. ?−? ? ? Yet, none of them has offered a detailed comparison of sensor performance against current exposure guidelines from agencies such as the EPA (U.S.), EEA (Europe), and MEE (China). ?−? ? ?
This review provides a comprehensive overview of state-of-the-art chemoresistive sensor technologies developed over the past five years. We assess recent innovations based on their adherence to national and regional air quality exposure guidelines to benchmark progress and identify opportunities for further research and development. We begin by summarizing the main toxic volatile compounds, their emission sources, the recommended exposure limits for each analyte, and the associated health effects of prolonged exposure (Section). Based on these regulatory requirements, we identify chemoresistive gas sensors (published within the last five years) that achieve the required performance metrics (Section, Table). Additionally, we elaborate on the fundamental sensing mechanisms of chemoresistive materials, such as metal oxides (MO* x *), transition metal dichalcogenides (TMDs), transition metal nitrides (TMNs), transition metal halides (TMHs), MXene composites, metal–organic frameworks (MOFs) and their derivatives, conductive polymers, and organic materials, highlighting the key physicochemical properties and interactions that govern their sensing performance. From this analysis, we identify strategies to overcome existing limitations in sensing performance and in the practical implementation of these materials into functional devices (Sections). To summarize, Figure shows a systematic overview of the transition from nanoparticles and porous materials fabrication to real functional devices, emphasizing the need for engineering across multiple length scales to preserve the sensing performance while ensuring reliable operation in real-time air quality monitoring under real conditions.
Schematic overview illustrating the pathway from nanoscale material synthesis (nanoparticles and porous materials) to sensor functionalization, performance evaluation, microsensor integration, and real-time air quality monitoring applications.
Air Pollutants: Origin, Health Effects, and
Exposure Limits
2
Classes of Gaseous Pollutants
2.1
Air pollutants are classified as primary and secondary, according to their origin. Primary pollutants, such as SO_2_, NO* x *, CO, CO_2_, CH_4_, NH_3_, VOCs, and particulate matter, are emitted directly into the atmosphere, primarily by industrial activities, fossil fuel combustion, mobile source emissions, agricultural and deforestation activities, as well as petroleum and mining processes.? In turn, secondary pollutants, such as ozone, nitrites, nitrates, peroxyacetyl nitrate, sulfates, and aldehydes, result from chemical reactions between primary pollutants and the atmosphere,? intensifying the greenhouse effect and contributing to photochemical smog. ?,?
Although there is extensive discussion of environmental pollution guidelines focused on particulate matter and inorganic compounds, little emphasis is given to the importance and impact of VOCs.? These encompass a diverse class of hydrocarbon-based organic chemical compounds that have relatively high vapor pressure and low molecular weight,? as well as resistance to spontaneous degradation. ?,? Furthermore, VOCs can be classified according to their volatility and intensity of emission into the environment, highlighting: highly volatile compounds, such as methyl chloride, propane, and butane; volatile compounds, such as alcohols, ketones, formaldehyde, and aromatic organic compounds (benzene, toluene, xylene, etc.); and semivolatile compounds, such as pesticides, organophosphates and PAHs. ?,?
Naturally occurring VOCs result from atmospheric emissions, forest fires, volcanic and geothermal activity, microbiological processes, dust, and aerosols. On the other hand, the main toxic VOCs are associated with emissions from anthropogenic sources, stationary sources, transport vehicles, and intense human activity, as represented in Figure.? Studies indicate that many synthetic materials and human activities increase the release of toxic volatile compounds into indoor environments, resulting in VOC concentrations that are often higher than those observed outdoors. ?,? This difference stems from the diverse sources of VOCs, such as acetone, ethanol, benzene, toluene, xylene, formaldehyde, and ethylbenzene, present in indoor environments, with approximately 52% derived from building materials alone.? Furthermore, the use of cleaning, hygiene, and cosmetic chemicals, furniture and decorative materials, paints, heaters, cooking gas, and smoking primarily contribute to this effect. ?,?
This section reviews the main types of air pollutants, emphasizing their main emission sources, adverse effects on human health and in animal models, as available in the literature, and the exposure limits established by different regulatory bodies. The information presented in Table was compiled from databases provided by internationally recognized institutions such as the World Health Organization (WHO), the United States Environmental Protection Agency (US EPA), the National Institute for Occupational Safety and Health (NIOSH), the Centers for Disease Control and Prevention (CDC), the National Institutes of Health (NIH), the Occupational Safety and Health Administration (OSHA), the American Conference of Governmental Industrial Hygienists (ACGIH), the International Agency for Research on Cancer (IARC), and the American Lung Association (ALA). Furthermore, comparisons were made with the European Environment Agency (EEA), European Chemicals Agency (ECHA), Health and Safety Executive (HSE), Institute for Occupational Safety and Health of German Social Accident Insurance (IFA), Chinese Ministry of Ecology and Environment (MEE), and Chinese National Health Commission (NHC), as specified by the respective citations.
1: Summary of Key Gaseous Pollutants with Toxic Effects and Typical Concentration Ranges
Alcohols
2.1.1
Methanol and ethanol are primarily present in distillation factories, motor fuels, pharmaceuticals, and pigments production.? They are considered moderately toxic yet teratogenic compounds. Exposure can cause headaches, dizziness, and allergic reactions. Methanol is a widely used chemical feedstock in laboratories and chemical plants, posing a potential hazard for intoxication. Its ingestion, inhalation, or skin absorption leads to irreversible tissue damage to the eyes and nervous system, or even death.? Especially in developing countries, methanol poisoning outbreaks occur frequently due to adulterated alcohol,? such as in India with >90 deaths in February 2019.? In 2025, a serious incident of methanol poisoning occurred in Brazil linked to the commercialization of adulterated alcoholic beverages. The outbreak resulted in severe symptoms in 209 suspected cases and 15 confirmed deaths as of the time of this discussion.? Such events highlight the ongoing risks associated with illicit alcohol production and underscore the need for stricter regulatory monitoring and public awareness to prevent future occurrences.
Ketones
2.1.2
Acetone is widely used as a solvent in various applications including chemical cleaning products, hygiene products, and paints. Long-term exposure can irritate mucous membranes and damage the respiratory and nervous systems. The National Institute for Occupational Safety and Health recommends a long-term (10 h) exposure of 250 ppm–594.0 mg/m^3^.?
Aldehydes
2.1.3
Formaldehyde (CH_2_O) is a colorless and flammable gas produced by the oxidation of methanol or methane in the presence of a catalyst.? Formaldehyde is a major indoor pollutant in various industries, including the production of cosmetics, paints, formaldehyde-based wooden products, and during the combustion of biofuels. ?−? ? However, formaldehyde is also a concern in outdoor environments due to the increase in forest fires and the large-scale consumption of biofuels in recent years. Exposure to formaldehyde can lead to various health issues in humans. Formaldehyde acute effects mainly occur by inhalation and can cause coughing, chest pain, irritation in different parts of the body, and wheezing. Other chronic disorders, such as respiratory infections, dermatitis, and skin irritations, can be observed after long-term exposure to formaldehyde.? Acetaldehyde (CH_3_CHO) is a colorless gas, flammable, and exhibits a fruity odor at lower concentrations.? The main sources of acetaldehyde are summarized in the production of resins, perfumes, and are used as a solvent in the rubber and paper industries.? Acetaldehyde also plays an important role in the metabolism of plants and animals.? Irritation of the eyes, skin, and respiratory tract is one of the acute effects caused by. Acetaldehyde is classified as a possible human carcinogen (Group B2) by the EPA.?
Aromatic Compounds
2.1.4
Aromatic compounds, such as benzene, toluene, and xylene, exhibit a high degree of toxicity and carcinogenicity upon exposure. Benzene, for instance, is primarily released during gasoline handling at gas stations and is also found in building materials, tobacco smoke, and furniture. ?,? Loss of consciousness, headache, confusion, and drowsiness are some of the acute effects caused by exposure to benzene.? Benzene is classified as a Group 1 carcinogen in humans by the International Agency for Research on Cancer (IARC) during chronic exposure. Other chronic effects may be observed in humans, such as lung cancer and leukemia.? Toluene and xylenes are primarily found in the automotive industry, cigarette smoke, gas stations, refineries, and as solvents in adhesives and cleaning agents. ?,? These aromatic compounds also present high toxicity and carcinogenic levels. For instance, exposure to toluene may affect the central nervous system, causing headaches, fatigue, drowsiness, and cardiac arrhythmia.? Upon exposure to xylene, similar effects can be observed in humans, including neurological issues, impacts on lung function, gastrointestinal function, and dyspnea.?
Sulfur Compounds
2.1.5
Hydrogen sulfide (H_2_S) is a flammable and colorless gas characterized by the distinctive odor of rotten eggs. H_2_S is a gas of considerable environmental and occupational concern. It is generated primarily during processes such as oil and natural gas refining, the decomposition of human and animal waste, the treatment of industrial effluents, and the manufacturing of fertilizers and various chemicals. ?,? In addition, large amounts of H_2_S are naturally released in landfills as a byproduct of the anaerobic breakdown of organic matter.? Due to its physicochemical properties, H_2_S is highly toxic and can be absorbed rapidly through the lungs upon inhalation. Acute exposure may result in severe irritation of the respiratory tract, often accompanied by neurological symptoms such as seizures, headaches, dizziness, and even apnea. At higher concentrations, the gas can impair cellular respiration by inhibiting cytochrome oxidase, leading to systemic toxicity and, in extreme cases, fatal outcomes.? Exposure to H_2_S is a significant concern in public health, particularly due to the large number of industrial facilities that release this pollutant gas.
Organochlorines
2.1.6
This class includes chloroform and carbon tetrachloride. Chloroform is derived from sources such as hydrochlorofluorocarbons, solvent use, water chlorination processes, pulp and paper mills, and landfills. Carbon tetrachloride is used in the manufacture of refrigerants, aerosols, solvents, rubbers, and paints. Among the acute effects, depression of the central nervous system, liver, and kidneys stands out, but exposure can also cause pulmonary edema.
NO
x , COx, NH3, SO x , and O3
2.1.7
These pollutants comprise a group of gases released into the atmosphere on a large scale, primarily through human activities that intensify the greenhouse effect and contribute to the formation of photochemical smog. CO_2_ and carbon monoxide CO are primarily produced by the burning of fuels and wood, which is directly related to financial interests at the expense of sustainability. Other gases, such as NO* x
- and SO* x *, are also released by combustion engines and coal-fired power plants. These compounds and VOCs can form secondary pollutants, including O_3_, through photochemical reactions when exposed to sunlight. In general, exposure to these highly toxic gases can cause pulmonary and cardiovascular diseases, allergic reactions, skin and mucous membrane irritation, difficult breathing, coughing, dizziness, and pulmonary edema, so prolonged exposure at high concentrations can be fatal.?
State-of-the-Art Gas Sensors for Air Pollutant
Detection
3
Chemiresistive gas sensors are based on various classes of materials (Figure) and can be broadly divided into two groups: inorganic and carbon-based materials. The inorganic materials include semiconducting metal oxides (SMO* x *), ?,? transition metal dichalcogenides (TMDs), ?,? transition metal nitrides (TMNs),? transition metal halides (TMHs, e.g., bromide compounds),? and MXene-based materials? (Figure, orange-shaded). On the other hand, the carbon-based materials comprise porous materials such as metal–organic frameworks (MOFs) and covalent–organic frameworks (COFs), ?−? ? graphene and reduced graphene oxide (rGO),? carbon nanotubes (CNTs),? conducting polymers, and other organic sensing materials ?,? (green-shaded). These materials can be combined to yield new material compositions and interfaces capable of tuning sensitivity, selectivity, stability, response and recovery times, and lower limit of detection (LLOD).
Overview of new materials and design strategies used to develop chemiresistive gas sensors from both carbon-based and noncarbon materials.
Over the past five years, the literature has explored various strategies to modify materials based on advances in engineering of fabrication processes followed by their assembly into sensing devices (Figure). These approaches aim to create novel materials with complex structural and electronic composition. For instance, metal oxides and their heterostructures can be manufactured with different approaches, surface-decorated with active single metal atoms or clusters of varying size? and even Janus-like particles:? these topics will be detailed in Sections–3.1.3. Some crystal configurations of chemiresistive materials, such as MXenes, perovskites, and spinel structures that define both the electronic and chemical surface properties, will be elaborated in Sections and 3.3. Other materials such as zeolites, MOFs/COFs (conducting polymers and organic materials), and organic functionalizations (MO* x */graphene and/or reduced graphene) are inherently microporous, a key consideration for molecular diffusion and active-site accessibility, as will be discussed in Sections–3.6. Collectively, these design features are engineered to fine-tune the material’s structural and electronic properties, including porosity, surface area, pore architecture, gas adsorption behavior, and defect types (oxygen and/or metal vacancies), resulting in enhanced detection performance as schematically illustrated in Figure.
This review analyzes the progress in the field of chemoresistive gas sensor material design in close comparison to the established exposure limits (Table). We elaborate on the merits of synthesis and characterization techniques along with diverse surface and morphology engineering strategies, which have greatly enhanced sensor development and performance. Table identifies chemoresistive materials that have already met (or are promising to meet) air pollutants’ exposure guideline values under laboratory or even real-world conditions. In Table, we meticulously identify material composition, morphology, synthesis method, sensor response, target gas concentration (ppm), operating temperature (°C), and relative humidity (RH) conditions, selectivity, and lower limit of detection, as well as response (t resp) and recovery (t rec) times.
2: Performance Comparison of Material-Based Sensors for Air Pollutants over the Last 5 Years
Metal-Oxide (MO
x ) Sensors and Strategies to Improve Toxic Volatile Detection
3.1
As can be noted in Table, either pristine or heterostructured/doped semiconductor MO* x ’s are widely deployed across most of the air pollutants, with the notable exception of CO_2_, where MO x ’s are either interfaced with other materials classes (e.g., MOFs, MXenes, CNTs), or very different sensor concepts (e.g., optical?) are preferred. Next, we examine the theory behind chemoresistivity, with particular emphasis on the most studied MO x *, which should share similarities in principle with other semiconductor materials relevant to quality monitoring. After discussing some fundamentals, we explain redox chemistry in microscopic relation to electronic band structure and space-charge effects, followed by a critical review of the mechanisms triggering such electrical responses, in light of recent operando spectroscopic investigations.
Theory of MO
x Semiconductors
3.1.1
In ideal, defect-free, and perfectly stoichiometric oxide crystals, the Fermi level (E F) lies approximately at midgap between the valence band maximum (VBM) and conduction band minimum (CBM), deviating only slightlytypically by a few tens of meV, toward one band edge, depending on the relative effective masses of holes and electrons in the VB and CB, respectively. Owing to the absence of native donors (e.g., oxygen vacancies in n-type MO* x )? or acceptors (e.g., cation vacancy in p-type MO x *),? such a purely intrinsic semiconductor would exhibit negligible free-carrier density and therefore function neither as an effective chemoresistor, nor as a suitable material for other surface-redox processes, such as heterogeneous catalysis? or electrochemical energy conversion.? In fact, for these applications, native defects are essential, as they (i) provide the donor–acceptor imbalance necessary for carrier modulation via n- or p-doping, and (ii) introduce intrinsic nonstoichiometry at the reactive surface, which typically fosters the adsorption, activation, and conversion of air pollutant molecules, i.e., the receptor function.?
Beyond native oxygen vacancies (n-doping) or interstitials (p-doping), doping small quantities of aliovalent metals into the MO* x
- lattice also introduces donors or acceptors (depending on relative valence states), rendering the semiconductor a practical, so-called extrinsic, resistive device.? For this purpose, a dopant concentration sufficiently larger than the intrinsic semiconductor carrier concentration (n i) is required (e.g., >1000-fold). Given that n i is relatively low, and that a large fraction of extrinsic donor-/acceptor-states is usually ionized already at room temperature, doping is achieved at trace-level quantities (e.g., ppm-level atomic fractions). However, we note that the term “doping” is overused in the literature, being employed any time that a foreign element is added in any quantity (up to several wt%), and often even segregating into reactive domains on the surface. As a result, functional MO* x
- are always either n- or p-type semiconductors, depending on whether E F lies closer to the CBM (donor states filled) or VBM (acceptor states filled), resulting in electrons or holes being the majority charge carriers, respectively.
For both n- and p-type MO* x *, resistance changes are governed by redox-related electrostatic surface fields that shift E F relative to vacuum (E vacuum), i.e., work function (Φ = E vacuum – E F),? thereby inducing a rigid shift of all semiconductor energy levels below E F, that is, those with positive binding energy. As shown in Figurea,b, at the surface, this can either bring these states farther from or closer to E F, depending on whether Φ decreases (“reducing agents”, surface donors, downward band bending) or increases (“oxidizing agents”, surface acceptors, upward band bending), respectively. The spatial extent (z 0) to which such energy-band bendings extend into the material depends on the details of the space-charge layer and further assumptions (e.g., the Schottky approximation used in the “immobile ions” case). Therein, the Debye length (λ D) is a widely used order-of-magnitude estimate of the electrostatic screening length scale.
(a) Electronic energy band representation of a (i) pristine n-type semiconductor, along with the effect of (ii) oxidizing and (iii) reducing analytes, leading to the formation of an EDL and EAL, respectively, along with the diagram of a (b) pristine p-type semiconductor forming a HAL and HDL, respectively. EDL: electron depletion layer; EAL: electron accumulation layer; HAL: hole accumulation layer; HDL: hole depletion layer; z 0: space-charge layer thickness. Note that, across the diagrams in (a) and (b), the energy axis has an identical scale, that is, with the same E vacuum reference and surface CB/VB edge energies (χ = constant). Equilibrium charge-carrier population assuming Boltzmann statistics is provided, explaining the distinct resistance variations of n- and p-type semiconductors. N C: effective density of states in the CB; N V: effective density of states in the VB; n b: bulk electron concentration; p b: bulk hole concentration; qV: electrostatic energy profile (Poisson’s equation). Effect of O2 adsorption on semiconductor’s energy band structure from the point of view of the (c) “ionosorption model” and (d) “VO model”. Therein, the occupation of surface Oβ α–-related acceptor and VO-related donor states is schematically illustrated.
Under the hypothesis that the sensing reaction proceeds without formation or consumption of any dipole-like adsorbates, the electron affinity (χ) remains constant, and the magnitude of E F-/Φ-shift exactly equals that of the upward or downward band bending potential.? Such an assumption, i.e., Δχ = 0, can certainly be debatable even in dry conditions, especially given that many typical reaction intermediates, such as carbonates from CO or hydrocarbons, and nitrates derived from NO* x , may be dipolar (i.e., not ionized donors or acceptors) and remain adsorbed on the surface during sensing.? Nevertheless, this simplification has proved particularly useful for elucidating the transducer function of semiconducting MO x , for instance, in rationalizing the generally higher sensitivity of n-type compared to p-type materials.? Given the above microscopic analogies between n- and p-MO x
- classes, the main distinction is in the phenomenological (i.e., electrophysical) output of surface-potential modulation, owed to distinct space-charge layer configurations.? Upward band bends yield higher and lower resistances for n-type (electron depletion) and p-type (hole accumulation) sensors, respectively; oppositely, downward band bends yield lower and higher resistances for n-type (electron accumulation) and p-type (hole depletion) sensors, respectively. With nanostructured particles of sufficiently small size (d), the resistance modulation of semiconductor films can be significant even when sensing extremely low analyte concentrations, largely owing to comparable d and λ_D_, meaning that the above modifications in charge-carrier population (i.e., depletion and accumulation) affect a large volume fraction of the material.
As illustrated in Figurea,b, such changes in charge-carrier concentrations occur at the surface (z = 0) as the result of E F-shifts relative to the relevant band edge, that is, the CB and VB edges for n- and p-type materials, respectively. In fact, for n-type MO* x , upward (CB-)bending locally increases the separation between E F and the CB edge, reducing CB-electron concentration in the space-charge layer (electron depletion layer, EDL, higher resistance). For p-type MO x *, instead, upward (VB-)bending locally decreases the separation between E F and the VB edge, increasing VB-hole concentration (hole accumulation layer, HAL, lower resistance). Opposite-wise occurs with downward bending, providing a microscopic explanation of phenomenological electrophysical measurements, substantiated by simple charge-carrier equilibrium populations in the hypothesis that Boltzmann statistics are valid (see charge-carrier statistics in Figurea,b). This assumption typically works in conditions far from the degenerate limit, which can be approached, for instance, by using SnO_2_-based materials to detect relatively high concentrations of H_2_ and/or CO in low-oxygen backgrounds.?
Advancing materials research for high-performing air-quality monitors requires bridging phenomenological sensor outputs with an atomistic-level view of the events occurring on the surface. Such insights are usually obtained from in situ X-ray absorption and photoemission spectroscopies,? which are now increasingly performed also under operando conditions. ?−? ? Traditionally, in the so-called “ionosorption model”,? chemoresponse generation in both n- and p-type MO* x
- has been attributed to the presence of extrinsic reactive oxygen species (O_β_ ^α–^), which adsorb from molecular O_2_ in the air onto a heated semiconductor (typically at 100–400 °C), filling surface acceptors and trapping electrons from the material until equilibration of the (decreasing) E F with the uppermost acceptor-level energy.? Therein, the analyte’s redox chemistry, dominant under oxygen-rich conditions onto heated catalysts, alters the extrinsic O_β_ ^α–^ population by either (i) consuming (iono-)sorbed oxygens (reducing analytes) or (ii) forming new ones (oxidizing analytes). However, direct experimental evidence for the involvement of O_β_ ^α–^ species is scarce,? and is complicated by an extremely low amount needed for E F equilibration (*<*10^–5^–10^–3^ monolayers, also known as Weisz limitation),? which renders their spectroscopic identification extremely challenging.
Consequently, recent studies have proposed alternative explanations for conductivity modulation that rely on intrinsic oxygen species - namely, lattice oxygen ions (O^2–^) of the solid itself. Such participation of intrinsic oxygen is on par with the broader heterogeneous catalysis literature, which highlights the mobility and reactivity of lattice O^2–^,? together with the critical role of oxygen vacancies (V_O_) in Mars-van Krevelen-type catalytic oxidations occurring on reducible oxides, like many common sensing materials (e.g., SnO_2_, WO_3_, Co_3_O_4_, etc.). Initially developed for n-type MO* x
- in the perspective by Blackman,? key to the latter “oxygen vacancy model” is the observation that the electrons localized in surface-V_O_ states are reasonably close to CBM (i.e., “shallow” V_O_ owed to the strong hybridized O(2p)–metal(d) character of low-lying CB states), and can be easily thermally ionized at sensor’s operating temperature.
Therein, modulation of surface-V_O_ population shifts E F analogously to the extrinsic “O_β_ ^α–^ model”, that is, V_O_-consumption and formation leads to upward and downward band bending, respectively, as experimentally supported by operando X-ray photoelectron spectroscopy (XPS) studies on (n-type) SnO_2_,? as well as in-plane Fermi surface mapping from angle-resolved photoemission spectroscopy (ARPES) on high-quality In_2_O_3_ single crystals.? The viability of such a novel “V_O_ model” for p-type materials has likewise been proposed,? with the main distinction being that surface-V_O_-related electron states are “deep” in the bandgap (i.e., close to VBM, owing to the strong O(2p)–metal(d) character of upper-VB states). Electrons in these deep V_O_ can recombine with VB holes, again leading to analogous E F-shifts upon exposure to oxidizing and reducing molecules.
The working principles of “O_β_ ^α–^ model” and “V_O_ model” are illustrated in the example of an n-type MO* x
- in Figurec,d. In the former model, the pristine surface (i.e., prior to O_2_(g) adsorption) is in a flat band condition, assuming no initial band bending (Section) and the absence of any M^δ+^ surface trap (Tamm states, Section): (iono-)sorption of oxygen introduces extrinsic species that bend the CB upward. In the “V_O_ model”, instead, inherent V_O_ states act as electron donors, resulting in a downward CB-bending according to the “surface conductivity” picture proposed by Blackman:? dissociative oxygen adsorption consumes some V_O_’s (forming an equivalent amount of O_lattice_ ^2–^, purple-shaded in Figured) reducing the population of donor states, and diminishing the magnitude of such CB-downward bending. For the sake of completeness, we also indicate the occupation of oxygen-related surface acceptor/donor states that directly pin the position of E F, affecting these space-charge layers. As mentioned above, the “V_O_ model” also works for p-type semiconductors,? the main difference being that surface V_O_ donors (green-shaded in Figured) are energetically closer to the VB edge, thereby directly coupling to the VB-hole density.
Building on this theoretical framework, we now turn to the question that has guided much of the recent literature: how can one enhance the sensitivity and selectivity of chemoresistive sensors? Almost by “default”, there are two widely adopted strategies: (1) the formation of heterojunctions and (2) the surface decoration of pristine MO* x
- with metal clusters (noble or non-noble in various oxidation states). These approaches can be broadly understood through two complementary mechanisms: electronic sensitization,? stemming from band alignment and space-charge redistribution at heterointerfaces, and chemical sensitization, ?,? which relies on catalytic promotion of surface reactions and charge exchange. While inseparable in practice, we discuss them individually for clarity, emphasizing experimental design principles that can help disentangle their respective roles.
MO
x Heterostructure Formation
3.1.2
As a thermodynamic requirement, when two semiconductors are brought into contact, any initial mismatch in their E F drives electron redistribution across the interface until E F becomes uniform throughout the entire solid.? With a common E vacuum reference, electrons flow from the semiconductor with a lower Φ (i.e., higher E F) to the one with a higher Φ (lower E F). Since the energy of all electronic states on both sides remains referenced to its initial alignment with E vacuum (i.e., assuming no change in χ) this leads to upward band bending on the side with lower initial Φ, and downward band bending on the side with higher initial Φ. The result is the formation of two space-charge regions at the interface, each characterized by its own width and band bending magnitude. This so-called initial band bending arises purely from contact-induced charge transfer, without involvement of any surface chemistry or gaseous species.
The implications for sensing are profound: (i) the built-in junction potential largely governs the resistance of heterostructured semiconductors,? providing a powerful means to modulate conductivity responses to air pollutants; and (ii) semiquantitative semiconductor calculations suggest that, in the presence of such initial band bending, a given modification of surface charge (Q S) produces a more pronounced change in electrical resistance.? Figurea,b schematically illustrate the formation of a CuO-SnO_2_ p–n junction, which, owing to the lower initial Φ of SnO_2_ relative to CuO, manifests as an electron-depletion layer on the SnO_2_ side and a hole-depletion layer on the CuO side. The report by Wang et al.? underscores these CuO-SnO_2_ heterostructures as highly effective CO sensors operating under mildly humid air (25% RH) and at room temperature, though exhibiting a pronounced response deterioration at higher humidity levels (up to 85% RH).
Improving the performance of MO x sensors by heterostructure formation. Energy-band schematics of a CuO-SnO2 heterointerface (a) before and (b) after EF equilibration, after p–n junction formation. Indicated are the CB (E c) and VB (E v) edges, E F, the electron affinities (χ), work functions (W s), band gaps (E g) and the thickness of the space-charge layers on either side of the p–n junction (W n: electron depletion; W p: hole depletion). Adapted with permission from ref . Copyright 2024 Elsevier. Equilibrium DFT-geometries of H2O and NO2 molecules adsorbed on (c) Ag2Te and (d) CeO2, along with their respective (e) adsorption energies (E ads). (f) Effect of humidity on the sensor response of a 1:2 (by mole ratio) Ag2Te/CeO2 structure to 1 ppm NO2 at 65 °C (left axis), as well as on its baseline resistance (right axis). Reproduced from ref . Copyright 2025 American Chemical Society. (g) Schematic of W18O49 nanorods grown onto WO3 nanosheets. The WO3/W18O49 interface controls the conductivity (and its modulation) of the heterostructure, as verified by (h) EIS measurements. Reproduced from ref . Copyright 2024 American Chemical Society. (i) TEM image of NaBH4-treated (i.e., B-doped) Co3O4 followed by mild calcination at 225 °C, resulting in the formation of crystalline domains embedded in an amorphous matrix. (j) These abundant and VO-rich, amorphous/crystalline interfaces lift the Co d-band center (εd) by ∼0.7 eV compared to purely crystalline B-doped Co3O4, leading to a lower barrier toward molecular O2 activation. Reproduced from ref . Copyright 2025 American Chemical Society.
The optimized CuO-SnO_2_ composition (Cu:Sn = 1:4) shows markedly improved response compared to pure SnO_2_ and CuO, with a 5–10-fold increase in sensor response and excellent response-recovery times of 56 and 23 s, respectively. Beyond minor contributions from textural effects (e.g., larger surface areas of the composite compared to pristine MO* x *), the authors associate enhanced responsiveness with more favorable CO-adsorption energetics onto the CuO side of the p–n junction. Therein, CO molecules interact primarily with surface Cu atoms: electrons are initially donated to the CuO side but quickly delocalize across the interface into SnO_2_, concurrently narrowing the hole- and electron-depletion widths (W p and W p). Both effects decrease the overall electrical resistance, yielding the observed n-type sensing behavior and superior performance of the composite material. This represents a typical case of electronic sensitization, also referred to as “Fermi-level control”,? often described in the literature as the E F of SnO_2_ being “pinned” to that of CuO, which “re-routes” the charge accumulated upon CO adsorption across the interface.
In many cases relevant to air-quality monitoring, heterostructuring nanoscaled oxides is an effective strategy to leverage materials with rich redox chemistry that nevertheless would not function properly as standalone MO* x
- sensors. A notable example is CeO_2_, a reducible n-type oxide with exceptional lattice-oxygen activation properties,? making it a preferred catalyst for numerous selective oxidation reactions, aligning with the recent mechanistic perspectives emphasizing V_O_-mediated sensing (see the “V_O_ model”, Section). However, reports on pure CeO_2_ sensors are scarce, owing to its poor conductivity? and substantiated by its non-electronic conduction type (transport of lattice O^2–^ ions). Zhou et al.? fabricated Ag_2_Te/CeO_2_ nanostructures that featured impressively sensitive, selective, and humidity-robust NO* x
- sensing capabilities at only 65 °C, which the authors integrated into an Internet of Plants (IoP) greenhouse environmental monitoring platform. The heterointerface with Ag_2_Te, i.e., a narrower E g, n-type semiconductor with lower Φ compared to CeO_2_, yields a device with measurable conductivity even at low temperature, dominated by the more conductive Ag_2_Te. Thereby, the strong chemical activity of CeO_2_ toward NO* x
- molecules is exploited,? which affects the overall resistance only indirectly through subsequent electron redistribution across the interface.
Upon n-n junction formation, electrons are transferred from Ag_2_Te (lower Φ) to CeO_2_ leading to an electron depletion layer on the telluride side (upward bend) and an electron accumulation layer on the oxide side (downward bend). NO* x
- molecules bind preferentially to CeO_2_ (see also Figurec,d), and form surface acceptor states which further increase its Φ, driving additional electrons from the telluride into the ceria. In contrast to the CuO-SnO_2_ state-of-the-art CO sensors discussed above,? this electron redistribution increases the space-charge widths, thereby enlarging the dominant electron-depletion layer on the Ag_2_Te-side and producing a significant response. This heterostructuring approach proves particularly powerful, as CeO_2_ not only preferentially binds NO* x
- molecules but also interacts strongly with H_2_O (Figuree), which is ubiquitous in agricultural environments and a common cause of performance deterioration at high humidity. However, because the device resistance is dominated by the Ag_2_Te component (Figuref), the baseline remains highly robust against H_2_O interference, and the NO_2_ response is preserved even up to 99% RH. Several heterostructures between MO* x
- and reduced graphene oxide (rGO) have also been proposed, wherein the bifunctional rGO-MO* x
- interface similarly fosters device-level performance for air pollutant detection.?
In many cases presented in Table, system-level enhancements in sensing performance arise from the as-formed Schottky contact, which contributes significantly to the overall device resistance. Although this is a sensible assumption in most MO* x
- heterostructures of interest for toxic gas detection, direct experimental evidence, typically obtained from electrochemical impedance spectroscopy (EIS)is usually lacking. In a recent report, Zheng et al.,? showed that the charge-transfer resistance (R ct) of optimized branched WO_3_/W_18_O_49_ heterostructures (Figureg) is substantially lower than that of pristine WO_3_, suggesting a dominant role of the interface between W_18_O_49_ nanorods and WO_3_ nanosheets, as revealed by analysis of the EIS-derived Nyquist plots shown in Figureh.
The authors deployed such WO_3_/W_18_O_49_ for NO_2_ detection, achieving exceptionally sensitive, selective, and low-temperature (50 °C) sensing performance. The response was attributed to NO_2_ oxidation by ionosorbed O_2_ ^–^, forming adsorbed nitrates (NO_3_ ^–^) as identified by ex situ N 1s XPS on NO_2_-exposed WO_3_/W_18_O_49_. This process relies on low-lying (i.e., free) CB electrons supplied by the electron accumulation layer on the W_18_O_49_ side of the n-n junction, wherein pristine W_18_O_49_ has a much higher Φ with respect to stoichiometric WO_3_. Similar to the Ag_2_Te/CeO_2_ system discussed in Figurec–f,? the local E F-downshift on the W_18_O_49_ side drives additional electron withdrawal from the WO_3_ side, further widening both the electron-depletion and -accumulation regions. Because electron-depletion layers exhibit a stronger CB-bending dependence of conductivity than electron-accumulation layersa key principle of operando Φ analysis summarized by Barsan et al.?the overall resistance increases yielding the n-type behavior of WO_3_/W_18_O_49_.
An insightful outcome of heterostructure formation is the opportunity for electronic structure engineering of active metal centers. In particular, for transition metal oxides (TMOs) containing cations with partially filled d orbitals, theoretical arguments formulated by Nørskov and co-workers? identify the position of the d-band center (ε_d_) relative to E F as a key descriptor governing adsorbate energetics and catalytic trends. Zhao et al.? fabricated B-doped Co_3_O_4_ sensors via NaBH_4_ treatment followed by low-temperature (225 °C) calcination, achieving exceptional sensitivity and selectivity toward acetone at 190 °C, with a detection limit as low as 20 ppb.
Comprehensive structural and spectroscopic analyses revealed that the resulting B-doped Co_3_O_4_ nanoparticles contain several crystalline domains embedded in an amorphous matrix (Figurej), characterized by abundant Co^2+^-like species and accompanying V_O_ formation. These features endow the crystalline–amorphous interfaces with a high density of Co sites in tetrahedral (T _ d ) coordination. As shown by DFT calculations and schematically illustrated in Figurej, ε_d is upshifted by approximately 0.7 eV, approaching E F. This has a 2-fold effect: (i) it lowers the energy barrier toward O_2_ activation through enhanced d−π* interaction, and (ii) it facilitates acetone adsorption and activation, resulting in a much stronger binding (E ads = −3.16 eV) compared to purely crystalline, interface-free B-doped Co_3_O_4_ (E ads = −1.83 eV).
Tuning the surface of MO
x sensors
3.1.3
Another broadly applicable strategy to enhance the response of semiconducting MO* x *, regardless of composition or conduction type, is surface decoration with catalytically active clusters.? Such secondary phases can profoundly modify surface chemistry either by (i) promoting oxygen activation (increasing, for instance, the concentration of O_β_ ^α–^ or lattice-oxygen lability, according to the “O_β_ ^α–^ model” vs “V_O_ model”, see Section), or by (ii) strengthening the binding and activation of analyte molecules. In practice, both contribute to what is often referred to as chemical sensitization mechanisms.? When the added component exists as a distinct phase, interfacial equilibration of E F and related initial band-bending effects are expected whenever electronic communication across the interface is established. These junction-like interactions coexist with catalytic promotion effects, making it experimentally challenging to disentangle purely chemical from electronic sensitization. To this end, adopting more systematic methodologies from heterogeneous catalysis, such as correlating active-site structure and reaction kinetics (product analysis, activation energies, and reaction orders), could help to bridge the gap between surface chemistry and macroscopic sensor outputs.
As schematically illustrated in Figurea, chemical sensitization through enhanced formation of O_β_ ^α–^ species proceeds via a classical “spillover” mechanism.? A representative example is Au-black clusters supported on n-type Ga_2_O_3_,? which exemplifies the cooperative action of both E F-control and catalytic promotion in toxic-gas detection. Upon formation of the metal–semiconductor (Schottky) junction, the higher Φ of Au-black drives electron transfer from Ga_2_O_3_ to the metal, generating an initial electron depletion layer in the oxide. During O_2_ exposure, electrons originating from the Ga_2_O_3_’s CB are captured into oxygen-related acceptor states at the Au surface, until electrostatic equilibrium across the Schottky interface is re-established, thereby increasing the local population of activated O_β_ ^α–^. These subsequently migrate, or “spill over”, onto the Ga_2_O_3_ surface, where their consumption by analyte molecules induces pronounced modulations of the surface potential and electrical resistance of the supporting oxide.
(a) Oβ α– formation mechanism in surface-decorated MO x via the spillover mechanism. The higher work function of Au-black NPs drives electrons from Ga2O3, which are available to fill oxygen-related surface acceptor states. The as-formed Oβ α– may spill over to the Ga2O3 increasing overall oxygen adsorption capabilities and, therefore, sensor signals. Reproduced from ref . Copyright 2023 American Chemical Society. (b) O2-TPD of pure ZnO and 8 wt % single-atom (SA) Sn-loaded ZnO, showcasing the Oβ α– activation mechanism by the spillover effect. Adapted with permission from ref . Copyright 2025 Wiley. (c) From bulk supported nanoparticles (NPs) to single-site surfaces, showing the evolution from continuous band structure to discrete molecular orbitals. Reproduced from ref . Available under a CC-BY 4.0 license. Copyright 2020 The authors. (d) Sn-K EXAFS of (Zn-doped-)SnO2 to confirm SA speciation. Adapted with permission from ref . Copyright 2025 Wiley. Optimizing the composition of (e) PtCu clusters on In2O3 and (f) CuOx clusters on Co3O4 for formaldehyde sensing at low temperatures (<100 °C). The process is rather tedious, motivating systematic studies to bridge (g) active-site structure/speciation with catalytic and sensor performance. Reproduced from ref . Copyright 2025 American Chemical Society and Reproduced from ref . Available under a CC-BY 4.0 license. Copyright 2023 The authors. (h) Schematic of NH3 sensing reaction on the surface of pristine SnO2 and Pt2Ru3-decorated (noble-metal content of 0.5% mole fraction). Note that surface decoration shifts product distribution, largely preventing overoxidation to N2O, as also suggested by resistance measurements in (i) O2/N2 and (j) NH3/air, featuring similar fitting exponents in the power-law correlation. Reproduced from ref . Copyright 2024 American Chemical Society.
More abundant active O_β_ ^α–^ species are a key hallmark of chemical sensitization, and often probed indirectly through thermochemical methods such as temperature-programmed desorption of O_2_ (O_2_-TPD), as first shown in the seminal work of Yamazoe et al.? Figureb compares the O_2_-TPD profiles of pure ZnO and 8 wt % Sn/ZnO nanoparticles,? where the authors attributed the apparent O_β_ ^α–^ enhancement to a higher O_2_-desorption signal in selected temperature intervals. However, the assignment of these temperature ranges remains largely empirical, and, most importantly, chemisorption-based methods such as O_2_-TPD are inherently nonspecific: they quantify the total oxygen released from a MO* x
- surface rather than the population of truly ionized oxygen acceptors. In principle, the desorbed oxygen signal overwhelmingly reflects neutral chemisorbed species, owing to the fraction of O_β_ ^α–^, i.e., those effectively involved in band bending, being vanishingly small as constrained by surface electrostatics considerations discussed in Section (∼ 10^–5^–10^–3^ monolayers according to Weisz limitation).
In the search for new design motifs in chemoresistive sensing, tuning the dispersion state of catalytically active metals has emerged as a powerful strategy.? In particular, single-atom (SA) catalysts? have recently been explored as surface modifiers for MO* x
- sensors, where the added element is dispersed as isolated atoms anchored onto the oxide lattice. Each SA site coordinates exclusively to lattice oxygen and neighboring cations of the support, achieving nearly 100% metal-atom utilization? and thereby maximizing catalytic efficiency. This enhances molecular activation and turnover, amplifying the overall sensor response through the “catalytic effect”.
Furthermore, SA catalysts (SACs) exhibit distinct and often nonlinear reaction energetics compared with larger clusters, reflecting their discrete orbital interactions and tunable local coordination environments.? SA-decorated sensors also represent a regime where the distinction between electronic and chemical sensitization becomes increasingly blurred: SAs are direct mediators of analyte adsorption and reaction, yet they modulate the semiconductor’s E F differently from the extended initial band bending of heterostructures. As schematically illustrated in Figurec, the surface atomic site has discrete electronic structures compared with the continuous band structures found in clusters.? Lacking an intrinsic band structure and a continuous interface, SAs cannot sustain a classical space-charge region; instead, they accept or donate charge through localized SA-ligand states, forming Tamm levels that induce nanoscale perturbations in the electronic structure of the supporting oxide.? For instance, in the example of CuO–CeO_2_,? the supporting cation, Ce^4+^, can withdraw electrons from Cu to reduce its ε_d_, which increases the electrophilicity of Cu species. The electron donation from Cu(3d) to hybridized O(2p)–Ce(4f) increases the difference between the highest occupied molecular orbital (HOMO) and the lowest unoccupied molecular orbital (LUMO) of Cu, reaching the maximum splitting at the single-site, free-atom-like limit. This concept is directly applicable to other systems, including single Cu atoms in AgCu single atom alloys (SAAs),? and TiO_2_-supported Cu SACs.?
Such SA-systems require thorough assessment of SA electronic and geometric speciation, ?,? typically achieved by metal L- and/or K-edge X-ray absorption near-edge structure (XANES) and extended X-ray absorption fine structure (EXAFS) spectroscopies, as illustrated for SA-Sn/ZnO? with Sn-K EXAFS in Figured. The authors attributed superior acetone-sensing capabilities (with a 10-ppm-response > 200, and a lower limit of detection below 1 ppb) to the “catalytic effect” of Sn SAs, which lower DFT-E ads compared to pristine ZnO. As discussed above, an additional contribution from electronic sensitization cannot be ruled out, likely arising from hybridized Sn-O bonds that localize electrons in Tamm states within or just below the CB of ZnO.
Screening diverse material compositions for chemoresistor optimization remains a tedious yet routine task for sensor researchers. This is illustrated in Figuree,f for low-temperature (<100 °C) formaldehyde detection using several wt% of bimetallic PtCu on In_2_O_3_ ? and 0–20 wt % CuO_x_ clusters on Co_3_O_4_,? respectively. To extract useful design principles from such studies toward predictive engineering of chemoresistive materials, it is highly desirable to combine electrical measurements with spectroscopic insight into the active-site structure, obtained, for instance, from (in situ) XAS or IR spectroscopy. Coupling these data with oxidation kinetic analysis enables rationalization of sensor behavior and bridges catalyst structure, surface chemistry, and device-level performance, i.e., structure–activity relationships, potentially guiding chemoresistive design across related MO* x
- families and compositions. In the example of CuO_x_–Co_3_O_4_ shown in Figureg, a good degree rank-correlation (Spearman’s) was found between the relative surface Cu^+^ amount (i.e., active site structure, obtained from IR of adsorbed CO) and both of the following: (i) oxidation kinetics (lower E a for formaldehyde conversion), as well as (ii) formaldehyde chemoresponsive signal, serving as catalytic and sensing activity descriptors, respectively.
Product analysis, on par with reaction kinetics, provides valuable insight into the promotional effects of surface-decorative motifs. In a recent study, Wu et al.? reported an NH_3_ sensor based on SnO_2_-supported bimetallic PtRu nanoparticles, discussing both the electronic sensitization that depletes electrons from the SnO_2_ side near the interface and the chemical effect of noble-metal decorationthe latter identified as dominant. By online FTIR analysis of the reaction products, the bimetallic PtRu sites were shown to suppress N_2_O formation (prevailing for Pt-only decoration) and promote selective oxidation to N_2_, as schematically depicted in Figureh.
The synergistic function of Pt and Ru in steering NH_3_ oxidation toward N_2_ is therefore key to enhanced sensing performance. In situ-generated N_2_O species can act as surface acceptors, which are neutralized by injected electrons upon NH_3_ exposure. The concurrent presence of oxidizing (N_2_O) and reducing (NH_3_) adsorbates leads to a “competition” between donor and acceptor states, as these have opposite effects on the surface charge balance. Thereby, the resistance modulation is partially compensated, which reduces the overall sensor response, as further supported by resistance measurements in the O_2_/N_2_ and NH_3_/air mixtures shown in Figurei,j, respectively. Similar regression coefficients (values of k) of the resultant lines in the log–log plots, that is, the values of the exponents in a power-law relation,? suggest that PtRu species convert NH_3_ to N_2_ without overoxidation to N_2_O.
Transition Metal Dichalcogenides (TMDs), Nitrides,
and Halide-Based Sensors
3.2
Beyond the MO* x
- sensors reviewed in Section, many material classes have emerged for air pollutant detection. Transition metal dichalcogenides (TMDs) consist of a combination of transition metals (M) and chalcogen elements (X = S, Se, or Te) in a 1:2 stoichiometric ratio, forming compounds with the general formula MX_2_.? Their two-dimensional (2D) layered structuressimilar to MXenescombined with high carrier mobility, large specific surface area, and rich active sites, make them highly promising candidates for high-performance chemoresistive sensing.?
Other materials that have attracted considerable attention are transition metal nitrides (TMNs) and halides (TMHs). TMNs show great potential for sensing applications due to their high chemical stability and electrical conductivity.? Several binary M_x_Ns have been explored for chemoresistive sensing, including GaN, InN, AlN, and different combinations of ternary A_x_M_1‑x_Ns with A, M = In,Ga, and Al.? Transition metal halides (TMHs) include simple metal halides (MH_x_) and metal halide perovskites (MHPs), which feature distinct chemical and physical properties, endowing them with tunable E g and optoelectronic characteristics. ?,? TMHs also demonstrate exceptional stability under harsh environments, including elevated temperatures and high humidity, especially when integrated into heterojunctions or functionalized with noble metals such as Pd or Pt immobilized on their surfaces, ?−? ? similarly to MO* x
- as discussed in Sections and 3.1.3, respectively.
NO* x
- emissions are the use case of choice for such structures. Zhao et al.? reported the synthesis of binary titanium nitride (TiN_x_) nanoparticles via ammonolysis of the MOF precursor MIL-125. The resulting TiN_x_ nanoparticles were employed as highly selective sensors for NO_2_ detection, even in the presence of potent interfering gases such as NO (selectivity = 30). The experimental and theoretical LLODs were 50 and 2.4 ppb, respectively, satisfying the requirements set by the exposure limits (Table), attributed to TiN_x_’s high specific surface area and abundant nitrogen vacancies (V_N_) introduced through the MOF template that highlights the criticality of point defects when metal centers are in a crystallographic arrangement of N^3–^ ligands, similarly to the role of V_O_ in MvK-type oxidation over MO* x *-based chemoresistors. The analogy is substantiated by the electronic effect of surface V_N_ that can be thermally ionized under sensor operation, thereby acting as electron donor states directly coupled to the M_x_N’s electronic band structure (see the “V_O_ model” in Section).
A series of highly open-structured (porosity ≥ 84%) TMN films was fabricated by Baut et al.? via FSP synthesis of the parent MO* x * , followed by its nitridation in NH_3_ at high temperatures. Their dry synthesis–conversion strategy can be flexibly applied to produce porous nitrides of various metals, “on-demand”, as exemplarily shown with Cu_3_N, W_2_N, MoN_x_, TiN, and even TMHs (bromination in HBr) and TMDs (sulfidation in H_2_S), such as CuBr.? and WS_2_ ? for NH_3_ and NO_2_ detection, respectively. Cu_3_N also exhibited remarkable sensing performance toward NO_2_ (1 ppm) operating at a low temperature of 75 °C in 50% RH air, selectively over critical gases (e.g., xylene, toluene, benzene, H_2_, acetone, ethanol, NH_3_, and H_2_S), with, however, modest interference from NO (SI = 3.6). The experimental and theoretical LLODs were 50 and 0.1 ppb, respectively. Further TMH- and TMD-based studies reported NO_2_ sensors, including, for instance, C–MoS_2_ ? that exhibited a significant response (>20) at room temperature, albeit for an exceedingly high 10 ppm NO_2_ (see Table for maximum allowed concentrations), and Nb-doped MoS_2_ ? with a theoretical LLOD below 0.5 ppb.
DFT calculations are increasingly leveraged to bridge sensing mechanisms with theoretical insights. Figurea–c shows the selectivity and DFT-equilibrated structures for bismuth oxyselenide (Bi_2_O_2_Se), which belongs to the oxychalcogenide class (M_2_O_2_X). Although Bi_2_O_2_Se is not a classical TMD (MX_2_), it shares some similarities, particularly in its layered structure and electronic properties.? Bi_2_O_2_Se featured the highest response to SO_2_ over (NO, NO_2_, Cl_2_, H_2_, CH_4_, NH_3_, CO, and CO_2_), as shown in Figurea, and a LLOD of 20 ppb that is 100 times lower than the recommended threshold of 2000 ppb (Table). This was attributed to favorable binding to the Bi_2_O_2_Se surface (E ads = −0.76 eV) of SO_2_ on Bi_2_O_2_Se surfaces, compared to other interfering gases such as H_2_ (−0.34 eV), NH_3_ (−0.22 eV), and CH_4_ (−0.21 eV) as illustrated in Figureb. In addition, a significant electron transfer (Bader charge calculation) of 2.205|e| occurred from the sensor material to SO_2_, on par with the SO_2_-electron withdrawal effect (surface acceptor) and indicative of enhanced adsorption (O-end, Figurec) onto surface Se lattice sites of Bi_2_O_2_Se.
Sensing performance and DFT simulation results of recent works from the past five years that report state-of-the-art sensor materials based on TMDs, TMNs, and TMHs (a) Selectivity analysis of Bi2O2Se sensor to SO2 (1 ppm) and interfering gases such as NO (1 ppm), NO2 (1 ppm), Cl2 (1 ppm), H2 (20 ppm), CH4 (20 ppm), NH3 (20 ppm), CO (20 ppm), and CO2 (20 ppm). (b) The adsorption energy of Bi2O2Se to SO2, H2, NH3, and CH4. (c) The charge density difference and Bader charge of SO2 on the Bi2Se2O adsorption surface. Reproduced from ref . Copyright 2025 American Chemical Society. (d) Enlarged XRD diffraction patterns of the main peaks of SnSe x varying the volume of 1-DDT (0 to 1200 mL). (e) Gas sensing performance of SnSe x with varying volumes of 1-DDT to NO2 (5 ppm). (f) Charge density difference and electron localization function results for NO2 adsorption on SnSe, SnSe2, and SnSe2 with Se vacancy. Reproduced from ref . Copyright 2025 American Chemical Society. (g) Responses of the CsPbBr3 perovskite-based sensor to H2S, NO2, SF6, H2, CO, and C2H4 (5 ppm). (h) Optimization model for the direct adsorption of H2S on the CsPbBr3 sensor; (i) FTIR spectra of the Pb–S bonding between CsPbBr3 and H2S. (j) Humidity robustness analysis based on the response of the CsPbBr3 sensor under different relative humidity conditions (0–80% RH) to a 5 ppm H2S concentration. Reproduced from ref . Copyright 2025 American Chemical Society.
These materials further offer interesting opportunities for phase engineering and investigation of synthesis-phase/structure–activity relationships for air pollutant detection, as notably reported for SnSe* x
- by Hwa et al.? In their work, different SnSe* x
- phases were fabricated via a hydrothermal method incorporating different volumes (0–1200 mL) of 1-dodecanethiol (1-DDT). Figured shows the XRD patterns of the resulting chalcogenides, showing a gradual evolution from a pure orthorhombic SnSe in the absence of 1-DDT (S-0) to a pure hexagonal SnSe_2_ at sufficiently high 1-DDT content (S-1200), through the formation of mixed SnSe* x
- under intermediate conditions. Regarding sensing performance, the pure hexagonal SnSe_2_ phase exhibits remarkable behavior for NO_2_ detection at room temperature compared to the orthorhombic SnSe and the mixed SnSe* x
- phases, as shown in Figuree. Specifically, SnSe_2_ demonstrates an outstanding limit of detection of 105 ppt (∼2000 times lower than the recommended long-term limit of 200 ppb) and high selectivity against interferants such as H_2_S, SO_2_, NH_3_, acetone, and H_2_ with SI values of 42, 102, 108, 163, and 186, respectively that was attributed to stronger NO_2_ binding on surface Se vacancies (V_Se_) of SnSe_2_ compared to SnSe (Figuref), further reinforcing the defect-chemistry view of chemoresponse generation (i.e., “vacancy model” as discussed previously for V_O_ and V_N_), because the electron(s) at the neutral V_Se_ sites may relax to empty states in the upper-VB (i.e., hole recombination in p-type SnSe* x *).
An exemplary perovskite TMH is shown in Figureg–j,? wherein the CsPbBr_3_ sensor exhibits outstanding sensitivity and selectivity for detecting H_2_S at room temperature (25 °C). Moreover, the sensor achieves an experimental LLOD below 200 ppb (∼25 times lower than the recommended short-term limit of 5 ppm, Table) and remarkable humidity robustness between 0–80% RH (Figureh), attributed to more favorable E ads of H_2_S compared to H_2_O, which is critical for the application where RH interference is ubiquitous. DFT calculations showed that S-H bond activation was facilitated by S-end adsorption onto Pb sites, resulting in partial oxidation of H_2_S to SO_2_ (Figurei), as confirmed by the Pb-S stretches at 835 cm^–1^ during in situ IR (Figurej).
MXene-Based Sensors
3.3
MXenes are a class of two-dimensional (2D) transition metal carbides and nitrides with the general formula M_ n+1_AX* n *. ?,? They are derived from MAX phases and are typically synthesized via selective etching methods, producing surfaces with rich chemical diversity and high hydrophilicity owed to several functional groups such as −OH, −O, and −F.? Combined with their large specific surface area and high electronic conductivity, optical, plasmonic, and thermoelectric properties.? MXenes exhibit greater electron mobility, a high density of active sites, and a stronger ability to absorb many toxic air pollutants than most other 2D or conventional materials. ?,?−? ?
Despite their rich physicochemical properties, pristine MXenes exhibit limited sensing performance, mainly due to their tendency to self-assemble into stacked nanosheets which reduces the available adsorption sites and the effective electron-transfer ratio of MXene chemoresistive films.? Therefore, MXenes are usually combined with various classes of sensing materials, such as graphene, SMOs, metals, polymers, TMDs, etc., to develop new MXene-based composites capable of enhancing sensing performance, similarly to, for instance, MO* x
- heterojunctions with chalcogenides (e.g., Ag_2_Te/CeO_2_)? discussed in Section. Over the past five years, most MXene-based composites have comprised MO* x . Notable examples are In_2_O_3_/Ti_3_C_2_T x
? that detected methanol down to 5 ppm with fast response/recovery times of 6.5/3.5 s, respectively, and SrFeO_3_/Ti_3_C_2_T* x * ? with an acetone LLOD below 250 ppb, both operated at room temperature.
In general, Figure provides an overview of some characterizations, E ads, and sensing performances of selected MXene-based composite materials. A promising sensor for carbon monoxide (CO) detection is the NiCo_2_O_4_/Ti_3_C_2_ composite, which combines spinel-type metal oxide nickel cobalite with MXene. Figurea shows the DFT-derived E ads of CO calculated for Ti_3_C_2_O_2_ MXene (−0.149 eV), NiCo_2_O_4_ (−0.226 eV), and the NiCo_2_O_4_/Ti_3_C_2_O_2_ MXene heterostructure (−0.399 eV), also reflected by the higher sensor response of the composite (Figureb). In addition, the NiCo_2_O_4_/Ti_3_C_2_O_2_ MXene composite exhibits a LLOD of 10 ppm (Figureb), fulfilling permissible exposure limits and demonstrating high CO selectivity compared to other common interferants (Figurec).
MXene-based composite sensors exhibiting the highest selectivity and lowest LOD values reported in the literature over the past five years. (a) DFT-E ads of Ti3C2O2 MXene, NiCo2O4, and NiCo2O4/Ti3C2O2 MXene to carbon monoxide (CO). (b) Sensor response of NiCo2O4 and NiCo2O4/Ti3C2-5 wt % sensors upon exposure to 10–1000 ppm CO. (c) Selectivity of the NiCo2O4/Ti3C2-5 wt % sensor toward CO detection in the presence of various interfering gases. Reproduced from ref . Copyright 2025 American Chemical Society. (d) SEM, TEM, and corresponding EDX mapping images of Fe2O3/Ti3C2. (e) Transient response of the Fe2O3/Ti3C2 sensor to various H2S concentrations (10 ppb–500 ppm). (f) Selectivity of the Fe2O3/Ti3C2 sensor toward different interfering gases: (1) H2S, (2) NH3, (3) methanol, (4) acetone, (5) ethanol, (6) benzene, (7) CO, (8) NO2, (9) CH4, and (10) formaldehyde. Reproduced from ref . Copyright 2024 American Chemical Society. (g) SEM, TEM, and HRTEM analysis showing the surface morphology of MXene/V2O5/Ag nanosheets. (h) Sensor response of the MXene/V2O5/Ag sensor toward various NH3 concentrations (0.5–10 ppm). (i) Selectivity and sensitivity of the MXene/V2O5/Ag sensor toward different interfering gases. Reproduced from ref . Copyright 2025 American Chemical Society.
Figured shows the morphology of a Fe_2_O_3_/Ti_3_C_2_ composite, where MXene stacked nanosheets are decorated with active Fe_2_O_3_ nanoparticles forming a uniform Fe_2_O_3_/Ti_3_C_2_ heterointerface. In transmission electron microscopy (TEM), the Ti_3_C_2_ surface exhibited numerous smaller, darker regions, suggesting the formation of the Fe_2_O_3_/Ti_3_C_2_ composite, as confirmed by elemental mapping via energy dispersive X-ray (EDX) spectroscopy, which revealed a homogeneous distribution of C, O, F, and Fe. Figuree shows the transient response of the Fe_2_O_3_/Ti_3_C_2_ sensor when exposed to different H_2_S concentrations ranging between 0.01–500 ppm. As observed, the sensor exhibits an LLOD below 0.01 ppm, which is 500 times lower than the maximum permissible exposure limit of 5 ppm for H_2_S. Furthermore, the MXene-based composite demonstrates remarkable selectivity toward H_2_S even in the presence of high concentrations of interfering gases (Figuref), endowing the Fe_2_O_3_/Ti_3_C_2_ heterojunction with great potential for monitoring indoor and outdoor air quality.
Figureg shows the morphological characteristics of yet another heterojunction, MXene/V_2_O_5_/Ag (MVA-4), analyzed by SEM, TEM, and high-resolution TEM (HR-TEM). As observed, the MXene in the MVA-4 composite exhibits an open, accordion-like lamellar structure with nanosheet delamination. Vanadium oxide (V_2_O_5_) and silver (Ag) nanoparticles are uniformly dispersed within the interlayers and on the surface of the MXene nanosheets, showing a high dispersion and minimal agglomeration.
TEM analysis shows that the surface of MXene in MVA-4 is completely covered by irregular polygonal Ag nanoparticles (highlighted in blue) and elliptical V_2_O_5_ nanoparticles (highlighted in red), both uniformly distributed across the material’s surface. The HR-TEM features distinct lattice spacings corresponding to (101), (−111), and (111) planes of the crystallographic MXene, V_2_O_5_, and Ag structures, respectively, in agreement with XRD analysis. The MXene/V_2_O_5_/Ag heterostructure exhibits a high response of ∼20 to 10 ppm NH_3_ at room temperature, with a rapid response time of 8 s and LLOD below 0.5 ppm, ∼50 times lower than exposure regulationsalong with outstanding selectivity against critical gases (Figureh,i). We conclude that MXene-based materials, when combined with other material classes via heterointerface formation (Section) and/or surface functionalization (Section), hold great potential for the development of advanced gas sensors capable of efficiently detecting air pollutants.
MOF-Derived Sensors and Functionalized MOF-Based
Sensors
3.4
Metal–Organic Frameworks (MOFs) are materials with remarkable potential for gas sensing due to their physicochemical properties, including high porosity, a large specific surface area, 3D-ordered structures, and well-established morphology control, which facilitates the adsorption of gaseous molecules. ?−? ? ? Pristine MOFs are used as precursors for the synthesis of tunable gas sensors. Still, they can also be directly combined to produce functionalized composite sensors ?,? that enhance sensing performance due to the catalytic/filtering effects resulting from MOF incorporation.
The architecture control enabled by MOF-templating is a key factor in developing porous structures with a high surface area, which is crucial for gas-sensing applications. In these applications, the synthesis conditionse.g., pH, temperature, and solventare critical in determining the morphology.? Several MOFs have already been applied in the form of chemoresistive materials’ templating. MOF-5 is a well-known porous cubic precursor for ZnO fabrication, consisting of terephthalic acid as an organic linker and Zn_4_O clusters. ?,?−? ? In contrast, zeolitic-imidazolate frameworks (ZIFs) represent a subclass of MOFs that contain the imidazolate linkers forming metal-linker-metal structures with characteristic T _ d _ metal sites (e.g., Co, Zn, Cd, Cu, Fe). ?,? ZIF-67 and ZIF-8 are some examples of Co- and Zn-based MOFs that can be thermally decomposed to obtain Co_3_O_4_ and ZnO structures, respectively.
Over the past five years, the use of MOF-derived and functionalized MOF-based sensors has increased significantly. Zhen et al.? synthesized a Sn-based MOF decorated on TiO_2_ nanotube arrays (NTA), followed by calcination to form an active SnO_2_/SnMOF interface for formaldehyde detection. The authors reported that the SnMOF/SnO_2_@TiO_2_ (annealed at 200 °C) exhibited a high formaldehyde response at room temperature, with fast response/recovery times of 4 and 2.5 s, respectively, albeit to a very high concentration of 6000 ppb. They experimentally quantified down to 750 ppb, which is still ∼10 and ∼100 times higher than, for instance, the WHO guideline (Table) and the French recommendation.? The performance shown in Figurea,b was attributed to the mild sintering of SnO_2_ nanocrystals upon partial decomposition of the organic linkers, which improved electron transport while retaining the intended SnMOF structure, as confirmed by the homogeneous elemental EDX-map in Figurec.
MOF-Derived Sensors and Functionalized MOF-Based Sensors. (a) Response of SnMOF@TiO2 after calcination at 200 °C toward different formaldehyde concentrations. (b) Formaldehyde sensing performance comparison between the synthesized materials. (c) EDX mapping of SnMOF@TiO2 NTA. Reproduced from ref . Copyright 2023 American Chemical Society. Responses toward 2 ppm NH3, (d) selectivity of NH3/H2S, and (e) responses toward 2 ppm H2S of the synthesized cMOFs thin films using ZIF-8 layers fabricated at various shearing speeds. (f) Schematic representation of the MOF-on-cMOF thin films mechanisms toward H2S and NH3 detection. Reproduced from ref . Copyright 2025 American Chemical Society. (g) detection performance toward different CO concentrations and (h) responses for the selected interfering gases of the synthesized In2O3/Fe2O3-based sensors derived from MOFs. (i) SEM image of In/Fe Bi-MOF. (j) Isotherms of N2 and pore size distribution analysis of In2O3/Fe2O3-4. Reproduced from ref . Copyright 2023 American Chemical Society.
Park et al.? developed MOF-on-cMOF (conductive MOF) thin films using different MOFs and thicknesses controlled by the shearing speed, achieving a wide range of pore architectures that immediately resulted in tunable sensing performance. For instance, they could modify the MOF-on-cMOF response patterns toward NH_3_, H_2_S, and NO_2_ by varying the double-layer preparation using ZIF-8, MIL-53(Al)-TDC, MIL-53(Fe), and MFM-300(Al). Most importantly, the previous approach is very flexible in that the cMOFs’ properties can be modified by choosing MOFs with ad hoc pore architecture, gas affinity, metal center, etc, as early demonstrated in Figured,e and conceptually illustrated in Figuref as a general concept toward more efficient MOF-on-cMOF air pollutant monitors.
As an example for MOF-templating, Zhao et al.? fabricated a bimetallic organic framework-derived (In/Fe Bi-MOF) In_2_O_3_@Fe_2_O_3_ core@shell nanotubes for CO detection. As shown in Figureg,h, the sensor exhibited enhanced performance compared to pure In_2_O_3_, with an approximate 4-fold increase in response to 200 ppm of CO at 260 °C. Beyond the heterojunction effect (M_1_O* x /M_2_O y
- interface, as discussed in Section), this is also largely contributed to by improved textural properties, particularly the porous hollow structure, as commonly investigated by SEM (Figurei) and N_2_-physisorption (Figurej) methods. The latter features distinct isotherm types and hysteresis loops, where sorption branches can be appropriately combined with the Kelvin equation, adsorbate-layer thickness models, and pore-geometry assumption (most often cylindrical, i.e., Barret-Joyner-Halenda)? to infer pore size distributions.? Leveraging more sophisticated experimental protocol (e.g., differential hysteresis scanning) and nonlocal density functional theory (NLDFT) may further enable the determination of pore-network connectivity (i.e., amount of pyramidal, constricted, and occluded mesopores).? Alternatively, other adsorptives than N_2_ (at 77 K) are customarily used, to either achieve higher resolution in the mesopore range (Ar at 87 K),? or to probe the smaller mesopores and down to micropores range (Kr at 87 K),? owed to the quadrupolar moment of N_2_ that can interact with heterogeneous surfaces and compromise accurate mesopore-size discrimination.?
Carbon-Based Gas Sensors
3.5
Carbon-based materials, mainly in the form of reduced graphene oxide (rGO) interfaced with MO* x
- phases, have gained prominence in recent years, including in the detection of toxic air pollutants such as NO_2_, CO, H_2_S, and NH_3_. ?,? Besides rGO, MO* x *’s are also deployed along with carbon nanotubes (CNTs) of different wall thicknesses, i.e., single-walled CNTs (SWCNTs) and multiwalled CNTs (MWCNTs).? As shown in Figurea, Haldar et al.? developed an optimized 5 wt % rGO/CuO p-p heterojunction for enhanced low-temperature (25–70 °C) CO_2_ detection, which also displayed notable selectivity against interferants including NH_3_, ethanol, methane, CO, NO_2_, and H_2_S (Figureb). This was attributed to the initial Φ-mismatch between the rGO decoration and CuO, which drives electrons from the rGO side to the CuO side, forming a hole-accumulation and hole-depletion layer, respectively (Sections and 3.1.2). Therein, it is favorable for O_2_ to ionosorb onto the electron-enriched (p-)CuO side, that is, also the main sensor constituent (5 wt % rGO), to restore some of the initial surface hole population (drop in resistance), corroborated by Cu’s inherent oxygen affinity.? As shown in Figurec, the authors associate improved performance with the (junction-)built-in larger O_β_ ^α–^ concentration, which provides more interaction partners for CO_2_’s sensing reactionan oxidation to possibly adsorb CO_3(ads)_ ^2–^ speciesalthough in situ spectroscopy was not performed, manifesting as a phenomenological resistance increase.
(a) Responses at different operating temperatures to 400 ppm of CO2 and (b) Selectivity tests for various gases of the synthesized samples. (c) Scheme of the proposed mechanism for the detection of CO2 molecules using the CuO/rGO structure. Reproduced from ref . Available under a CC-BY 4.0 license. Copyright 2024 The authors. (d) NO2 responses in function of temperature of the synthesized In2O3-sheet, 0.25 wt % HGO/In2O3-sheet, 0.5 wt % HGO/In2O3-sheet, and 1.0 wt % HGO/In2O3-sheet materials. (e) Sensing performance of In2O3-sheet, 0.5 wt % GO/In2O3-sheet, and 0.5 wt % HGO/In2O3-sheet toward different NO2 concentrations. Adsorption simulations and electron localization functions of (f) GO/In2O3 and (g) HGO/In2O3, respectively. Reproduced from ref . Copyright 2024 American Chemical Society. (h) CO2 selectivity tests at 150 °C and (i) responses at different concentrations for the MWCNTs-ZnO sensor. (j) EDX elemental mapping of the MWCNTs-ZnO structure. Reproduced from ref . Available under a CC-BY 4.0 license. Copyright 2025 The authors.
Engineering carbon-based loading is an effective strategy to tune the directionality of electron flow in C/MO* x
- composites. For instance, p-type holey graphene oxide (HGO) exhibits a lower Φ (4.64 eV) than that of rGO (5.20 eV). Consequently, 0.5 wt % HGO/In_2_O_3_ ? forms a heterojunction in which electrons flow from n-type In_2_O_3_ (Φ = 4.53 eV) toward HGO, creating an electron-depletion region in In_2_O_3_ and a corresponding hole-depletion region in HGO, that is, an initial band bending configuration. As discussed in Section, NO_2_ adsorption and the resulting accumulation of negative surface charge (due to electron withdrawal from the In_2_O_3_ CB) further enhance the NO_2_ chemoresponsivity. The authors reported exceptionally high responses (>1800) at 60 °C for 1000 ppb NO_2_ (Figured) and achieved quantification down to guideline-relevant levels, e.g., a response > 4 at 10 ppb NO_2_ (Figuree).
The DFT analysis (Figuref,g) revealed that HGO loading optimizes the NO_2_ adsorption energetics (E ads = −0.504 eV vs −0.459 eV for GO), favoring stronger substrate–adsorbate charge transfer and tighter N-C bonding, as evident from the electron localization function (ELF) contours. Although rarely employed in the sensing literature, bond-contact analysisparticularly the integration of the crystal orbital Hamilton population (COHP) up to E F, yielding the integrated COHP (ICOHP)?is a valuable computational descriptor of total bond strength that enables the investigation of bond activation and formation mechanisms.? Aleksanyan et al.? fabricated a MWCNTs-functionalized ZnO that was additionally decorated with Pd catalytic nanoparticles for CO_2_ detection. The sensor was moderately robust to higher-concentration interferents (Figureh) and displayed the air-quality-relevant CO_2_ dynamic range (Figurei), which was attributed to the cofunctionalization with Pd and MWCNTs that were uniformly distributed on the nanostructured support (Figurej).
Polymer and Organic Material-Based Sensors
3.6
Conducting polymer and organic materials have gained increasing attention in recent years, mainly for gas sensing applications, including environmental monitoring and air quality assessment. ?,? Conducting polymers and organic-based nanostructured sensors can detect a wide range of species, including heavy metal ions, explosive materials, toxic gases such as CO, SO_2_, NO_2_, H_2_S, and NH_3_, as well VOCs, water pollutants, and othersmostly at room temperature. ?,? In this context, Figure and Table present some state-of-the-art gas sensors based on conducting polymers and organic materials developed over the past five years for the detection of toxic gases such as SO_2_ and NH_3_.
Conducting polymers and organic composite materials chemiresistive gas sensors exhibiting the best sensing performance reported in the literature over the past five years. (a) Sensitivity and Selectivity of BBTBSe and BBT sensors for H2S, NO2, SO2, CO, CO2, and NH3. (b) Scheme of interaction between BBTBSe and SO2 Molecules. (c) Dynamic response and transient behavior for BBTBSe and BBT sensors for SO2 in different concentrations (1–100 ppm). (d) Fitting linear relation between SO2 concentration (1–50 ppm) and the response of the BBTBSe sensor. Reproduced from ref . Copyright 2024 American Chemical Society. (e) Response and recovery curve of the BA/MXene/PANI aerogel fiber at the NH3 (100 ppm) at 20 °C. (Inset is a comparison graph of response/recovery time between the BA/PANI aerogel fiber, the BA/MXene/PANI-HCl aerogel fiber, and the BA/MXene/PANI aerogel fiber). (f) Selectivity of the BA/MXene/PANI sensor for NH3, ethanol, methanol, acetone, methanal, toluene, and sensitivity of a mix with all gases (the mixed gas is composed of 25 ppm of NH3 and 100 ppm of other toxic gases). (g) Sensing response of the BA/MXene/PANI at temperatures between 20–50 °C to detect NH3 (25 ppm). (h) Schematic sensing mechanism of MXene/PANI to detect NH3. Reproduced from ref . Copyright 2025 American Chemical Society (i) Response-recovery curve of P-BNT - Inset: Selectivity of P-BNT to NH3, TEA, EtOH, H2S, Toluene, SO2, NO2, Acetone, Avantin, and MeOH (40 ppm). (j) Organic gas sensing material with conventional building blocks based on B-N units. (k) Response-recovery curve of BN-H/P-BNT. (l) Selectivity analysis of the BN-H/P-BNT sensor to the same testing gases at 40 ppm and sensor response in different humidity conditions (0–100% RH). Reproduced from ref . Available under a CC BY 4.0 license. Copyright 2024 The authors.
The conducting polymer BBTBSe, which combines a thiazole-decorated conjugated polymer (BBT) with a benzo[2,1,3]selenadiazole ring (BSe), was utilized as a room-temperature sensor for detecting SO_2_ selectively, as shown in Figuresa–d.? Therein, the combination of BBT and BSe significantly enhanced the SO_2_ sensing performance (100 ppm) and exhibited a response value (199.4) that was 4.3 times higher than that of the BBT sensor (45.7). Moreover, the BBTBSe sensor demonstrated rapid response-recovery times of 60 and 70 s, respectively. The BBTBSe sensor exhibits selective detection of SO_2_ compared to other interfering toxic gases such as H_2_S (100 ppm), NO_2_ (100 ppm), CO (200 ppm), CO_2_ (500 ppm), and NH_3_ (500 ppm) (Figurea). The authors attributed improved sensitivity and selectivity toward SO_2_ to the higher number of N atoms in the aromatic rings of the BBTBSe structure compared to BBT (Figureb), resulting in enhanced delocalization of electron density from N to electron-deficient S during SO_2_ reception. As a result, electron density is withdrawn from neighboring C = N, which disrupts the π resonance of the conjugated polymer rings, producing an n-type response (electrical resistance increases) with rather fast response/recovery dynamics between 1–100 ppm SO_2_ at 25 °C as shown in Figurec. BBTBSe chemoresponsive signal is higher than BBT (11.3 vs 6.3 at 1 ppm of SO_2_), and exhibits an experimental and theoretical LLOD of 0.76 and 0.23 ppb, respectively (Figured), i.e., ∼9000 times lower than the guideline (2000 ppb).
PANI materials are considered promising sensing candidates due to their high electrical conductivity, good reversibility, ease of fabrication, low cost, and excellent environmental stability.? Figuree–h shows a BA/MXene/PANI aerogel fiber-based sensor for selective NH_3_ detection,? exhibiting an outstanding sensing performance with high responsiveness of 807% and fast response/recovery times of 24.1 s/2.2 s, respectively (Figuree), with a LLOD of 1 ppb that is 25000 times lower than exposure guidelines. In addition, the sensor demonstrates excellent selectivity toward NH_3_ against critical gases (Figuref), and advantageous robustness to higher concentration interferants and even in gas mixtures.
Increasing the temperature between 20–50 °C (Figureg), NH_3_ response decreases from 341% to 196%, attributed to lower NH_3_ adsorption on the semiconductor polymer composite at higher temperature. When the sensor is exposed to high-humidity conditions, it shows only a slight variation in response at 90% RH, associated with the dissociation of water molecules and fewer sites available for NH_3_ adsorption. The polymer is a mixed electronic-ionic semiconductor, and the reception mechanism behind NH_3_ detection at the MXene/PANI surface is based on the deprotonation and protonation of PANI during adsorption and desorption, respectively (Figureh). Upon NH_3_ exposure, protons are captured from PANI to form NH_4_ ^+^ ions, leading to a concurrent decrease in both hole- and H^+^-density. The change in E F yields measurable electrophysical signals that are amplified through the p–n heterointerface, with a built-in EDL and HDL on MXene (lower Φ) and PANI (higher Φ) sides, respectively.
Another conducting polymer is P-BNT, which is based on a novel π-conjugated poly(triarylboron–boron–nitride–phenylene) characterized by B–N bonds, fabricated by Wang et al.? (Figurei–l). It is one of many significant contributions to the field of organic solar cells? and high-performance to NH_3_ detection, similar to other conducting polymer materials reported in the literature.? This material exhibits an outstanding sensor response of 32’000 to 40 ppm NH_3_ that is 3000 times higher than the monomer BN-H (Figurei and j), along with exceptional selectivity (>5 × 10^3^) and a fast response time of 102 s, with, however, long recoveries due to strong analyte adsorption possibly limiting sensor’s reusability. This was overcome by combining small monomer BN-H with P-BNT (1:1) to produce a BN-H/P-BNT heterostructure. Despite having a lower NH_3_ sensitivity, the hybrid sensor exhibits much faster transients with response/recovery times of 65/25 s (Figurek) and preserved a very good selectivity (>100), with proven performance under fully H_2_O-saturated environments (Figurel) and a theoretical LLOD of 13 ppb. Therein, the authors suggested that the monomer BN-H induces interfacial effects that suppress strong acid–base interactions promoting NH_3_ oxidation, while enhancing the electronic properties of the sensing layer.?
From Chemoresistive Materials to Functional
Devices
4
The widespread use of air quality sensors in everyday applications is still limited, mainly because current devices lack sufficient selectivity to quantify trace pollutant concentrations in complex indoor or outdoor air that contain hundreds of potential interferants (e.g., >250 VOCs in typical indoor air?). Here, we highlight strategies to bridge the critical gap between (a) identifying promising sensing materials or chemistries (Section) and (b) turning them into devices that can operate reliably in real-world settings. Before doing so, we briefly review the engineering challenges of implementing semiconductor gas sensors in compact, low-power formats and how MEMS-type microhot-plate (MHP) technology makes their power consumption compatible with battery-operated and portable systems.
Sensing Substrates and Film Deposition
4.1
We give a general overview of how modern MHP gas sensors are built and the criticality of their mechanical and thermal design. In Figurea, a typical MHP is shown with a small silicon island suspended on a thin dielectric membrane obtained by etching. An embedded PMOS transistor serves as a heater and a polysilicon resistor acts as a temperature sensor for the control loop. A nanocrystalline semiconductor film on metallic (commonly Pt or Au) interdigitated electrodes (IDEs) serves as the sensing layer.? Thanks to the low thermal mass of the membrane and its suspension, the power needed to reach a few hundred degrees °C is in the order of some tens of mW, whereas the surrounding chip with its readout electronics remains unheated. Figureb shows the cross-section of such a MHP coated with a porous, flame-aerosol-deposited MO* x
- layer obtained by focused ion beam SEM.? Precise deposition of the sensing layer exclusively on the interdigitated electrode area is critical and has been accomplished by shadow masks or photoresist windows so that drop-casting, sputtering, or aerosol deposition only coat the IDE zone, and not the bond pads or cold support frame.
(a) Schematics of a MEMS-type MHP: a small silicon island on a thin dielectric membrane is heated by an integrated MOS transistor, as monitored by a polysilicon temperature sensor, and contacted by interdigitated electrodes that support a nanocrystalline semiconductor film. Reproduced from ref . Copyright 2006 American Chemical Society. (b) Cross-section SEM image of MHP-supported MO x film after cutting a square with a focused ion beam; the empty gap beneath the membrane provides strong thermal insulation, while careful mask-design and alignment ensure that the film covers the electrode area. Reproduced from ref . Available under a CC-BY 4.0 license. Copyright 2020 The authors. (c) Illustration of representative film-deposition techniques, including solution-based methods, physical vapor deposition, chemical vapor deposition, and aerosol-based routes. (d, e) Exemplary power-temperature characteristics and fast thermal transients achievable with suspended MHPs. Adapted with permission from ref . Copyright 2018 The authors. (f) Impact of film architecture (porous vs compact) on sensing performance. Reproduced from ref. Available under a CC-BY 4.0 license. Copyright 2020 The authors.
From a historical perspective, two types of MHP have been extensively studied. In so-called closed-type membrane MHPs, the thin diaphragm spans the entire cavity. According to finite element analysis calculations,? this design is mechanically robust and relatively easy to fabricate, at the expense of broad heat-induced dome-shaped deflection, significant mechanical stress at the clamped edges, and higher heat transfer into the substrate that leads to larger power consumption.? On the other hand, in a suspended-type membrane design, only a small central platform is left and held by narrow beams that strongly reduce heat transfer, yielding lower power consumption, and the hot zone is sharply confined to the sensing area. However, stress and bending induced by thermal deflection are concentrated in the beams, so careful engineering is required to avoid failure. Moving from closed to suspended membranes has been a key achievement in the microfabrication of gas sensors to reduce power consumption from hundreds to a few tens of mW at typical operational temperatures, while also keeping the embedded electronics for signal conditioning safely below their maximum operating temperatures.
A key step is the chemoresistive film preparation (Figurec), a demanding task especially in the small area of interdigitated electrodes of suspended-membrane MHPs. Therein, a reliable, consistent, reproducible preparation of the sensing layer is key and essential also for thicker ceramics-based chips used in “fundamental” sensor research with the aim to obtain mechanistic insights and further tailor materials design, as discussed throughout Section. Screen-and inkjet printing of suspensions containing semiconductive nanoparticles are robust and probably most established for the deposition of sensing films on MHPs. Thereby, the formulation of stable and functional suspensions is particularly challenging to avoid, for instance, in the case of inkjet printing, the formation of satellite droplets or splashing under operational conditions. ?,? Also frequently used are drop-casting of suspensions or sol–gels that can be confined to the interdigitated electrode area, but film uniformity can be compromised by the coffee-ring effect.? Sputtering and thermal or e-beam evaporation provide dense or only moderately porous thin films with excellent thickness control. Chemical vapor deposited films can be grown very conformally, also on complex MEMS topographies. Aerosol deposition allows direct deposition of very porous nanoparticle films by thermophoresis? or denser films by impaction? with variable film adhesion strength to the membrane.
As shown in Figured,e, a suspended-membrane MHP can reach 400 °C with less than 60 mW, and its temperature can be achieved within ms.? Such fast and efficient heating makes it easy to run temperature-cycling schemes, ?,? where the sensor is periodically heated and cooled to extract richer response patterns and to speed up gas adsorption and desorption. Furthermore, the film morphology can critically affect sensor performance. In a previous study, a dry bromination of an aerosol-deposited CuO film to CuBr yielded much higher porosity than wet-bromination (43 vs 78%).? As shown in Figuref, the highly porous CuBr sensor showed a larger and faster response to the air pollutant NH_3_ (Table) in humid air, attributed to its open structure facilitating fast mass transfer within the mesoporous film. As a result, deposition methods that promote porous or hierarchical architectures can boost performance; yet, their interplay with the mechanical and thermal constraints of MEMS MHPs remains only partially explored.
Toward Sensor Systems: Strategies to Enhance
the Selectivity
4.2
The critical challenge for semiconductor gas sensors remains their often insufficient chemical specificity, especially when analyzing real-world gas mixtures with many potential interferants. Once the MHP platform is in place, selectivity can be further enhanced by combining several, differently selective sensors to arrays (so-called electronic noses) ?,? that have, for instance, led to promising discrimination in wearable sensor devices. ?,? Processing their signals, in some cases with integrated ML–assisted methods,? enables enhanced selectivity? and/or simultaneous multitracer detection, ?,? concepts that have been reviewed recently elsewhere. ?,? Another simple but powerful approach is to precondition the gas mixture before it reaches the sensor. Filters before and overlayers on top of the sensing film alter the analyte matrix by exploiting (1) differences in physi/chemisorption strength or (2) chemical reactivity. In this section, we focus on sorption? and catalytic filters,? which have shown particular promise for turning laboratory sensor concepts into deployable devices.
In a sorption filter, a packed-bed of adsorbent particles (for example, Tenax TA, a hydrophobic polymer)? acts as a miniaturized gas chromatography (GC) column placed upstream of an otherwise nonspecific sensor. As shown in Figurea, in the simplest linear-chromatography description, and neglecting axial dispersion and mass transfer, the inverse analyte speed, dt/dz, scales with a combination of bed-void fraction (ε), analyte’s thermodynamic adsorption strength (H i), and the inverse interstitial velocity (u).? Consequently, not only the choice of sorbent but also filter-assembly parameters such as packing density, diameter, and length must be tuned to obtain the desired separation (Figureb)a design space that is, of course, well covered by high-performance GC manufacturers but still needs more attention in the context of low-cost sensor systems.
(a) Working principle of a sorption filter: a packed bed behaves like a miniaturized GC column and temporally separates analytes according to their different retention time (τR). (b) Schematic elution order for three VOCs with different τR. (c) Example separation of methanol (red), ethanol (blue), and acetone (green) on a hydrophobic sorption bed, where methanol elutes first. (d) The separated peaks are detected downstream by a single MO x sensor, which now reads a sequence of partially resolved transients rather than a single, mixed response. Reproduced from ref . Available under a CC-BY 4.0 license. Copyright 2019 The authors. (e) Device-level implementation of a Tenax TA sorption column integrated upstream of a VOC sensor for the selective quantification of methanol in the headspace of adulterated alcoholic beverages. Adapted with permission from ref . Copyright 2020 Nature. (f) Principle of catalytic filters, which precondition the gas matrix based on (g) differences in chemical reactivity over the catalyst surface. (h) Example: when a CoCu2O3 catalyst is operated at 170 °C at an appropriate space velocity, a broadly cross-sensitive SnO2 sensor becomes highly selective to benzene, even against chemically similar aromatic compounds at much higher concentrations. Reproduced from ref . Available under a CC-BY 4.0 license. Copyright 2024 The authors. (i) Concept of a catalytic overlayer directly on top of a chemoresistive sensor. Reproduced from ref . Available under a CC-BY 4.0 license. Copyright 2023 The authors. (j) Example implementation, where an Au-overlayered Co3O4 strongly enhances p-xylene (X) selectivity over ethanol (E), toluene (T), and benzene (B). Reproduced from ref . Copyright 2019 American Chemical Society.
In the example of Figurec, when feeding a methanol:ethanol:acetone mixture for a certain duration (GC pulse, τ_p_), their distinct retention times (τ_R_) allow the fairly nonselective MO* x
- sensor downstream to record a time-resolved fingerprint instead of a superimposed signal (Figured).? That way, the sensor system discriminates methanol within a chosen time window from interfering analytes, the simple working principle of a research-prototype hand-held adulterated liquor analyzer shown in Figuree.? There, a short Tenax TA column, a mini-pump, and a thin Pd/SnO_2_ film deposited on a suspended-membrane MHP together deliver exceptional methanol selectivity despite the presence of orders of magnitude higher concentrated ethanol background. This sensor system is capable of quantifying methanol in alcoholic distillates,? hand-sanitizers,? and exhaled breath for intoxication diagnostics.? Such concepts can be rapidly translated into commercial products? following interlaboratory validation according to ISO 5725.? By exploiting the degrees of freedom in the design space of such packed-bed sorption columns, performance can be flexibly altered to achieve sensor systems for other analytes including formaldehyde.?
Catalytic filters offer a very promising route to meet the stringent selectivity requirements of real-world gas sensing and to overcome some intrinsic limitations of sorption-based preseparation. In fact, in miniaturized sensor systems with sorption columns, strongly retained analytes elute only after long delay times; their peaks are broadened and flattened by axial dispersion (reducing sensitivity), and the measurement itself is inherently discontinuous because the sensor can only be read out during short elution windows. In contrast, catalytic filters discriminate species through oxidation kinetics over heated catalyst beds rather than τ_R_. As the gas matrix passes through the catalyst (Figuref), interferants and target molecules are, in principle, converted at (i) different rates and (ii) different products. For trace analytes in air, where O_2_ is present in excess, the surface reaction rate is well approximated as pseudo-first-order;? integrating the reaction rate along the residence time coordinate yields an exponentially decaying concentration profile. In some cases, target analytes may be only mildly reactive and pass through the catalyst almost unaffected (e.g., red line in Figureg), while unwanted interferants are converted to “sensor-inactive” species, such as CO_2_ (so-called oxidative filtering).? In other nuanced circumstances, the target analyte is reformed on the catalyst surface to more “sensor-active” species, while the interferants are still converted to inactive CO_2_ (so-called reforming enhancement).?
As illustrated in Figureh, a CoCu_2_O_3_ catalytic fixed-bed reactor operated at 170 °C strongly suppresses a broad range of VOCs yet leaves benzene intact, rendering a typical SnO_2_ sensor placed downstream as a selective benzene detector. In this configuration, benzene was quantified down to 15 ppb even in the presence of up to 5000 ppb of other VOCs, including chemically similar aromatics such as toluene and xylene.? Despite this excellent performance, packed-bed catalytic filters require their own resistive heaters, unless operated at room temperature,? which compromises power consumption and increases the complexity of system integration.
As schematically illustrated in Figurei, catalytic filters can also be implemented as a catalytic overlayer on top of the sensing film to yield more compact integration and to avoid additional heaters.? Gas molecules must diffuse through this reactive layer before reaching the sensing material, so the same oxidation kinetics apply but with an effective residence time set by diffusion and film pore size rather than by convective flow through a macroscopic packed bed. In many reported systems, however, the dominant mechanism remains unclear, largely because detailed catalytic characterization (e.g., conversion–selectivity measurements under realistic conditions) in such μm-thick overlayers is challenging. We see a clear opportunity for more systematic reaction studies to guide the design of overlayer architectures that deliberately shape individual sensor response patternsfor instance, tuning xylene selectivity as demonstrated in Figurej. Such overlayer-modified sensors also provide a more informative starting point for sensor array development, where multiple different overlayer structures have already been combined for air quality tasks such as selective detection and discrimination of aromatic VOCs.?
Conclusions
5
Air pollution driven by the release of hazardous volatiles from anthropogenic sources has become a global concern, threatening human health and our ecosystem. Air quality detectors are needed for emission control, but the research and development of suitable sensors has been a challenge due to their interdisciplinary nature at the cross-section of chemistry, physics, materials science, and engineering. Nevertheless, the scientific communities have made great advances in recent years across disciplines ranging from the development of new sensing concepts, materials, systems, and devices to achieve air pollutant detection under real-world conditions.
Our review has identified various chemoresistive material classes, ranging from metal oxides (MO* x *) to conducting polymers (Table), that are capable of approaching or even fulfilling present air pollutant exposure guidelines. Notably, a considerable number of these materials can detect gases such as NO_2_, NH_3_, CH_4_, H_2_S, acetone, and formaldehyde, some even at low operational temperatures and under realistic humidity conditions. Yet, the chemoresistive sensing of other critical pollutants, for instance, volatile halide compounds or organochlorines such as chloroform (CHCl_3_) and carbon tetrachloride (CCl_4_) as well as aromatic ethylbenzene and styrene, remains mostly unexplored and offers opportunities for further research. We therefore position this review as a framework to (i) identify under-investigated pollutant targets and (ii) evaluate emerging sensor concepts against best-in-class chemoresistive benchmarks in guideline-relevant concentration regimes.
Challenges and Future Outlook
6
From a sensor mechanistic perspective, a deeper investigation to obtain useful structure–activity correlations that can inform a predictive sensor design will be needed. Despite a large number of studies performing electronic structure and energy calculations to obtain, for instance, adsorption energies and/or net charge transfer, experimental validation is frequently missing, for instance, by X-ray-based spectroscopic techniques. Even fewer cases, albeit with some notable exceptions, ?−? ? perform such material and surface characterization under in situ and operando conditions. This could be explored in future work combining standard catalytic characterizations such as temperature-programmed chemisorption and comprehensive reaction analysis, elucidating both the catalyst kinetics (turnover frequency, apparent activation energy, reaction orders) and product distribution, which have been largely overlooked across the literature.
Other challenges include the reproducibility of sensing performance outside a well-controlled laboratory space, which requires thorough formulation and, most importantly, communication of experimental protocols. Finally, future efforts will enable us to integrate these sensor materials into suitable platforms for alarm systems and mobile robotic devices (such as drones and robot dogs) for distributed and automated air quality monitoring. In summary, the field of air quality sensor research offers significant opportunities for the scientific community to drive innovations with an immediate impact on industry and our society.
The reference list from the paper itself. Each links out to its DOI / PubMed record.
- 1World Health Organization . World Health Statistics 2025: Monitoring Health for the SD Gs, Sustainable Development Goals; Geneva, 2025 https://www.who.int/publications/i/item/9789240110496 (accessed 2025–11–18).
- 2Tran H. M.Tsai F. J.Lee Y. L.Chang J. H.Chang L. Te.Chang T. Y.Chung K. F.Kuo H. P.Lee K. Y.Chuang K. J.Chuang H. C.The Impact of Air Pollution on Respiratory Diseases in an Era of Climate Change: A Review of the Current Evidence Sci. Total Environ.202389816634010.1016/j.scitotenv.2023.16634037591374 · doi ↗ · pubmed ↗
- 3Fuller R.Landrigan P. J.Balakrishnan K.Bathan G.Bose-O’Reilly S.Brauer M.Caravanos J.Chiles T.Cohen A.Corra L.Cropper M.Ferraro G.Hanna J.Hanrahan D.Hu H.Hunter D.Janata G.Kupka R.Lanphear B.Lichtveld M.Martin K.Mustapha A.Sanchez-Triana E.Sandilya K.Schaefli L.Shaw J.Seddon J.Suk W.Téllez-Rojo M. M.Yan C.Pollution and Health: A Progress Update Lancet Planet. Health 202266 e 535e 54710.1016/S 2542-5196(22)00090-035594895 PMC 11995256 · doi ↗ · pubmed ↗
- 4World Health Organization . Ambient (outdoor) air pollution, World Health Organization, https://www.who.int/news-room/fact-sheets/detail/ambient-%28outdoor%29-air-quality-and-health. (accessed 2025–11–18).
- 5Cascio W. E.Wildland Fire Smoke and Human Health Sci. Total Environ.201862458659510.1016/j.scitotenv.2017.12.08629272827 PMC 6697173 · doi ↗ · pubmed ↗
- 6Schollaert C.Connolly R.Cushing L.Jerrett M.Liu T.Marlier M.Air Quality Impacts of the January 2025 Los Angeles Wildfires: Insights from Public Data Sources Environ. Sci. Technol. Lett.202512891191710.1021/acs.estlett.5c 00486 · doi ↗
- 7Reid C. E.Brauer M.Johnston F. H.Jerrett M.Balmes J. R.Elliott C. T.Critical Review of Health Impacts of Wildfire Smoke Exposure Environ. Health Perspect.201612491334134310.1289/ehp.140927727082891 PMC 5010409 · doi ↗ · pubmed ↗
- 8Lin F.Li G.Wang Y.Dong P.Yang K.Liu H.Xie N.Liu J.Chen H.Liu X.Li H.Li X.Li D.Sun S.Wang X.Sun Y.Li J.Zhao G.Chen Z.Pu J.Impacts of Air Pollutions on Cardiovascular and Cerebrovascular Diseases through Inflammation: A Comprehensive Analysis of One Million Chinese and Half Million UK Individuals J. Transl. Med.202523146910.1186/s 12967-025-06397-340275267 PMC 12020266 · doi ↗ · pubmed ↗