Development of a Functioning Measurement Scale for the South Korean Population Using the Korea National Health and Nutrition Examination Survey
Jiin Kim, Carolina Fellinghauer, Jsabel Hodel, Youngtae Cho, Wanho Kim, Carla Sabariego

TL;DR
This study created a health functioning scale for South Korea using national survey data and tested its reliability and fairness across different groups.
Contribution
A standardized functioning metric was developed using KNHANES data for policy-relevant health assessments in Korea.
Findings
14 functioning items were validated on a 0–100 scale with acceptable psychometric properties.
The metric showed limited differential item functioning by age and no local item dependency.
The scale complements traditional health indicators and supports evidence-based policymaking.
Abstract
This study aimed to develop a functioning metric for the Korean general population using the Korea National Health and Nutrition Examination Survey (KNHANES) and to evaluate its psychometric properties. A Partial Credit Model (PCM) calibrated functioning items from KNHANES on a 0–100 scale. Psychometric properties examined, including item fit, unidimensionality, local item dependency (LID), targeting, and differential item functioning (DIF) across age, sex, and region. Using data from 5,413 adults, 14 functioning items were used to construct the metric. Model fit was achieved through a testlet solution. Item fit and unidimensionality were acceptable, with no LID observed. Reliability was adequate, though targeting indicated items were easy for the sample. Limited DIF by age was detected. This study developed a standardized, policy-relevant functioning metric using national health…
Click any figure to enlarge with its caption.
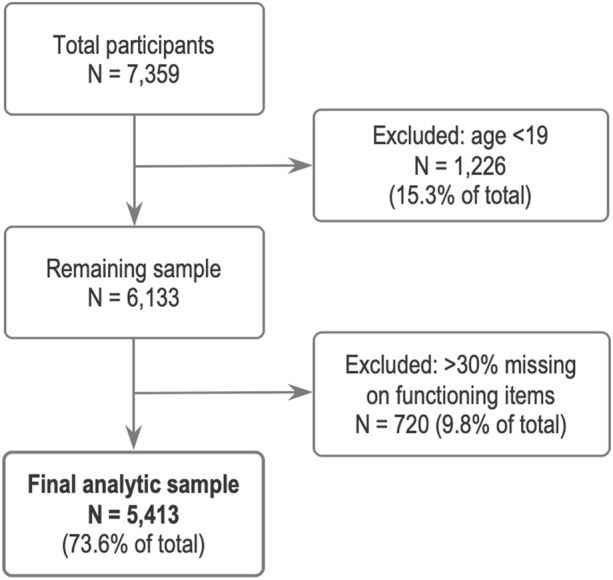 FIGURE 1
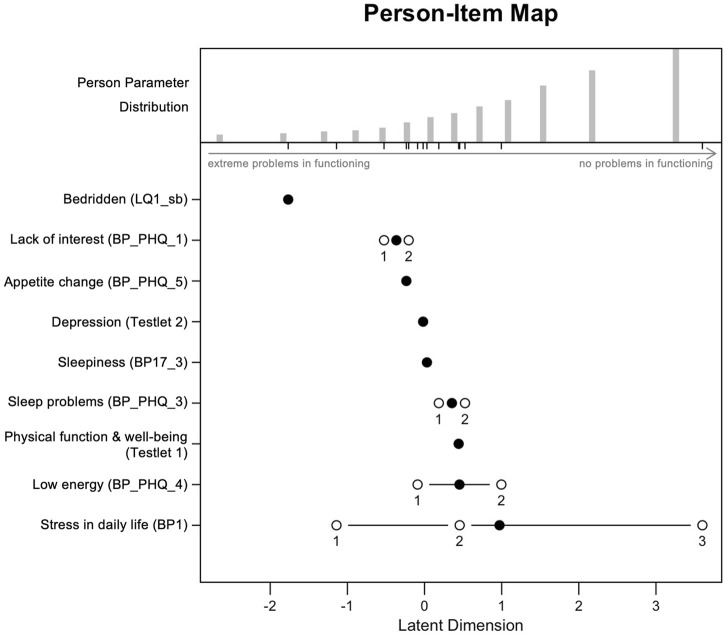 FIGURE 2
| ICF category | Label | Item identifier | 2019 | 2020 | 2021 |
|---|---|---|---|---|---|
| d230 | Confirmation of activity limitation | LQ4_00 | ✓ | ✓ | ✓ |
| b130, b455 | Bedridden status in the past month | LQ1_sb | ✓ | ✓ | ✓ |
| d850 | Confirmation of absent from school or work due to illness or impairment in the past month | LQ2_ab | ✓ | ✓ | ✓ |
| b455, d450 | EQ-5D | LQ_1EQL | ✓ | ✓ | |
| d510, d540 | EQ-5D: self-care | LQ_2EQL | ✓ | ✓ | |
| d230 | EQ-5D: daily activities | LQ_3EQL | ✓ | ✓ | |
| b280 | EQ-5D: pain/discomfort | LQ_4EQL | ✓ | ✓ | |
| b152 | EQ-5D: anxiety/depression | LQ_5EQL | ✓ | ✓ | |
| d451 | HINT-8 | LQ_1HT | ✓ | | ✓ |
| b280 | HINT-8: pain | LQ_2HT | ✓ | | ✓ |
| b130 | HINT-8: energy | LQ_3HT | ✓ | | ✓ |
| d850 | HINT-8: work | LQ_4HT | ✓ | | ✓ |
| b152 | HINT-8: depression | LQ_5HT | ✓ | | ✓ |
| b144 | HINT-8: memory | LQ_6HT | ✓ | | ✓ |
| b134 | HINT-8: sleep | LQ_7HT | ✓ | | ✓ |
| b134 | Sleepiness | BP17_3 | ✓ | ✓ | ✓ |
| d240 | Feeling stress in daily life | BP1 | ✓ | ✓ | ✓ |
| b130 | PHQ-9 | BP_PHQ_1 | | ✓ | |
| b152 | PHQ-9: feeling subdued, depressed or hopeless | BP_PHQ_2 | | ✓ | |
| b134 | PHQ-9: difficulty falling asleep, waking up, or sleeping too much | BP_PHQ_3 | | ✓ | |
| b130 | PHQ-9: tiredness, low energy | BP_PHQ_4 | | ✓ | |
| b130 | PHQ-9: loss of appetite or overeating | BP_PHQ_5 | | ✓ | |
| Characteristics | Category | Value or N (unweighted) | Value or N (weighted) | % (weighted) |
|---|---|---|---|---|
| Age (mean; median) | 51.36; 53 | 47.32; 47 | | |
| Region | Capital city (Seoul) | 1,116 | 7,979,283 | 19.9 |
| | Metropolitan city | 1,163 | 9,887,042 | 24.6 |
| | Province | 3,134 | 22,323,766 | 55.5 |
| Sex | Male | 2,437 | 20,112,034 | 50 |
| | Female | 2,976 | 20,078,057 | 50 |
| Income | Low | 1,306 | 9,575,698 | 23.9 |
| | Middle low | 1,357 | 9,919,328 | 24.8 |
| | Middle high | 1,365 | 10,342,494 | 25.8 |
| | High | 1,367 | 10,234,820 | 25.5 |
| Education | <=Elementary school | 919 | 4,585,619 | 11.4 |
| | Middle school | 523 | 3,056,278 | 7.6 |
| | High school | 1,901 | 15,515,332 | 38.7 |
| | University/college=< | 2,060 | 16,992,988 | 42.3 |
| Marriage | Married | 4,286 | 29,568,454 | 73.6 |
| | Unmarried | 1,127 | 10,621,637 | 26.4 |
| General health | Very good | 254 | 1,969,795 | 4.9 |
| | Good | 1,313 | 10,198,014 | 25.4 |
| | Fair | 2,800 | 20,916,198 | 52 |
| | Poor | 867 | 6,136,240 | 15.3 |
| | Very poor | 179 | 969,844 | 2.4 |
| Item identifier | Label | Linked | Response option | Raw→ | N | % |
|---|---|---|---|---|---|---|
| BP1 | Feeling stress in daily life | d240 | Feel very much | 1→0 | 26 | 4.9 |
| Feel a lot | 2→1 | 1,226 | 22.7 | |||
| Feel a little | 3→2 | 3,085 | 57 | |||
| Hardly feel | 4→3 | 835 | 15.4 | |||
| BP_PHQ_1 | Little interesting or fun in doing work | b130 | Almost everyday | 3→0 | 215 | 4 |
| Over a week | 2→1 | 121 | 2.2 | |||
| For several days | 1→2 | 834 | 15.4 | |||
| Not at all | 0→3 | 4,243 | 78.4 | |||
| BP_PHQ_2 | Feeling subdued, depressed or hopeless | b152 | Almost everyday | 3→0 | 121 | 2.2 |
| Over a week | 2→1 | 119 | 2.2 | |||
| For several days | 1→2 | 704 | 13 | |||
| Not at all | 0→3 | 4,469 | 82.6 | |||
| BP_PHQ_3 | Difficulty falling asleep, waking up, or sleeping too much | b134 | Almost everyday | 3→0 | 470 | 8.7 |
| Over a week | 2→1 | 242 | 4.5 | |||
| For several days | 1→2 | 1,149 | 21.2 | |||
| Not at all | 0→3 | 3,552 | 65.6 | |||
| BP_PHQ_4 | Tiredness, low energy | b130 | almost everyday | 3→0 | 429 | 7.9 |
| Over a week | 2→1 | 256 | 4.8 | |||
| For several days | 1→2 | 1,533 | 28.3 | |||
| Not at all | 0→3 | 3,195 | 59 | |||
| BP_PHQ_5 | Loss of appetite or overeating | b130 | Almost everyday | 3→0 | 176 | 3.3 |
| Over a week | 2→1 | 144 | 2.7 | |||
| For several days | 1→2 | 652 | 12 | |||
| Not at all | 0→3 | 4,441 | 82 | |||
| BP17_3 | Sleepiness | b134 | Yes | 1→0 | 1,156 | 21.4 |
| No | 2→1 | 4,257 | 78.6 | |||
| LQ1_sb | Bedridden status in the past month | b130, b455 | Yes | 1→0 | 300 | 5.5 |
| No | 2→1 | 5,113 | 94.5 | |||
| LQ_1EQL | EuroQoL: exercise ability | b455, d450 | I have to lie down all day | 3→0 | 19 | 0.4 |
| I have some problem walking | 2→1 | 684 | 12.6 | |||
| I have no problem walking | 1→2 | 4,710 | 87 | |||
| LQ_2EQL | EuroQoL: self-care | d510, d540 | I cannot take a bath or get dressed myself | 3→0 | 8 | 0.1 |
| I have some problems taking a bath or getting dressed myself | 2→1 | 177 | 3.3 | |||
| I have no problem taking a bath or getting dressed | 1→2 | 5,228 | 96.6 | |||
| LQ_3EQL | EuroQoL: daily activities | d230 | I cannot do daily activities | 3→0 | 19 | 0.4 |
| I have some problems doing daily activities | 2→1 | 333 | 6.1 | |||
| I have no problem doing daily activities | 1→2 | 5,061 | 93.5 | |||
| LQ_4EQL | EuroQoL: pain/discomfort | b280 | I have very severe pain or discomfort | 3→0 | 97 | 1.8 |
| I have some pain or discomfort | 2→1 | 996 | 18.4 | |||
| I have no pain or discomfort | 1→2 | 4,320 | 79.8 | |||
| LQ_5EQL | EuroQoL: anxiety/depression | b152 | I am very anxious or depressed | 3→0 | 32 | 0.6 |
| I am somewhat anxious or depressed | 2→1 | 485 | 9 | |||
| I am not anxious or depressed | 1→2 | 4,896 | 90.4 | |||
| LQ4_00 | Confirmation of activity limitation | d230 | Yes | 1→0 | 397 | 7.3 |
| No | 2→1 | 5,016 | 92.7 |
| Statistic | Initial analysis | Testlet solution |
|---|---|---|
| Item difficulties - mean (SD) | −0.21 (1.43) | −0.01 (1.21) |
| Person abilities - mean (SD) | 2.51 (1.39) | 1.80 (1.47) |
| Person separation index (PSI) | 0.55 | 0.55 |
| Cronbach’s alpha | 0.79 | 0.74 |
| Analysis type | Item identifier | Label | Item difficulty | Thresholds | Disordered thresholds | Outfit MSQ | Infit MSQ | LID | DIF | |
|---|---|---|---|---|---|---|---|---|---|---|
| Location | 1 | 2 | ||||||||
| Initial analysis | BP1 | Feeling stress in daily life | 1.70 | −0.32 | 4.29 | | 0.98 | 1.01 | | |
| BP_PHQ_1 | Little interest or fun in doing work | 0.39 | −0.63 | 1.31 | Yes | 0.72 | 1.00 | | | |
| BP_PHQ_2 | Feeling subdued, depressed or hopeless | 0.08 | −0.58 | 0.60 | Yes | 0.48 | 0.77 | | | |
| BP_PHQ_3 | Difficulty falling asleep, waking up, or sleeping too much | 0.95 | −0.02 | 1.67 | Yes | 0.85 | 0.96 | | | |
| BP_PHQ_4 | Tiredness, low energy | 1.00 | −0.22 | 1.68 | Yes | 0.66 | 0.78 | | | |
| BP_PHQ_5 | Loss of appetite or overeating | 0.26 | −0.25 | 0.87 | Yes | 0.70 | 0.92 | | | |
| BP17_3 | Sleepiness | 0.74 | 0.74 | | | 1.07 | 1.08 | | Age | |
| LQ1_sb | Bedridden status in the past month | −1.02 | −1.02 | | | 0.82 | 0.94 | | | |
| LQ_1EQL | Exercise ability | −1.33 | −2.68 | 0.01 | | 1.04 | 1.01 | LQ_2EQL, LQ_3EQL, LQ_4EQL | Age | |
| LQ_2EQL | Self-care | −2.01 | −2.43 | −1.60 | | 0.66 | 0.92 | LQ_1EQL, LQ_3EQL, LQ_4EQL | Age | |
| LQ_3EQL | Daily activities | −1.48 | −2.08 | −0.88 | | 0.58 | 0.88 | LQ_1EQL, LQ_2EQL, LQ_4EQL | Age | |
| LQ_4EQL | Pain/discomfort | −0.34 | −1.25 | 0.58 | | 0.90 | 0.98 | LQ_1EQL, LQ_2EQL, LQ_3EQL | Age | |
| LQ_5EQL | Anxiety/depression | −1.14 | −1.85 | −0.42 | | 0.51 | 0.81 | | | |
| LQ4_00 | Activity limitation | −0.69 | −0.69 | | | 0.71 | 0.91 | LQ_3EQL | Age | |
| Testlet solution | BP1 | Feeling stress in daily life | 0.97 | −1.14 | 3.60 | | 0.92 | 0.94 | | |
| BP17_3 | Sleepiness | 0.03 | 0.03 | | | 1.11 | 1.13 | | Age | |
| LQ1_sb | Bedridden status in the past month | −1.77 | −1.77 | | | 0.86 | 0.92 | | | |
| BP_PHQ_1 | Little interest or fun in doing work | −0.36 | −0.52 | −0.21 | | 0.65 | 0.87 | | | |
| BP_PHQ_3 | Difficulty falling asleep, waking up, or sleeping too much | 0.35 | 0.19 | 0.52 | | 0.77 | 0.88 | | | |
| BP_PHQ_4 | Tiredness, low energy | 0.45 | −0.09 | 1.00 | | 0.61 | 0.71 | | | |
| BP_PHQ_5 | Loss of appetite or overeating | −0.24 | −0.24 | | | 0.67 | 0.85 | | | |
| Testlet 1 | Physical function & wellbeing | 0.44 | 0.44 | | | 1.18 | 1.14 | | Age | |
| Testlet 2 | Depression, subdued | −0.02 | −0.02 | | | 0.58 | 0.79 | | | |
| Raw total score | Logit score (PCM analysis) | 0–100 functioning score |
|---|---|---|
| 0 | −3.55 | 0.00 |
| 1 | −2.65 | 11.20 |
| 2 | −1.83 | 21.51 |
| 3 | −1.30 | 28.10 |
| 4 | −0.89 | 33.20 |
| 5 | −0.55 | 37.55 |
| 6 | −0.23 | 41.52 |
| 7 | 0.08 | 45.33 |
| 8 | 0.39 | 49.17 |
| 9 | 0.71 | 53.26 |
| 10 | 1.08 | 57.89 |
| 11 | 1.54 | 63.57 |
| 12 | 2.17 | 71.50 |
| 13 | 3.26 | 85.07 |
| 14 | 4.45 | 100.00 |
Peer Reviews
No public reviews on file for this paper yet. If you reviewed it on a platform where reviews are public (OpenReview, ICLR, NeurIPS, ICML), you can paste yours below so the community can read it here.
Videos
No videos yet. Explain this paper in a talk, walkthrough, or lecture? Add one.
Taxonomy
TopicsPsychometric Methodologies and Testing · Nutrition and Health in Aging · Health disparities and outcomes
Introduction
South Korea is one of the most rapidly ageing countries and is projected to become a super-aged society by 2026, defined as having more than 21% of the population aged 65 or older [1–3]. While people are living longer, multimorbidity has become increasingly common, affecting 54.9% of adults aged 65 and above in South Korea [4]. The most common multimorbidity pattern involves hypertension and osteoarthritis [5]. Hypertension is a major risk factor for stroke and cardiovascular events [6], whereas osteoarthritis directly affects people´s mobility, leading to withdrawal from participating in home or social activities [7]. These two conditions are important examples of the disabling impact of chronic diseases, contributing to functional decline in older adults [8, 9]. As the ageing population grows, the burden of such chronic conditions is expected to increase at the population level [5, 10].
According to the World Health Organization (WHO), health is “more than the absence of disease and infirmity” [11]. Traditional health indicators, such as mortality and morbidity, may not fully capture population health, as they overlook the severity of health conditions and their interactions with environment [11–13]. This is particularly evident in older adults, whose health reflects complex interactions among physiological changes, disease, and multimorbidity [12]. A functioning-based health indicator [14] is valuable in complementing disease-based indicators to better address the challenges of population ageing [12]. Functioning, as defined by WHO, refers to the impact of health conditions on a person’s life, encompassing biological and lived health, which includes actual performance in interaction with the environment [15–17]. Incorporating functioning-based assessments into national data systems enables the development of indicators, like disability-free life expectancy, to inform population health and ageing-related policy [18, 19].
The International Classification of Functioning, Disability and Health (ICF) [15] provides a universal framework for describing overall health and enables standardized reporting of functioning and disability [20, 21]. Based on this framework, functioning metrics have been developed using data from population surveys, such as the English Longitudinal Study of Ageing (ELSA), and the Survey of Health, Ageing and Retirement in Europe (SHARE) [22–24], applying the Rasch model, which estimates underlying functioning ability based on item difficulty and respondents’ ability [25, 26]. Recent studies have explored the feasibility of deriving functioning metrics in Korea. Kim et al. [27] applied the ICF linking rules [28]–which connect key concepts from source information to ICF categories–to identify functioning information collected in Korean health surveys. They confirmed that survey items were linkable to ICF categories and sufficiently covered key ICF domains [27]. For example, items from the Korea National Health and Nutrition Examination Survey (KNHANES) [29] were linked to six of the seven ICF Generic-7 Set categories [30], a minimal standard for assessing and reporting population functioning [27]. These findings indicate the suitability of KNHANES for population-level functioning monitoring [27].
Despite this potential, no study has yet validated a Rasch-based functioning metric in Korea. Previous studies in Korea generated only ordinal functioning scores using summative or predefined scoring methods [31, 32], without establishing a psychometrically grounded functioning scale. While Rasch-based metrics have been validated in other countries, they have predominantly focused on older adults [22, 23]. Our study extends this approach to the general adult population in Korea, enhancing its utility for population-level health assessment. For clarity, we distinguish three related terms: metric refers to the scale itself, score to an individual’s value on that scale, and indicator to summary statistics, such as mean or median derived from individual scores [22, 24, 33].
This study aims to develop a functioning metric for Korea’s general population using KNHANES data [29] and evaluate its psychometric properties through Rasch analysis. The resulting metric is expected to serve as a foundational resource for monitoring population health within the ICF framework and for informing public health and rehabilitation strategies, particularly in addressing the challenges posed by Korea’s transition to a super-aged society.
Methods
Data
We used data from the KNHANES, an annual survey producing representative statistics on the health status, health behaviors, and nutrition intake of the Korean population [34]. The KNHANES operates in three-year cycles [34]. For this study, we analyzed data from the second year (2020) of the 8th cycle (2019–2021). The survey follows a multistage clustered probability sampling design [35]. Primary sampling units (PSUs) were enumeration districts, stratified by region, urbanicity, and housing type [34]. Full methodology and datasets are available online (https://knhanes.kdca.go.kr/knhanes/main.do, Korean only) [34, 35]. While most survey items remain consistent across years within a cycle, some items are included only in specific years as part of a rotating module (Table 1). Using the standardized ICF linking rules [36], we previously identified 15 functioning-related items from the KNHANES 2020 questionnaire [27]. Those items were linked to their corresponding ICF categories [27], and were used in this study.
We applied three exclusion criteria: (1) participants under 19 years old; (2) more than 30% of missing responses across functioning items; (3) functioning items with a missing rate over 30%. The 30% cutoff was adopted to ensure measurement reliability [22, 37]. In the original KNHANES coding, scoring directions were inconsistent across items; in some items, higher scores indicated more difficulties in functioning, while in others, higher scores represented fewer difficulties. To ensure higher scores consistently reflect better functioning, reverse coding was applied to negatively worded items.
Missing responses were minimal (<0.7%) across all functioning items except BP17_3, which showed structural missingness because it was administered only to participants aged ≥40 years. Item-level mean replacement was applied to all functioning items with missing values to preserve the observed distribution.
Statistical Analysis
Descriptive Statistics
Descriptive statistics included information of the study population in terms of demographic and socioeconomic characteristics such as sex, age, income, education, and marital status. The residential areas were grouped into three categories based on Korea’s administrative divisions: capital city, metropolitan city, and province. There are six metropolitan cities in Korea, with generally have higher population densities relative to their land area than the provinces. Descriptive analyses incorporated sampling weights, stratification and PSUs to account for its complex sampling design and ensure the representativeness of the national population [34].
Rasch Analysis
The analysis applied the Partial Credit Model (PCM), a Rasch model suitable for both dichotomous (e.g., yes or no) and polytomous (e.g., 3-or 4- ordinal categorical responses) item ratings [38]. PCM is appropriate when response categories vary across items and equal intervals cannot be assumed [38, 39]. To test the fundamental assumptions underlying Rasch modeling, the following procedures were conducted.
First, unidimensionality and local item dependencies (LID) were evaluated [40]. Unidimensionality means that all items measure a single underlying ability or trait [41]. We assessed this using principal component analysis (PCA) of Rasch residuals, with a second eigenvalue >1.4 indicating multidimensionality [42, 43]. LID refers to item dependence, where a response to one item affects another [41]. Item pairs with residual correlations >0.2 were considered locally dependent and combined into “testlets” to improve model fit [41, 44, 45].
Second, item fit was assessed using Infit and outfit mean square (MNSQ) statistics [40], with acceptable values ranging from 0.7 to 1.3 [23]. Values outside this range may indicate misfit, with those above 1.3 being particularly detrimental due to measurement noise and reduced discriminative ability [40, 46]. Additionally, threshold disordering was examined, which occurs when respondents cannot consistently distinguish between response categories, often due to unclear labels or an excessive number of options [25]. When detected, response categories were collapsed to improved model fit [25].
Third, person-fit statistics were used to detect inconsistent respondent patterns and assess data quality [46]. Reliability and measurement precision were examined using Cronbach’s alpha and the Person Separation Index (PSI), with values >0.7 indicating adequacy for group-level analysis [40, 47]. Item-person targeting was also assessed, with a difference >0.5 logits between mean item difficulty and mean person ability considered suboptimal targeting, potentially producing ceiling or floor effects [48].
Lastly, Differential Item Functioning (DIF) was examined across sex (male; female), age (19≤ years <45; 45≤ years <65; 65≤ years), and region (capital city; metropolitan city; province) [43]. DIF, indicating potential bias across groups and threatening measurement fairness [22], was evaluated using ordinal logistic regression, with McFadden’s pseudo R-squared >0.01 as the criterion [49]. Rasch analysis was conducted iteratively until acceptable model fit was achieved.
Functioning Metric Development
To develop the functioning metric, Rasch analysis was used to transform ordinal raw scores into an interval-scale metric ranging from 0 (extreme problems in functioning) to 100 (no problems in functioning), after confirming model fit [13, 24]. This transformation addresses the limitations of ordinal data, enabling parametric analysis and meaningful comparisons [10, 22].
Data analyses were performed using R software version 4.4.1. The eRm package was used for Rasch analysis with the PCM [50], and lordif for DIF analysis [49].
Results
KNHANES Sample
A total of 7,359 individuals participated in the 2020 KNHANES. After excluding those under 19 years of age (n = 1,226) and individuals with more than 30% missing responses across the 15 functioning items (n = 720), 5,413 participants remained for analysis (Figure 1). The age range of participants was 19–80 years and over. In the KNHANES dataset, individuals aged ≥80 years were grouped together and coded as 80. Therefore, we provide the weighted median age, which was 47 years (interquartile range [IQR] = 26). Among them, 2,437 (50%, weighted) were male, and 2,279 (44.5%, weighted) resided in capital or metropolitan areas. Most participants were married and had at least a high school education. Regarding self-rated health, 4,367 (82.3%, weighted) reported their health as very good, good, or fair, while 17.7% (weighted) rated their health as poor or very poor. Descriptive statistics of the study population are shown in Table 2.
Flow chart of participant selection. Korea National Health and Nutrition Examination Survey, Republic of Korea, 2020.
Originally, 15 functioning items were selected for analysis. However, one item—“absent from school or work due to illness or impairment (d850)”—had more than 30% missing responses and was excluded. The remaining 14 items were used to build the functioning metric, and their response distributions are shown in Table 3. These items were linked to ten distinct ICF categories: five under the Body Functions component (e.g., mental functions, sensory functions, and pain), and the rest under the Activities and Participation component (e.g., self-care and mobility) [15].
In most items, the majority of participants reported no or only minimal difficulties in functioning. However, a few specific items showed notably lower rates of no problems in functioning. The lowest rates were observed for BP1 - feeling stress in daily life (15.4%), linked to d240 Handling stress and other psychological demands, and BP_PHQ_4 - tiredness, low energy (59%), linked to b130 Energy and drive functions. Two items (BP_PHQ_3 and BP17_3), linked to b134 Sleep functions, also showed relatively low rates (65.6% and 78.6%).
Rasch Analysis
The initial Rasch analysis revealed that the data did not meet the model’s assumptions. At baseline, some of the items presented LID, and threshold disordering. The scale as a whole was multidimensional. To address these issues, we followed Baghaei’s approach [39] and created two testlets combining correlated items:
- Testlet 1 (Physical function & wellbeing): LQ_1EQL - exercise ability; LQ_2EQL - self-care; LQ_3EQL - daily activity; LQ_4EQL - pain/discomfort; LQ4_00 - activity limitation.
- Testlet 2 (Depression, subdued): LQ_5EQL - anxiety/depression; BP_PHQ_2 - feeling subdued, depressed or hopeless.
After applying testlets, the model showed no LID, supporting unidimensionality (second eigenvalue = 1.33). However, several items exhibited threshold disordering, likely due to skewed response distributions, where very few respondents selected the lowest scores (indicating severe problems in functioning) (Table 3). Accordingly, four items (BP_PHQ_1 - little interest or fun in doing work; BP_PHQ_3 - difficulty falling asleep, waking up, or sleeping too much; BP_PHQ_4 - tiredness, low energy; BP_PHQ_5 - loss of appetite or overeating) were initially recoded by collapsing adjacent response categories. For these items, original scores 0 and 1 were collapsed into 0, 2 into 1, and 3 into 2. This resolved disordering in BP_PHQ_1, BP_PHQ_3, and BP_PHQ_4. However, BP_PHQ_5 required further recoding into a dichotomous format (0–2 to 0; 3 to 1) to eliminate disordering.
In a subsequent step, item fit for Testlet 1 was above 1.2 and for Testlet 2 was 0.4, requiring adjustment. For Testlet 1, response categories were collapsed step by step until a dichotomous format was achieved: raw scores 0–8 were collapsed into 0 (“have a problem”) and 9 into 1 (“no problem”), improving the item fit to below 1.2. For Testlet 2, dichotomizing its original categories improved the item fit to 0.58. The detailed R code for these steps is provided in the Supplementary Material 1.
Table 4 compares psychometric properties between the initial analysis and the testlet solution (as previously described; hereafter ‘testlet solution’). With the testlet solution, Cronbach’s alpha decreased slightly from 0.79 to 0.74 but remained >0.7, indicating acceptable reliability for population surveys. In contrast, the PSI was 0.55, which may be attributed to the skewed score distribution, with most participants showing high levels of functioning. As a supplementary analysis, we used weighted sampling by 20-point intervals of functioning score (N = 120). This yielded a PSI of 0.81, suggesting the lower value in the full sample may reflect score skewness.
In the testlet solution, the mean person ability estimate decreased from 2.51 to 1.80, bringing it closer to the mean item difficulty (from −0.21 to −0.01). This indicates better alignment between person abilities and item difficulties. However, as the discrepancy still >0.5 logits, the items appeared generally too easy for the sample, implying the scale may be better suited to assessing individuals with higher disability levels than those in this sample. We conducted additional analysis to examine whether person-item alignment differed by age group. However, no significant differences in targeting were found across age groups.
The fit statistics of the testlet solution are shown in Table 5. Four items (BP_PHQ_1, BP_PHQ_4, BP_PHQ_5, and Testlet 2) had outfit values <0.7, indicating overfit. This suggests that these items/testlet predicted response patterns too well. All other items demonstrated acceptable infit and outfit MNSQ values within the commonly recommended range (0.7–1.3). Regarding item difficulty, BP1 - feeling stress in daily life had the highest value (0.97), which indicated that respondents found it hardest to endorse this item. In other words, most individuals, regardless of their level of functioning, were more likely to report stress in daily life than other items. Conversely, LQ1_sb - bedridden status in the past month had the lowest difficulty (−1.77), meaning that most respondents did not report a bedridden status in the past month. BP1 also showed the widest measurement range (−1.14–3.60) among all items. DIF analysis revealed no notable differences by sex or region, but age-related DIF was found in two items: BP17_3 - sleepiness and Testlet 1 - physical function & wellbeing. The presence of DIF suggests that these items may function differently across age groups.
The results of the testlet solution are visualized in the Person-Item Map (Figure 2), showing the distribution of person abilities and item difficulties along the latent scale (functioning score). The upper section shows person parameters, indicating the relative ability levels of respondents (i.e., their levels of functioning), with individuals at higher levels of functioning appearing further to the right. The lower section shows item locations along the same latent scale, reflecting item difficulty (i.e., how likely respondents were to report no problems on that item), with items located further to the right representing more difficult items (e.g., BP1), and those on the left indicating easier items (e.g., LQ1_sb). Item difficulties are indicated by black dots, and threshold locations between response categories by white dots. The distribution of person abilities is slightly right-skewed compared to item difficulties, suggesting a potential ceiling effect (i.e., the metric assesses levels of disability above what is found in the population).
Person-Item Map for the final Partial Credit Model (testlet solution), showing the distribution of person abilities and item difficulties along the latent scale (functioning score). Korea National Health and Nutrition Examination Survey, Republic of Korea, 2020.
Table 6 presents the transformation of raw scores into a user-friendly functioning scores ranging from 0 (extreme problems in functioning) to 100 (no problems in functioning). In the initial analysis, the maximum total raw score was 31, as described in Table 2. However, in the testlet solution, response categories were collapsed, resulting in a total score ranging from 0 to 14.
Discussion
This study developed a functioning metric for the Korean population using the KNHANES data, and validated it through the Rasch model. Model fit was achieved through a testlet solution and response category collapsing, ensuring that the final model satisfied the key assumptions of the PCM. Some items showed outfit MNSQ values <0.7, suggesting potential overfit [40]. However, unlike underfit, overfit rarely affects measurement quality in practice and is not considered a violation of psychometric properties [40]. The final functioning metric was transformed to a 0–100 scale to provide a standardized, policy-relevant measure of health of the general population, conceptually aligned with the ICF framework [15]. This functioning metric and the resulting score can be used for building a functioning indicator to synthesize the general level of health in a population, a measure often overlooked by the traditional health indicators, such as mortality and morbidity, thereby offering complementary perspective on population health [14].
This work is in line with prior studies aiming to develop a functioning metric using population datasets, for example, by Oberhauser et al. [23] and Fellinghauer et al. [22]. While methodologically aligned, our study differs in its application to a nationally representative adult population, using a single year of KNHANES data and incorporating all available functioning items. The final metric included data from ten distinct ICF categories, all of which are part of the Generic-30 Set [51]—a minimal set of 30 categories for assessing functioning and disability in both clinical and population health contexts—underscoring their relevance in evaluating core aspects of functioning. Although our analysis focused on a single time point, KNHANES’s repeated annual structure [34] offers potential for multi-year metric development. Similarly, Caballero et al. [52] developed a longitudinal functioning metric using multiple years of ELSA data, based on 39 anchor items.
Our study highlights the practical value of repurposing existing national health datasets to derive meaningful insights into population health using the comprehensive operationalization of functioning proposed by WHO [16, 53]. Given the increasing demand for health monitoring in ageing societies [4], maximizing the utility of routinely collected national data offers a cost-effective alternative to developing new assessment tools and collecting additional data, which require substantial time and resources [54]. KNHANES has been annually implemented since 2007 [34, 35], offering a solid basis for monitoring population-level trends in functioning over time. Its breadth spanning health conditions, health behaviors, healthcare utilization, and clinical indicators [34] also facilitates analyses of relationships between health-determinants and functioning.
The developed functioning metric is valid for population-level use, though the refinement of data collection aspects would improve its psychometric properties. Potential future opportunities for refinements are relatively minor. A key issue lies in the skewed distribution of functioning ability. For instance, the scarcity of responses indicating severe limitations in functioning led to the collapsing of response categories to improve model fit, thereby reducing data granularity [39]. To address underrepresentation of individuals with lower functioning, incorporating data from the Korean Longitudinal Healthy Ageing Cohort (KLHAC) [55] could improve understanding of high-risk subpopulations [17]. KLHAC can be linked to data from the National Health Insurance Service (NHIS), which include medical and long-term care records, and potentially aligned with the ICF framework [4, 55]. A second opportunity is to integrate ICF-based surveys (e.g., the brief version of the Model Disability Survey (MDS) [56]) into existing national surveys to increase the specificity and comprehensiveness of functioning data [17, 24]. KNHANES offers extensive information, but it is primarily disease-focused. Integrating instruments such as the brief MDS could provide more refined insights into functioning and support international comparability. Finally, item-level improvements are also warranted. We observed variation in threshold spacing across items: for example, BP1 - feeling stress in daily life showed noticeably wide intervals. In such cases, additional response categories could improve measurement precision [57].
This functioning metric has practical implications for public health strategies, particularly in the context of multimorbidity and population ageing. In Korea, although healthy life expectancy (HALE) is high, healthy ageing score remains relatively low [58], suggesting a mismatch between disease-based indicators and lived health. This discrepancy highlights the need for functioning-based indicators in population health monitoring. As shown in our study, a functioning metric utilizing the ICF as a universal reference enables standardized reporting and allows for quantitative group comparisons on an interval scale, rather than the commonly used ordinal scales [17]. Moreover, the routine use of functioning information can support a learning health system (LHS), strengthening a continuous cycle that integrates research, policy, and practice based on sound scientific evidence [17, 59]. The metric therefore has potential utility in national surveillance, rehabilitation planning, and long-term care policy development.
In Korea, prior studies have measured functioning using the ICF framework, for example, in stroke or breast cancer [60, 61], but these have largely focused on specific conditions. To our knowledge, no study has validated psychometric properties of a functioning metric using a nationally representative dataset of the entire population. An additional noteworthy finding is that, contrary to expectations that older adults would report lower levels of functioning, in some items—such as BP1 - feeling stress in daily life, BP_PHQ_1 - little interesting or fun in doing work, and BP_PHQ_4 - tiredness, low energy—a higher proportion of older adults (aged 60 and above) reported ‘no problems’ compared to the younger group (aged 19–44). This may reflect the greater mental health burden among younger generations in Korea, as well as broader social factors such as intergenerational economic disparities [62, 63]. This observation suggests that functioning patterns need to be interpreted in light of the country-specific sociocultural context, rather than solely through age-based assumptions.
Limitations
This study has several limitations. First, LID was detected among some functioning items, necessitating the construction of testlets. This aggregation of multiple ordinal items increased the number of response categories, which appeared to contribute to threshold disordering [24]. Accordingly, response categories were dichotomized, resulting in a certain degree of information loss [39], which may reduce the precision of measurement. Second, items LQ_1EQL - exercise ability, LQ_2EQL - self-care, and LQ_3EQL - daily activities showed extremely low response frequencies for severe problems in functioning. Such irregular distributions are common in clinical or population data, as many respondents tend to report good functioning [40]. However, infrequently used response categories may also indicate unnecessary or redundant distinctions between categories, or suboptimal item wording or content [23, 40]. Moreover, sparse endorsement in extreme categories may limit the sensitivity of these items in detecting differences among individuals with lower levels of functioning. Third, DIF was observed across age groups, particularly for item related to sleepiness and physical function & wellbeing, which is plausible given that fatigue and mobility limitations generally increase with age. This DIF may reflect true age-related variation rather than measurement bias [22, 24]. However, it still suggests that the comparability of scores across age groups should be interpreted with caution. Lastly, because the metric was developed using nationally collected data, its application may be context-specific. Nevertheless, it remains conceptually aligned with the internationally recognized ICF framework, as it was constructed using items previously linked to ICF categories. Future studies are needed to evaluate its applicability across different population contexts.
Conclusion
This study developed a standardized, policy-relevant functioning metric for the Korean general population using national health data. By capturing lived health, the metric can generate a functioning indicator that complements the traditional health indicators of mortality and morbidity. The study highlights the value of repurposing routine survey data for monitoring population health. With growing demand for health assessment in ageing societies, this approach offers a sustainable strategy that strengthens international comparability and supports evidence-informed policy on population functioning.
The reference list from the paper itself. Each links out to its DOI / PubMed record.
- 1Kim KW Kim OS . Super Aging in South Korea Unstoppable but Mitigatable: A Sub-National Scale Population Projection for Best Policy Planning. Spat Demography (2020) 8(2):155–73. 10.1007/s 40980-020-00061-8 34222615 PMC 8248505 · doi ↗ · pubmed ↗
- 2Projected Population by Age Group (Korea) 2022–2072. Korean Statistical Information Service (KOSIS). Daejeon: Ministry of Data and Statistics (2023). Available online at: https://kosis.kr/stat Html/stat Html.do?sso=ok&returnurl=https%3A%2F%2Fkosis.kr%3A 443%2Fstat Html%2Fstat Html.do%3Flist_id%3DA 41_10%26obj_var_id%3D%26seq No%3D%26tbl Id%3DDT_1BPA 003%26vw_cd%3DMT_ETITLE%26language%3Den%26org Id%3D 101%26path%3D%252Feng%252Fstatistics List%252Fstatistics List Index.do%26conn_path%3DMT_ETITLE%26itm_id%3D%26l
- 3OECD/WHO. Health at a Glance: Asia/Pacific 2022: Measuring Progress Towards Universal Health Coverage. Paris: OECD Publishing (2022).
- 4Han E-J Han Z-A Kim H Jung TR . Monitoring Healthy Ageing for the next Decade: South Korea’s Perspective. Age and Ageing (2023) 52(Suppl. ment_4):iv 10–iv 2. 10.1093/ageing/afad 102 37902513 PMC 10615044 · doi ↗ · pubmed ↗
- 5Park B Ock M Lee HA Lee S Han H Jo M-W Multimorbidity and Health-Related Quality of Life in Koreans Aged 50 or Older Using KNHANES 2013–2014. Health Quality Life Outcomes (2018) 16:1–10. 10.1186/s 12955-018-1016-6 30219061 PMC 6139141 · doi ↗ · pubmed ↗
- 6Kjeldsen SE . Hypertension and Cardiovascular Risk: General Aspects. Pharmacol Research (2018) 129:95–9. 10.1016/j.phrs.2017.11.003 29127059 · doi ↗ · pubmed ↗
- 7Clynes MA Jameson KA Edwards MH Cooper C Dennison EM . Impact of Osteoarthritis on Activities of Daily Living: Does Joint Site Matter? Aging Clinical Experimental Research (2019) 31:1049–56. 10.1007/s 40520-019-01163-0 30903599 PMC 6661019 · doi ↗ · pubmed ↗
- 8Pisters M Veenhof C Van Dijk G Heymans M Twisk J Dekker J . The Course of Limitations in Activities over 5 Years in Patients with Knee and Hip Osteoarthritis with Moderate Functional Limitations: Risk Factors for Future Functional Decline. Osteoarthritis and Cartilage (2012) 20(6):503–10. 10.1016/j.joca.2012.02.002 22330176 · doi ↗ · pubmed ↗