Probiotic improves respiratory and gastrointestinal health, immune homeostasis, and gut microbiota composition in infants: a randomized controlled trial
Mageswaran Uma Mageswary, Lan Hanglian, Pin Li, Rocky Vester Richmond, Yusof Azianey, Joo Shun Tan, Min-Tze Liong, Adli Ali, Mishaleni Vejayantheran, Jiang Hua, He Jian, Intan Juliana Abd Hamid, Fahisham Taib, Yumei Zhang

TL;DR
A 12-week study found that a specific probiotic strain improved gut health and immune markers in infants, though respiratory benefits were not statistically significant.
Contribution
This study provides strain-specific evidence on the effects of B. infantis YLGB-1496 on infant gut microbiota and immune function.
Findings
B. infantis YLGB-1496 reduced gastrointestinal symptoms like diarrhea and stomach ache in infants.
The probiotic increased beneficial gut bacteria and immune markers like IL-10 while reducing harmful bacteria.
Placebo infants showed signs of gut dysbiosis, including increased pathobionts and reduced beneficial species.
Abstract
The early postnatal period is a critical window for shaping the gut microbiota, which plays a pivotal role in immune maturation, infection resistance, and metabolic programming. Disruptions to this process may predispose infants to infections and allergic or metabolic disorders. Probiotics such as Bifidobacterium infantis have shown promise in modulating gut microbial ecology and immune function, but strain-specific and mechanistic evidence in infants remains limited. This study aimed to evaluate the effects of B. infantis YLGB-1496 supplementation on clinical outcomes, immune markers, and gut microbiota composition in healthy infants below one year of age. In a 12-week, randomized, double-blind, placebo-controlled trial, 119 healthy infants were enrolled (B. infantis YLGB-1496 n=59, placebo n=60). Participants received one daily sachet of B. infantis YLGB-1496 (1 × 10¹⁰ CFU) or…
Genes, proteins, chemicals, diseases, species, mutations and cell lines named across the full text — each resolved to its canonical identifier and authoritative record.
Click any figure to enlarge with its caption.
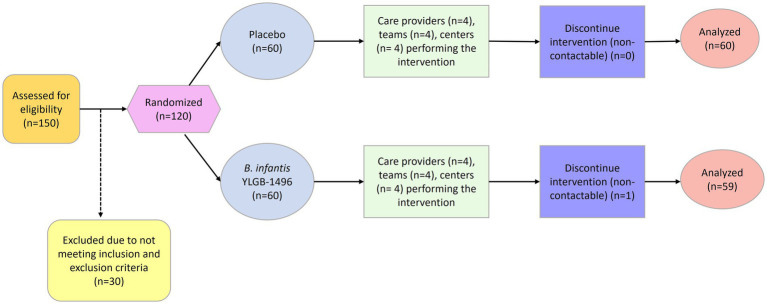 Figure 1
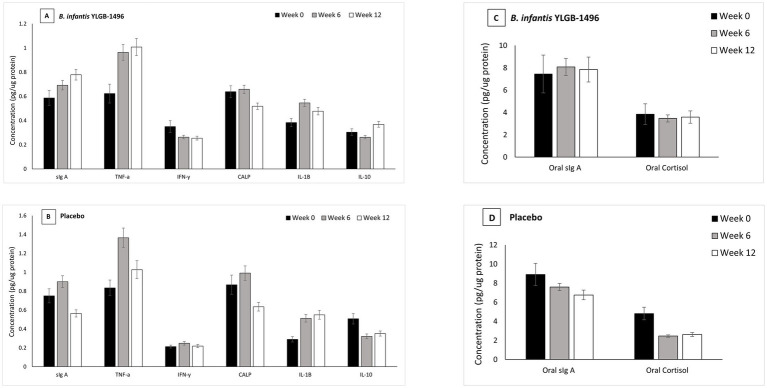 Figure 2
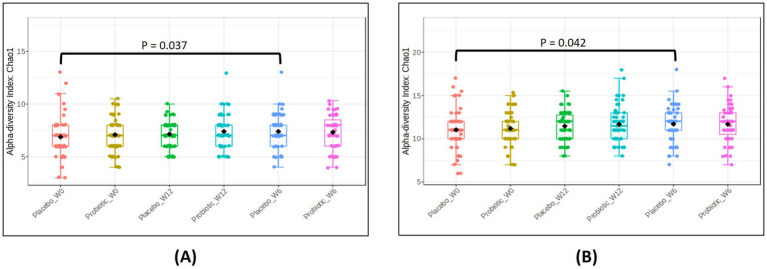 Figure 3
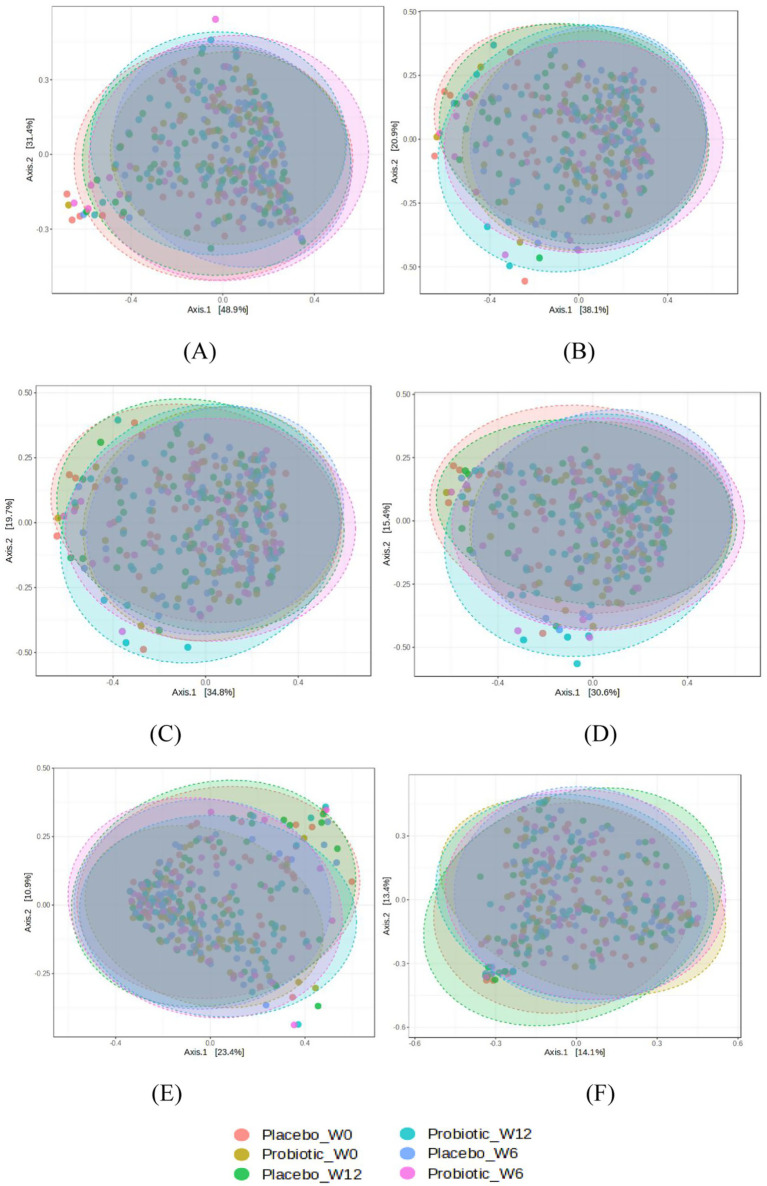 Figure 4
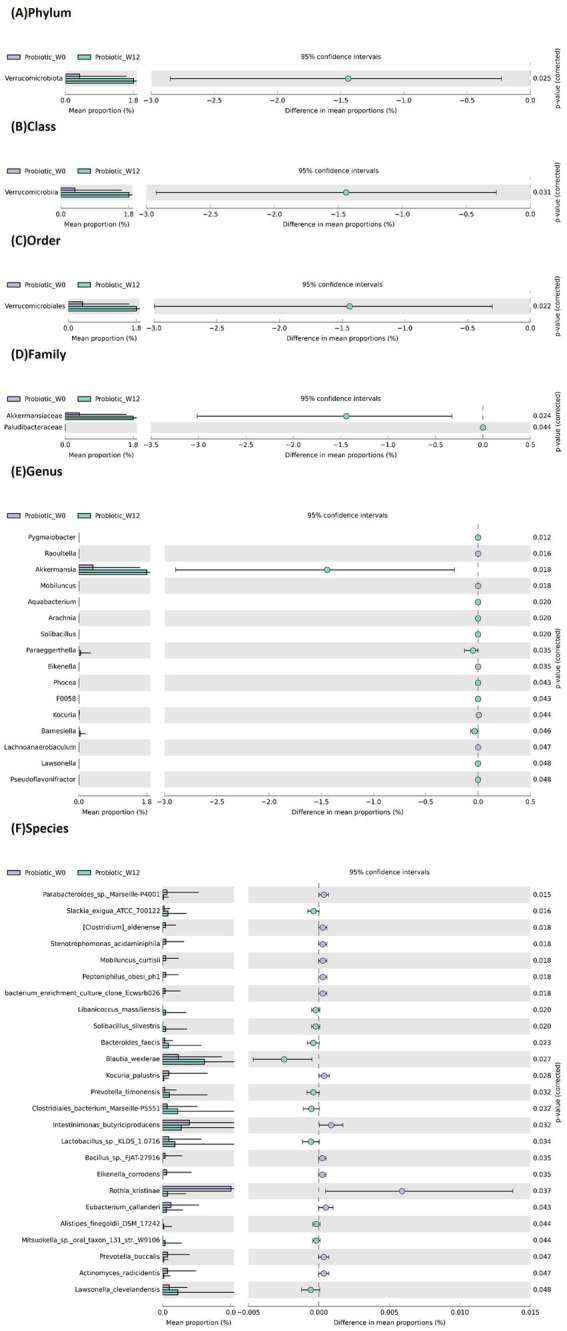 Figure 5
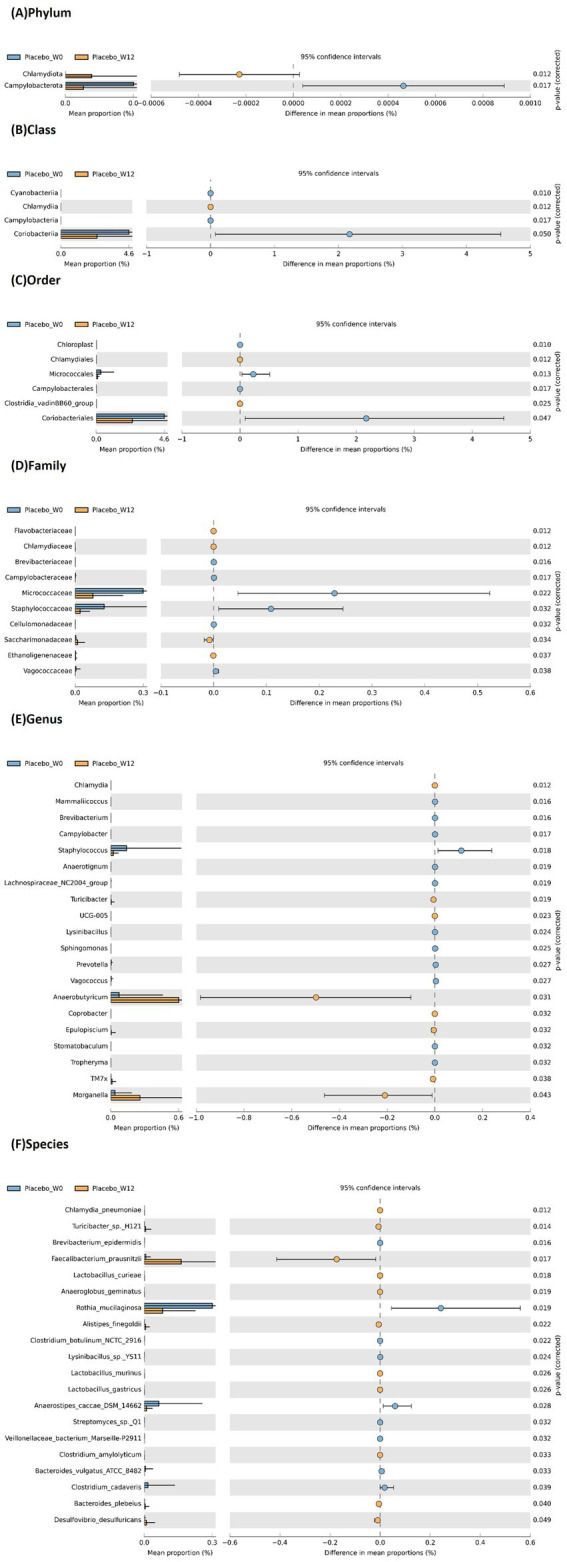 Figure 6
| Baseline Characteristics | Placebo | ||
|---|---|---|---|
| Sample size ( | 60 | 59 | |
| Gender, % ( | |||
| Male | 52% ( | 37% ( | 0.115* |
| Female | 48% ( | 63% (37) | |
| Age (months) | 7.333 ± 0.408 | 8.119 ± 0.36 | 0.200 |
| Body weight (kg) | 7.795 ± 0.311 | 7.74 ± 0.252 | 0.645 |
| Height (cm) | 69.407 ± 1.381 | 68.33 ± 1.102 | 0.827 |
| BMI | 16.145 ± 0.369 | 16.28 ± 0.361 | 0.712 |
| Smokers in family | 0.3 ± 0.06 | 0.25 ± 0.057 | 0.579 |
| Defecation frequency (per week) | 9.775 ± 1.103 | 8.02 ± 0.813 | 0.390 |
| History of food allergy | 0.083 ± 0.036 | 0.12 ± 0.042 | 0.524 |
| Antibiotic intake | 0.033 ± 0.023 | 0.03 ± 0.024 | 0.986 |
| Incidence of diarrhea for the past 12 months | 0.408 ± 0.141 | 0.43 ± 0.14 | 0.552 |
| Incidence of RTI for the past 12 months | 0.117 ± 0.048 | 0.73 ± 0.412 | 0.085 |
| Hospitalization for the past 12 months | 0.35 ± 0.114 | 0.31 ± 0.081 | 0.723 |
| Supplement intake | 0.1 ± 0.039 | 0.17 ± 0.049 | 0.269 |
| Dairy products consumption | 0.333 ± 0.061 | 0.22 ± 0.054 | 0.170 |
| Having pets at home | 0.333 ± 0.061 | 0.22 ± 0.054 | 0.170 |
| Parameters | Week 0 | Week 6 | Week 12 | |||||||||
|---|---|---|---|---|---|---|---|---|---|---|---|---|
| Placebo | Placebo | Placebo | ||||||||||
| Past month respiratory problems | ||||||||||||
| Yes ( | 12.20% | 10.17% | 0.668* | 0.668 | 11.18% | 6.10% | 0.203* | 0.305 | 10.17% | 4.7% | 0.094* | 0.282 |
| No ( | 48.80% | 49.83% | 49.82% | 53.90% | 50.83% | 55.93% | ||||||
| Clinical visit for respiratory problems in the past month | ||||||||||||
| Yes ( | 9.15% | 8.14% | 0.822* | 0.976 | 6.10% | 6.105 | 0.976* | 0.976 | 8.13% | 4.7% | 0.235* | 0.705 |
| No ( | 51.85% | 51.86% | 54.90% | 53.90% | 50.83% | 55.93% | ||||||
| Antibiotic use for respiratory problems in the past month | ||||||||||||
| Yes ( | 5.8% | 3.5% | 0.479* | 0.986 | 2.3% | 2.3% | 0.986* | 0.986 | 4.7% | 3.5% | 0.714* | 0.986 |
| No ( | 55.92% | 56.95% | 58.96% | 57.96% | 56.93% | 56.95% | ||||||
| Number of days with respiratory symptoms (per week) in the past month | ||||||||||||
| Fever | 0.35 ± 0.124 | 0.356 ± 0.126 | 0.969 | 0.969 | 0.517 ± 0.168 | 0.22 ± 0.088 | 0.498 | 0.560 | 0.5 ± 0.204 | 0.186 ± 0.1 | 0.473 | 0.559 |
| Cough | 0.858 ± 0.238 | 0.661 ± 0.228 | 0.623 | 0.652 | 0.992 ± 0.292 | 0.212 ± 0.137 | 0.023 | 0.149 | 0.867 ± 0.264 | 0.076 ± 0.043 | 0.031 | 0.149 |
| Sneezing | 0.825 ± 0.243 | 0.39 ± 0.149 | 0.202 | 0.293 | 0.625 ± 0.206 | 0.314 ± 0.17 | 0.118 | 0.252 | 0.933 ± 0.297 | 0.102 ± 0.05 | 0.069 | 0.208 |
| Nose block | 0.975 ± 0.287 | 0.576 ± 0.214 | 0.564 | 0.604 | 0.75 ± 0.258 | 0.263 ± 0.168 | 0.046 | 0.149 | 0.767 ± 0.232 | 0.161 ± 0.098 | 0.037 | 0.149 |
| Wheezing | 0.025 ± 0.025 | 0.203 ± 0.115 | 0.291 | 0.397 | 0.258 ± 0.138 | 0.144 ± 0.121 | 0.26 | 0.365 | 0.45 ± 0.182 | 0.051 ± 0.036 | 0.132 | 0.258 |
| Sore throat | 0.125 ± 0.054 | 0.068 ± 0.068 | 0.107 | 0.240 | 0.325 ± 0.152 | 0.144 ± 0.121 | 0.155 | 0.286 | 0.325 ± 0.176 | 0.051 ± 0.036 | 0.392 | 0.491 |
| Runny nose | 0.958 ± 0.268 | 0.466 ± 0.151 | 0.484 | 0.559 | 0.708 ± 0.22 | 0.339 ± 0.171 | 0.186 | 0.288 | 0.775 ± 0.243 | 0.229 ± 0.117 | 0.083 | 0.213 |
| Poor appetite | 0.7 ± 0.242 | 0.144 ± 0.079 | 0.08 | 0.213 | 0.408 ± 0.147 | 0.195 ± 0.085 | 0.524 | 0.575 | 0.625 ± 0.224 | 0.144 ± 0.079 | 0.129 | 0.258 |
| Hoarseness | 0.625 ± 0.242 | 0.28 ± 0.121 | 0.695 | 0.710 | 0.433 ± 0.173 | 0.119 ± 0.119 | 0.034 | 0.149 | 0.367 ± 0.162 | 0 ± 0 | 0.013 | 0.149 |
| Body ache | 0.025 ± 0.025 | 0 ± 0 | 0.321 | 0.425 | 0.283 ± 0.166 | 0.119 ± 0.119 | 0.183 | 0.288 | 0.417 ± 0.208 | 0 ± 0 | 0.045 | 0.149 |
| Fatigue | 0.492 ± 0.228 | 0.068 ± 0.068 | 0.095 | 0.226 | 0.208 ± 0.101 | 0.119 ± 0.076 | 0.478 | 0.559 | 0.367 ± 0.162 | 0 ± 0 | 0.013 | 0.149 |
| Vomiting | 0.542 ± 0.229 | 0.076 ± 0.043 | 0.176 | 0.288 | 0.308 ± 0.109 | 0.093 ± 0.072 | 0.032 | 0.149 | 0.172 ± 0.084 | 0 ± 0 | 0.022 | 0.149 |
| Headache | 0.05 ± 0.035 | 0 ± 0 | 0.159 | 0.286 | 0.258 ± 0.105 | 0.119 ± 0.076 | 0.2 | 0.293 | 0.267 ± 0.13 | 0 ± 0 | 0.045 | 0.149 |
| Thick mucus | 0.75 ± 0.242 | 0.415 ± 0.15 | 0.335 | 0.431 | 0.558 ± 0.198 | 0.144 ± 0.079 | 0.085 | 0.213 | 0.742 ± 0.248 | 0.051 ± 0.036 | 0.014 | 0.149 |
| Pain swallowing | 0.492 ± 0.228 | 0 ± 0 | 0.024 | 0.149 | 0.342 ± 0.134 | 0.068 ± 0.068 | 0.032 | 0.149 | 0.275 ± 0.149 | 0.025 ± 0.025 | 0.171 | 0.288 |
| Parameters | Week 0 | Week 6 | Week 12 | |||||||||
|---|---|---|---|---|---|---|---|---|---|---|---|---|
| Placebo | Placebo | Placebo | ||||||||||
| Number of days with gastrointestinal symptoms (per week) in the past month | ||||||||||||
| Period (days) for stomach discomfort (such as flatulence and bloating) per week | 0.450 ± 0.128 | 0.686 ± 0.163 | 0.158 | 0.194 | 1.608 ± 0.248 | 0.424 ± 0.104 | 0.001 | 0.002 | 0.625 ± 0.162 | 0.364 ± 0.114 | 0.336 | 0.386 |
| Period (days) for stomach ache per week | 0.267 ± 0.092 | 0.424 ± 0.138 | 0.332 | 0.386 | 1.333 ± 0.228 | 0.398 ± 0.102 | 0.007 | 0.011 | 0.850 ± 0.162 | 0.339 ± 0.112 | 0.005 | 0.010 |
| Defecation times per week | 10.283 ± 0.838 | 9.653 ± 0.735 | 0.858 | 0.891 | 9.633 ± 0.922 | 14.017 ± 1.343 | 0.028 | 0.042 | 10.833 ± 0.835 | 16.576 ± 1.202 | 0.001 | 0.002 |
| Occurrence of diarrhea in the past month | ||||||||||||
| Yes ( | 20.33% | 11.19% | 0.068* | 0.068 | 22.37% | 8.14% | 0.004* | 0.006 | 23.38% | 6.10% | <0.001* | <0.001 |
| No ( | 40.66% | 48.81% | 38.63% | 51.86% | 37.62% | 53.90% | ||||||
| Past month diarrhea incident (number of times per child) | 0.633 ± 0.139 | 0.458 ± 0.166 | 0.021 | 0.032 | 0.650 ± 0.116 | 0.305 ± 0.124 | 0.004 | 0.008 | 0.650 ± 0.114 | 0.203 ± 0.110 | <0.001 | <0.001 |
| Past month clinical visit due to diarrhea incident (number of times per child) | 0.467 ± 0.077 | 0.186 ± 0.051 | 0.005 | 0.009 | 0.383 ± 0.068 | 0.136 ± 0.045 | 0.004 | 0.007 | 0.517 ± 0.081 | 0.085 ± 0.037 | <0.001 | <0.001 |
| Number of days with gastrointestinal symptoms (per week) in the past month | ||||||||||||
| Fever | 0.800 ± 0.166 | 0.136 ± 0.070 | 0.001 | 0.002 | 0.708 ± 0.143 | 0.085 ± 0.061 | <0.001 | <0.001 | 1.108 ± 0.189 | 0.119 ± 0.073 | <0.001 | <0.001 |
| Vomit | 0.550 ± 0.115 | 0.051 ± 0.029 | <0.001 | 0.001 | 0.55 ± 0.115 | 0.110 ± 0.079 | 0.001 | 0.002 | 0.242 ± 0.105 | 0.076 ± 0.076 | 0.06 | 0.083 |
| Dysentry | 0.00 ± 0.00 | 0.034 ± 0.024 | 0.152 | 0.191 | 0.00 ± 0.00 | 0.00 ± 0.00 | 1 | 1.000 | 0.00 ± 0.00 | 0.00 ± 0.00 | 1 | 1.000 |
| Stomachache | 0.342 ± 0.108 | 0.254 ± 0.089 | 0.507 | 0.570 | 0.925 ± 0.183 | 0.136 ± 0.066 | 0.001 | 0.002 | 1.117 ± 0.197 | 0.119 ± 0.064 | <0.001 | <0.001 |
| Nausea | 0.017 ± 0.017 | 0.034 ± 0.024 | 0.551 | 0.607 | 0.833 ± 0.173 | 0.034 ± 0.034 | <0.001 | <0.001 | 0.200 ± 0.097 | 0.00 ± 0.00 | 0.045 | 0.063 |
| Loss of appetite | 1.092 ± 0.209 | 0.119 ± 0.064 | <0.001 | 0.001 | 0.933 ± 0.200 | 0.102 ± 0.052 | <0.001 | 0.002 | 0.441 ± 0.173 | 0.034 ± 0.034 | 0.015 | 0.024 |
| Fatigue | 0.608 ± 0.148 | 0.119 ± 0.060 | 0.001 | 0.002 | 0.833 ± 0.173 | 0.051 ± 0.038 | <0.001 | <0.001 | 0.825 ± 0.163 | 0.051 ± 0.038 | <0.001 | <0.001 |
| Dizziness | 0.050 ± 0.037 | 0.017 ± 0.017 | 0.564 | 0.609 | 0.800 ± 0.173 | 0.00 ± 0.00 | <0.001 | <0.001 | 0.200 ± 0.115 | 0.00 ± 0.00 | 0.083 | 0.108 |
| Headache | 0.050 ± 0.037 | 0.034 ± 0.034 | 0.577 | 0.611 | 0.783 ± 0.170 | 0.00 ± 0.00 | <0.001 | <0.001 | 0.175 ± 0.101 | 0.00 ± 0.00 | 0.083 | 0.108 |
| Dehydration | 0.117 ± 0.068 | 0.153 ± 0.063 | 0.21 | 0.252 | 0.875 ± 0.183 | 0.034 ± 0.034 | <0.001 | <0.001 | 0.375 ± 0.146 | 0.00 ± 0.00 | 0.007 | 0.012 |
| Rectal discomfort | 0.050 ± 0.037 | 0.153 ± 0.063 | 0.084 | 0.108 | 0.283 ± 0.059 | 0.00 ± 0.00 | <0.001 | <0.001 | 0.183 ± 0.107 | 0.00 ± 0.00 | 0.045 | 0.063 |
| Past month diarrhea incident (number of days) | 0.800 ± 0.132 | 0.356 ± 0.107 | 0.006 | 0.010 | 0.783 ± 0.141 | 0.288 ± 0.114 | 0.003 | 0.007 | 1.233 ± 0.188 | 0.271 ± 0.120 | <0.001 | <0.001 |
| Past month diarrhea incident (frequency per day) | 1.350 ± 0.228 | 0.407 ± 0.121 | 0.002 | 0.003 | 1.350 ± 0.236 | 0.322 ± 0.122 | 0.001 | 0.003 | 1.333 ± 0.200 | 0.322 ± 0.140 | <0.001 | <0.001 |
| Protein markers | Week 0 | Week 6 | Week 12 | ||
|---|---|---|---|---|---|
| Placebo | |||||
| Fecal | |||||
| Ig A | 0.751 ± 0.074 | 0.9 ± 0.063 | 0.564 ± 0.038 | 0.003 | <0.001 |
| TNF-a | 0.835 ± 0.083 | 1.366 ± 0.102 | 1.028 ± 0.095 | <0.001 | <0.001 |
| IFN | 0.213 ± 0.016 | 0.248 ± 0.019 | 0.218 ± 0.017 | 0.018 | 0.016 |
| Calprotectin | 0.868 ± 0.102 | 0.991 ± 0.076 | 0.635 ± 0.046 | 0.017 | <0.001 |
| IL-1B | 0.29 ± 0.029 | 0.513 ± 0.04 | 0.549 ± 0.047 | <0.001 | 0.193 |
| IL-10 | 0.508 ± 0.055 | 0.321 ± 0.026 | 0.351 ± 0.027 | <0.001 | 0.014 |
| Oral | |||||
| Oral Ig A | 8.902 ± 1.167 | 7.592 ± 0.372 | 6.76 ± 0.498 | 0.831 | 0.047 |
| Oral Cortisol | 4.816 ± 0.661 | 2.462 ± 0.124 | 2.614 ± 0.216 | <0.001 | 0.797 |
| Fecal | |||||
| Ig A | 0.587 ± 0.061 | 0.692 ± 0.039 | 0.779 ± 0.044 | 0.002 | 0.138 |
| TNF-a | 0.623 ± 0.078 | 0.964 ± 0.066 | 1.008 ± 0.071 | <0.001 | 0.824 |
| IFN | 0.35 ± 0.049 | 0.263 ± 0.015 | 0.254 ± 0.016 | 0.929 | 0.187 |
| Calprotectin | 0.639 ± 0.048 | 0.658 ± 0.034 | 0.518 ± 0.027 | 0.146 | <0.001 |
| IL-1B | 0.383 ± 0.034 | 0.546 ± 0.03 | 0.477 ± 0.031 | <0.001 | 0.002 |
| IL-10 | 0.304 ± 0.027 | 0.262 ± 0.014 | 0.368 ± 0.024 | 0.284 | <0.001 |
| Oral | |||||
| Oral Ig A | 7.448 ± 1.688 | 8.085 ± 0.764 | 7.849 ± 1.115 | 0.001 | 0.411 |
| Oral Cortisol | 3.842 ± 0.932 | 3.463 ± 0.312 | 3.582 ± 0.552 | 0.002 | 0.634 |
Peer Reviews
No public reviews on file for this paper yet. If you reviewed it on a platform where reviews are public (OpenReview, ICLR, NeurIPS, ICML), you can paste yours below so the community can read it here.
Videos
No videos yet. Explain this paper in a talk, walkthrough, or lecture? Add one.
Taxonomy
TopicsGut microbiota and health · Probiotics and Fermented Foods · Infant Nutrition and Health
Introduction
1
The early postnatal period is a decisive phase for the establishment of the human gut microbiota, a dynamic microbial ecosystem that profoundly influences physiological, metabolic, and immune development. During this critical window, microbial colonization interacts continuously with host epithelial and immune maturation, contributing to nutrient metabolism, protection against pathogens, and education of immune tolerance mechanisms (1). The trajectory of this colonization process, particularly during the first year of life, has lifelong health implications. Deviations from normal microbial succession have been linked to heightened susceptibility to respiratory tract infections (RTI), allergies, metabolic disturbances, and immune-mediated diseases later in life (2).
Several factors can perturb this delicate microbial assembly, including delivery mode, antibiotic exposure, formula feeding, and environmental hygiene. Infants delivered via Caesarean section or exposed to antibiotics often exhibit reduced Bifidobacterium abundance, slower microbial maturation, and greater colonization by opportunistic taxa. These alterations correlate with impaired mucosal immunity and increased risk of infection. Consequently, interventions that can favorably modulate the gut microbiota during infancy have become an important focus of preventive health strategies.
Probiotics are defined as live microorganisms that confer a health benefit when administered in adequate amounts and represent a promising means of restoring microbial balance and supporting immune development (3). Among the diverse probiotic genera, Bifidobacterium species play a particularly crucial role in early life. These bacteria dominate the healthy infant gut, metabolize human milk oligosaccharides, and produce short-chain fatty acids (SCFAs) that reinforce epithelial integrity and regulate local immune responses (4). However, probiotic effects are highly strain-specific, and their clinical outcomes depend strongly on the host’s baseline microbiota composition, which is notably variable in infants (5).
While numerous studies have documented the clinical benefits of probiotics in reducing infectious diarrhea and antibiotic-associated dysbiosis in children (6, 7), the precise microbial mechanisms underlying these effects remain incompletely defined. Most investigations have focused on broad taxonomic changes at the genus level, overlooking specific compositional shifts that may drive physiological improvements. Understanding which bacterial taxa are selectively enriched or suppressed by particular probiotic strains is essential to elucidate their mechanisms of action and guide the rational selection of effective probiotic interventions.
Bifidobacterium infantis is one of the earliest colonizers of the human gut and exhibits unique adaptations to the infant gastrointestinal environment (8). It efficiently metabolizes milk-derived glycans and produces acetate and lactate, metabolites that acidify the intestinal milieu, suppress pathogens, and promotes the growth of commensal anaerobes. Emerging evidence suggests that B. infantis also exerts immunomodulatory effects by promoting secretory IgA (sIgA) production and enhancing anti-inflammatory cytokines, such as IL-10 (9). Nevertheless, there remains a paucity of randomized controlled trials evaluating specific B. infantis strains in healthy infants under 1 year of age, particularly those linking clinical benefits to detailed microbiota changes and immunological markers.
The current study was therefore designed to comprehensively assess the effects of Bifidobacterium infantis YLGB-1496 on clinical outcomes, immune parameters, and gut microbiota composition in healthy infants aged below 1 year. The strain was isolated from the breast milk of a healthy mother (10). We hypothesized that B. infantis YLGB-1496 would reduce GI infection symptoms and RTI symptoms, balance mucosal immune markers, and promote beneficial gut microbes. Using clinical and microbiome analyses, we aimed to show how probiotics support microbial and immune maturation during early life, a critical period for lifelong health.
Materials and methods
2
Study design and ethics
2.1
This study was a randomized, double-blind, placebo-controlled clinical trial evaluating the effects of B. infantis YLGB-1496 on gut microbiota composition, immune biomarkers, and clinical health outcomes in infants under 1 year of age. The trial adhered to the principles of the Declaration of Helsinki and the International Council for Harmonisation Good Clinical Practice (ICH-GCP) guidelines. Ethical approval was obtained from the Universiti Kebangsaan Malaysia (UKM) Research Ethics Committee (Approval No. UKM/PPI/111/8/JEP-2023-074). The study was prospectively registered at ClinicalTrials.gov on 20 March 2023 (Identifier: NCT05794815). Written informed consent was obtained from all parents or legal guardians before enrolment.
Study population and randomization
2.2
Healthy infants aged below 1 year were recruited through the UKM campus community and affiliated outreach programs. Inclusion criteria were (i) current weight between the 20th and 80th percentile on the national growth chart; (ii) regular consumption of standard infant formula without probiotic fortification; and (iii) parental commitment to study compliance. Exclusion criteria included chronic diseases, congenital abnormalities, long-term medication (>6 months), maternal metabolic or chronic illnesses, recent antibiotic use (<2 weeks before intervention), intake of probiotic or prebiotic supplements (other than permitted galactooligosaccharide <2 g/100 g in formula), food allergies, participation in other clinical studies within 4 weeks, or known hypersensitivity to study products.
Randomization was computer-generated in a 1:1 ratio (probiotic vs. placebo) by an independent statistician with no contact with participants. Allocation was concealed until study completion. Both investigators and participants were blinded to treatment assignment. A total of 150 infants were screened, 120 met eligibility criteria and were randomized (B. infantis YLGB-1496 n = 60, placebo n = 60). One participant in the B. infantis YLGB-1496 arm was lost to follow-up, resulting in 119 evaluable subjects (Figure 1).
Flowchart shows the study enrollment, randomization, intervention, and follow-up processes. 150 infants screened, 120 were randomized equally into probiotic and placebo groups. One subject from the probiotic arm withdrew, resulting in 119 completing the study. No adverse events occurred. CONSORT diagram adapted to reflect participant disposition and analysis inclusion for the intention-to-treat cohort.
Intervention
2.3
The probiotic product contained B. infantis YLGB-1496 (1 × 10^10^ CFU per sachet) formulated as a light-yellow powder with a carrier matrix identical to that of the placebo, which contained only the carrier. Both products were identical in appearance, odor, and packaging, and stored at temperatures below 25 °C. Infants received one sachet per day for 12 consecutive weeks. Parents were instructed to mix the powder with lukewarm water or milk immediately before consumption.
Sample size and power calculation
2.4
Sample size was estimated for a parallel-arm design comparing continuous outcomes between two independent groups with 95% power and α = 0.05. Based on prior probiotic trials showing reductions in RTI-related clinical visits (11), 55 subjects per group were required. Accounting for a 10% attrition rate, 120 subjects were targeted for recruitment (n = 60 per arm).
Data collection and questionnaires
2.5
Validated and Malay-translated questionnaires (12) were administered at baseline (week 0), week 6, and week 12 to record demographic data, feeding history, and health outcomes, such as frequency and severity of RTI and GI infection symptoms, diarrhea episodes, clinical visits, and antibiotic use. All questionnaires were completed by parents under supervision from trained study personnel.
Sample collection
2.6
Oral swabs and fecal samples were collected at week 0, 6, and 12. Oral swabs were taken from the inner cheek (left and right) and stored at −80 °C for subsequent measurement of cortisol and secretory IgA (sIgA). Parents collected stool samples using sterile tubes containing RNAlater™ solution (Thermo Fisher Scientific, Waltham, MA, USA) and glass beads, stored at −80 °C until analysis. These were used for cytokine quantification and microbiota profiling.
Immunological and biochemical analyses
2.7
The preparation of fecal samples involved homogenization in phosphate-buffered saline and centrifugation (3,000× rpm, 20 min, 4 °C). The supernatant from this process was used for analysis. Oral swab samples were eluted in PBS by vortexing for 30 min, followed by centrifugation to collect the eluent. Fecal concentrations of sIgA, calprotectin, tumor necrosis factor-α (TNF-α), interferon-γ (IFN-γ), interleukin (IL)-1β, and IL-10 were quantified using commercial enzyme-linked immunosorbent assay (ELISA) kits (Elabscience, Hubei, Wuhan, China) according to manufacturer protocols. Oral samples were assayed for cortisol and sIgA using the same platform. All measurements were performed in duplicate, and intra-assay variability <10% was accepted as quality control. The absorbance was measured at 450 nm using a microplate reader (Multiskan Go, Thermo Fisher Scientific, Waltham, MA, USA).
Microbiota profiling
2.8
DNA was extracted from fecal samples following established protocols (13) and quantified using a NanoDrop 2000 UV–Vis spectrophotometer (Thermo Fisher Scientific, Waltham, MA, USA). The V3–V4 regions of the bacterial 16S rRNA gene were amplified using primers:
341F (5-CCTAYGGGRBGCASCAG-3)806R (5-GGACTACHVGGGTWTCTAAT-3)
PCR reactions were performed in triplicate (20 μL volume) under the following cycling conditions: 95 °C for 3 min; 27 cycles of 95 °C for 30 s, 55 °C for 30 s, 72 °C for 45 s; and a final extension at 72 °C for 10 min. Amplicons were purified using the AxyPrep DNA Gel Extraction Kit (Axygen Biosciences, Corning, NY, USA), quantified using QuantiFluor™-ST (Promega Corporation, Madison, WI, USA), and sequenced (2 × 300 bp) on an Illumina MiSeq platform (Illumina, Inc., San Diego, CA, USA).
Raw FASTQ files were quality-filtered using Trimmomatic and merged by USEARCH v10.0. Operational taxonomic units (OTUs) were clustered at 97% sequence similarity using UPARSE. Taxonomic assignments were performed using the RDP Classifier against the SILVA 132 database (80% confidence threshold). Downstream analyses, including α- and β-diversity and differential abundance testing, were conducted in MicrobiomeAnalyst (phyloseq R package, v3.6.1) and STAMP v2.1.3.
Statistical analyses
2.9
All analyses followed an intention-to-treat approach using SPSS version 20.0 (IBM SPSS, Chicago, USA). Continuous variables were assessed using the Mann–Whitney U test due to non-parametric distribution; categorical data were compared with the chi-squared test. Within-group longitudinal comparisons were performed using the Wilcoxon signed-rank test. All tests were two-tailed with significance defined at p < 0.05. Data are reported as mean ± standard error unless otherwise specified.
Results
3
Participant flow and baseline characteristics
3.1
Of 150 infants screened, 120 met the eligibility criteria and were randomized equally to the B. infantis YLGB-1496 (n = 60) or placebo (n = 60) arms (Figure 1). One infant from the B. infantis YLGB-1496 group was lost to follow-up, leaving 119 participants (B. infantis YLGB-1496 n = 59; placebo n = 60) who completed the 12-week intervention. No adverse events or product-related complications were reported.
Baseline demographic and anthropometric characteristics were comparable between groups (Table 1). There were no significant differences in age, gender distribution, body weight, height, body mass index (BMI), or socioeconomic parameters (p > 0.05 for all). Lifestyle and environmental exposures, including household smoking, pet ownership, and dietary intake, were balanced between groups, indicating a homogenous study population. This ensured that observed outcomes were attributable to the intervention rather than pre-existing disparities.
Respiratory health outcomes
3.2
Respiratory health outcomes were evaluated longitudinally over 12 weeks, with between-group comparisons performed at weeks 0, 6, and 12. Continuous variables were analyzed using the Mann–Whitney U test and categorical variables using the chi-squared test. All p-values were adjusted for multiple comparisons using the Benjamini–Hochberg false discovery rate (FDR) procedure (Table 2).
At baseline, no statistically significant differences were observed between the placebo and B. infantis YLGB-1496 groups for any RTI outcome after FDR adjustment. Event-level outcomes, such as past-month RTI problems (q = 0.668), clinical visits for respiratory illness (q = 0.976), and antibiotic use (q = 0.986), were comparable between groups.
By Week 6, several respiratory symptoms showed numerically fewer symptomatic days in the B. infantis YLGB-1496 group, including cough (q = 0.149), nasal congestion (q = 0.149), hoarseness (q = 0.149), and vomiting (q = 0.149); however, none of these differences reached statistical significance after FDR adjustment. Similarly, event-level outcomes remained non-significant following correction, including past-month respiratory problems (q = 0.305), clinical visits (q = 0.976), and antibiotic use (q = 0.986).
At Week 12, the B. infantis YLGB-1496 group continued to demonstrate numerically lower symptom days for several respiratory complaints, including cough (q = 0.149), nasal congestion (q = 0.149), hoarseness (q = 0.149), body ache (q = 0.149), fatigue (q = 0.149), vomiting (q = 0.149), headache (q = 0.149), and thick mucus (q = 0.149). Nonetheless, all adjusted p-values exceeded the predefined FDR significance threshold, and no respiratory outcome demonstrated a statistically significant between-group difference after correction for multiple testing.
Overall, while directional reductions in respiratory symptom burden were observed in the B. infantis YLGB-1496 group over time, and these effects did not remain statistically significant after FDR adjustment, indicating that respiratory benefits were not robust when controlling for multiple comparisons.
Gastrointestinal health
3.3
Gastrointestinal (GI) outcomes were assessed using the same analytical approach, with p-values adjusted for multiple comparisons using the Benjamini–Hochberg FDR method (Table 3).
At baseline, GI infection symptom frequency and event-level outcomes were comparable between groups, with no significant differences observed after FDR adjustment. By Week 6, infants receiving B. infantis YLGB-1496 exhibited significant reductions in days with stomach discomfort (q = 0.002) and stomach ache (q = 0.011), alongside a significant increase in defecation frequency (q = 0.042). The incidence of diarrhea was significantly lower in the B. infantis YLGB-1496 group (q = 0.006), accompanied by fewer diarrhea episodes per child (q = 0.008) and fewer diarrhea-related clinical visits (q = 0.007).
By Week 12, these improvements were further strengthened. The B. infantis YLGB-1496 group reported significantly fewer days with stomach ache (q = 0.010), loss of appetite (q = 0.024), fatigue (q < 0.001), fever (q < 0.001), nausea (q = 0.063), dehydration (q = 0.012), and rectal discomfort (q = 0.063). Bowel regularity continued to improve, with higher defecation frequency (q = 0.002). Diarrhea outcomes remained strongly favorable, with lower incidence (q < 0.001), reduced episode frequency (q < 0.001), shorter duration (q < 0.001), and fewer clinical visits (q < 0.001).
Overall, gastrointestinal outcomes demonstrated consistent, clinically meaningful, and statistically robust improvements in the B. infantis YLGB-1496 group that persisted after correction for multiple testing.
Immune and stress biomarkers
3.4
Fecal markers
3.4.1
Distinct immunological trajectories were observed between groups (Table 4; Figures 2A,B). Both groups showed initial increases in fecal sIgA from baseline to Week 6 (placebo p = 0.003; B. infantis YLGB-1496 p = 0.002). Thereafter, sIgA levels declined sharply in the placebo group (p < 0.001) but remained elevated in the B. infantis YLGB-1496 arm (p = 0.138).
Fecal and oral immune and inflammatory biomarkers measured by ELISA in children receiving probiotic or placebo treatment over 12 weeks. (A) Fecal biomarkers (secretory IgA [sIgA], tumor necrosis factor-α [TNF-α], interferon-γ [IFN-γ], calprotectin [CALP], interleukin-1β [IL-1β], and interleukin-10 [IL-10]) in the B. infantis YLGB-1496 group. (B) Corresponding fecal biomarkers in the placebo group. (C) Oral sIgA and cortisol concentrations in the B. infantis YLGB-1496 group. (D) Oral sIgA and cortisol concentrations in the placebo group. Data are presented as mean ± SEM at Week 0, Week 6, and Week 12. Statistical analyses and exact p-values for all comparisons are provided in Table 4.
TNF-α increased in both groups up to Week 6 (p < 0.001) but declined in the placebo group thereafter (p < 0.001), while remaining stable in the B. infantis YLGB-1496 group (p = 0.824). IFN-γ fluctuated in the placebo group (rise to Week 6, p = 0.018; fall to Week 12, p = 0.016) but remained stable in the B. infantis YLGB-1496 arm (p > 0.05).
B. infantis YLGB-1496 supplementation maintained immune homeostasis with reduced volatility across pro-inflammatory markers. IL-10, a key anti-inflammatory cytokine, increased significantly between Weeks 6 and 12 in the B. infantis YLGB-1496 group (p < 0.001) but decreased in the placebo group (p = 0.014). Conversely, IL-1β and calprotectin levels declined significantly in the B. infantis YLGB-1496 arm by Week 12 (p = 0.002 and p < 0.001, respectively), further supporting an anti-inflammatory shift.
Oral markers
3.4.2
Oral immune responses mirrored fecal patterns (Table 4; Figures 2C,D). Oral sIgA increased significantly from Week 0 to Week 6 in the B. infantis YLGB-1496 group (p = 0.001) and was maintained through Week 12 (p = 0.411), whereas the placebo group exhibited a reduction by Week 12 (p = 0.047). Oral cortisol levels decreased significantly from baseline to Week 6 in both groups (placebo p = 0.000; B. infantis YLGB-1496 p = 0.002) and remained stable thereafter, suggesting that the observed immune effects were not attributable to stress differences.
Overall, B. infantis YLGB-1496 elicited a balanced immune response characterized by sustained mucosal antibody defense (sIgA), reduced inflammatory volatility (IL-1β, TNF-α), and upregulated regulatory cytokines (IL-10), indicating improved mucosal immune equilibrium.
Alpha and Beta diversity of gut microbiota
3.5
Microbial diversity analyses revealed subtle but biologically relevant patterns (Figures 3, 4).
Alpha diversity plots for fecal microbiota at baseline (week-0), week-6 and end of study (week-12), upon administration of probiotic B. infantis YLGB-1496 or placebo. Differences in diversity within group as measured by the Chao1 index for (A) phylum, and (B) class. The line inside the box represents the median, whereas the whiskers represent the lowest and highest values within the interquartile range. Outliers, as well as individual sample values, are shown as dots. Statistical significance was analyzed using the Mann–Whitney U test. n = 119 (B. infantis YLGB-1496 n = 59 and placebo n = 60).
Principal coordinates analysis (PCoA) plots based on Bray–Curtis dissimilarity. Distinct baseline clustering between groups (PERMANOVA p < 0.05) converged by Week 12, indicating temporal stabilization of the microbiota community with probiotic use. Axes represent percentage of total variance explained by each principal coordinate. p-values determined by PERMANOVA test. n = 119 (B. infantis YLGB-1496 n = 59 and placebo n = 60). (A) phylum (P = 0.023), (B) class (P = 0.053), (C) order (P = 0.016), (D) family (P = 0.011), (E) genus (P = 0.009) and (F) species (P = 0.011).
Alpha diversity, assessed using the Chao1 index, indicated that microbial richness increased at the phylum (Figure 3A) and class (Figure 3B) levels, transiently in the placebo group at Week 6 (p < 0.05) but returned to baseline by Week 12. No significant longitudinal changes were observed in the B. infantis YLGB-1496 group, suggesting that B. infantis YLGB-1496 supplementation did not alter overall within-sample diversity in healthy infants.
Beta diversity (Figure 4), measured using Bray–Curtis dissimilarity and visualized by PCoA, demonstrated distinct baseline microbial community structures between groups using PERMANOVA. Significant group differences were evident across multiple taxonomic ranks at Week 0 (A) phylum (p = 0.023), (B) class (p = 0.053), (C) order (p = 0.016), (D) family (p = 0.011), (E) genus (p = 0.009) and (F) species (p = 0.011) but not at Week 6 or 12, indicating convergence in community structure over time. This is consistent with previous reports that probiotics rarely induce major compositional shifts in healthy cohorts with resilient microbiota (14). These findings suggest that the probiotic exerted targeted, strain-specific effects on particular taxa rather than broad restructuring of microbial diversity.
Taxonomic compositional changes
3.6
The 12-week B. infantis YLGB-1496 intervention induced distinct and significant shifts in the gut microbiota composition of infants compared to the placebo group. Comprehensive taxonomic profiling revealed distinct microbial signatures associated with B. infantis YLGB-1496 supplementation (Figures 5, 6).
Extended bar plot showing average relative abundance across different taxonomic levels (A) phylum, (B) class, (C) order, (D) family, (E) genus and (F) species, following 12 weeks of supplementation of B. infantis YLGB-1496. Relative abundance determined by 16S rRNA gene sequencing; compositional differences tested by STAMP v2.1.3. False discovery rate (FDR) correction applied for multiple comparisons. Only taxa with p < 0.05 after FDR adjustment are shown n = 119 (B. infantis YLGB-1496 n = 59 and placebo n = 60).
Extended bar plot showing average relative abundance across different taxonomic levels (A) phylum, (B) class, (C) order, (D) family, (E) genus and (F) species, following 12 weeks supplementation of placebo group. Relative abundance determined by 16S rRNA gene sequencing; compositional differences tested by STAMP v2.1.3. False discovery rate (FDR) correction applied for multiple comparisons. Only taxa with p < 0.05 after FDR adjustment are shown n = 119 (B. infantis YLGB-1496 n = 59 and placebo n = 60).
In the B. infantis YLGB-1496 group (Figure 5), relative abundances increased for beneficial taxa across multiple ranks. These included the phylum Verrucomicrobiota (class Verrucomicrobiae; order Verrucomicrobiales; families Akkermansiaceae and Paludibacteraceae) and the genus Akkermansia. Additional enriched genera included Pygmaiobacter, Aquabacterium, Arachnia, Solibacillus, Paraeggerthella, Phocea, Barnesiella, Lawsonella, and Pseudoflavonifractor.
At the species level, significant increases were observed for Slackia exigua ATCC 700122, Libanicoccus massiliensis, Solibacillus silvestris, Bacteroides faecis, Blautia wexlerae, Prevotella timonensis, Clostridiales bacterium Marseille P5551, Lactobacillus sp. KLDS 1.0716, Bacillus sp. KLDS 1.0716, Alistipes finegoldii DSM 17242, and Lawsonella clevelandensis. Simultaneously, decreases occurred in potentially harmful taxa, such as Raoultella, Mobiluncus, Eikenella, Kocuria, Lachnoanaerobaculum, Parabacteroides sp. Marseille P4001, Clostridium aldenense, Stenotrophomonas acidaminiphila, Mobiluncus curtisii, Peptoniphilus obesi ph1, Kocuria palustris, Intestimonas butyriciproducens, Bacillus sp. FJAT 27916, Eikenella corrodens, Rothia kristinae, Eubacterium callanderi, Prevotella buccalis, and Actinomyces radicidentis.
In contrast, the placebo group (Figure 6) exhibited an increase in taxa associated with dysbiosis and inflammation, including the phylum Campylobacterota; classes Cyanobacteriia, Campylobacteriia, and Coriobacteriia; and families Campylobacteraceae, Staphylococcaceae, Brevibacteriaceae, Micrococcaceae, and Vagococcaceae. Genera that expanded included Campylobacter, Staphylococcus, Mammaliicoccus, Vagococcus, and Tropheryma. At the species level, increased abundance was noted for Brevibacterium epidermis, Lactobacillus murinus, Lactobacillus gastricus, Clostridium amylolyticum, Bacteroides plebeius, and Desulfovibrio desulfuricans.
Conversely, beneficial taxa declined in the placebo group, including Chlamydia, Turicibacter, UCG-005*, Anaerobutyricum*, Coprobacter, and Faecalibacterium prausnitzii. Loss of these SCFA producers and increases in pro-inflammatory taxa suggest a shift toward a less stable microbial environment.
Collectively, these findings demonstrate that B. infantis YLGB-1496 promoted a gut microbiota profile enriched in barrier-supporting and anti-inflammatory bacteria, whereas the placebo group displayed trends consistent with dysbiosis.
Discussion
4
This randomized, double-blind, placebo-controlled trial demonstrates that 12-week supplementation with B. infantis YLGB-1496 in healthy infants results in statistically robust improvements in gastrointestinal health with fewer diarrhea-related clinical visits and improved bowel regularity, while respiratory outcomes did not remain significant after false discovery rate correction. Immunologically, B. infantis YLGB-1496 stabilized mucosal sIgA levels, reduced inflammatory cytokine fluctuations, and enhanced IL-10 expression, indicating the establishment of a more balanced mucosal immune environment.
The present findings align with prior clinical trials demonstrating probiotic-mediated reductions in RTI and GI infection symptoms among children (7, 11). However, the current study extends previous work by integrating detailed immunological and microbiota profiling in infants under 1 year of age, a population with uniquely dynamic microbial development.
Although several respiratory symptoms exhibited numerical reductions in symptom days in the B. infantis YLGB-1496 group at Weeks 6 and 12, these effects did not withstand FDR adjustment and should therefore be interpreted cautiously. The absence of FDR-adjusted significance for respiratory event level outcomes, including infection incidence, clinical visits, and antibiotic use, suggests that the observed benefits of B. infantis YLGB-1496 are more strongly reflected in the modulation of symptom burden rather than in the prevention of respiratory infections during the study period. Notably, this pattern aligns with prior reports involving probiotic strains such as Lactobacillus rhamnosus and Bifidobacterium longum, which have demonstrated reductions in respiratory symptom duration (15–17), particularly cough and nasal congestion without corresponding changes in infection incidence, supporting the concept that probiotics may primarily influence symptom expression and mucosal resilience rather than infection acquisition.
In contrast, gastrointestinal outcomes demonstrated consistent, clinically meaningful, and statistically significant benefits after FDR correction. Reductions in diarrhea incidence, frequency, duration, and healthcare utilization, together with improvements in bowel regularity and GI-associated systemic symptoms, indicate a strong and biologically coherent effect of B. infantis YLGB-1496 on gut health. These findings support the role of B. infantis in maintaining intestinal homeostasis and reducing GI-related morbidity during early life. B. infantis YLGB-1496 reduced baseline symptoms and protected participants from further deterioration. Consistent improvements in symptom days, incidence, frequency, and clinical visits, all with p < 0.05, support the robustness of these findings despite reliance on self-reported data.
Taken together, the results suggest that the primary clinical benefit of B. infantis YLGB-1496 in this cohort is mediated through gastrointestinal pathways, with limited evidence for sustained respiratory benefit after correction for multiple comparisons. Future studies with larger sample sizes or respiratory-specific endpoints may be required to further clarify potential effects on respiratory health.
The immunological findings, specifically, maintenance of fecal sIgA and upregulation of IL-10, reflect mechanisms previously described in animal and human studies (18). IL-10 induction is a hallmark of immune regulation by Bifidobacterium species, contributing to anti-inflammatory effects in the GI tract. The sustained sIgA levels suggest enhanced mucosal protection, consistent with earlier reports linking probiotic use to reinforcement of epithelial immune defense and cross-mucosal immune communication. Additionally, the initial rise and later stabilization of TNF-α and IL-1β in the B. infantis YLGB-1496 group align with previous reports: certain Lactobacillus strains can trigger early pro-inflammatory signaling via macrophage activation, followed by a downregulation of cytokines such as TNF-α and IL-1β, reflecting a shift toward immune modulation and controlled inflammation (19–21). A stabilizing influence is further indicated by patterns in calprotectin, which is a recognized clinical marker for intestinal inflammation and permeability (22). The B. infantis YLGB-1496 group avoided the initial inflammatory spike in calprotectin seen in the placebo group, and both groups showed a beneficial decrease by Week 12. The systemic implications of gut-based immunomodulation are hinted at in the oral cavity data. The significant increase in oral IgA in the B. infantis YLGB-1496 group, contrasted with a decrease in the placebo group, points to a potential for gut-originating immune signals to influence distal mucosal sites, a phenomenon consistent with the concept of a common mucosal immune system (23).
Microbiota data align with and expand upon prior observations that B. infantis YLGB 1496 supplementation promotes the growth of beneficial taxa while suppressing opportunists. The most striking beneficial change in the B. infantis YLGB-1496 group was the marked increase in Akkermansia and its associated taxa (Verrucomicrobiota phylum, Verrucomicrobiia class). Akkermansia muciniphila is a well-known commensal bacterium renowned for strengthening the gut mucosal barrier by promoting mucin production (24). Its abundance is inversely correlated with inflammatory conditions and is considered a next-generation probiotic. The concurrent increase in other beneficial genera like Blautia wexlerae (a short-chain fatty acid (SCFA) producer) (25) and Barnesiella further supports an enhanced gut health phenotype. The decrease in potentially pathogenic or opportunistic genera in the B. infantis YLGB-1496 group, such as Raoultella, Mobiluncus, Eikenella, and Stenotrophomonas, suggested that the probiotic may have helped to suppress organisms associated with infections and dysbiosis (26).
In stark contrast, the placebo group displayed an increase in several taxa linked to dysbiosis and disease. The elevation of the entire Campylobacterota phylum, including the genus Campylobacter, is particularly concerning. Campylobacter sp. are established enteric pathogens, and their increased abundance, even in the absence of overt disease, may indicate a subclinical pro-inflammatory state (27). The rise in Staphylococcus and a Clostridium species (C. amylolyticum) further pointed toward a less stable microbial environment. The decrease in beneficial SCFA producers like Faecalibacterium prausnitzii, one of the most abundant and important butyrate-producing bacteria in the human gut with strong anti-inflammatory properties (28), and the depletion of Anaerostipes caccae likely indicate a significant loss of critical health-promoting, such as supporting gut epithelial integrity, immunoregulation, and microbial cross-feeding networks (29–31).
Collectively, these results support the role of B. infantis YLGB-1496 as a targeted probiotic strain capable of supporting gut barrier integrity, immune homeostasis, and systemic resilience in early life, a period crucial for long-term health programming.
Mechanistic insights
4.1
The observed improvements in respiratory and GI health outcomes are plausibly mediated by microbiota-driven immune modulation. The gut–mucosal axis is known to influence distal mucosal sites, including the respiratory tract, through shared immune pathways and cytokine signaling (32). The sustained elevation of fecal and oral sIgA in the B. infantis YLGB-1496 group suggests strengthened mucosal immunity extending beyond the intestine. sIgA acts as a first-line defense that neutralizes pathogens and toxins while preserving microbial diversity, thereby supporting tolerance and barrier protection (33).
The increase in IL-10 and reduction in IL-1β in the B. infantis YLGB-1496 arm provide biochemical evidence of immune homeostasis restoration. IL-10 suppresses NF-κB mediated inflammatory cascades (34), while IL-1β reduction reflects decreased epithelial stress and innate immune activation. These changes likely stem from enhanced interaction between commensal microbes and gut-associated lymphoid tissue (GALT), as has been documented in other Bifidobacterium-based interventions (18).
The increase in Akkermansia and Blautia wexlerae abundance offers further mechanistic insight. Akkermansia muciniphila enhances mucin layer turnover and epithelial tight-junction expression, improving gut barrier function and reducing endotoxin translocation (24). Meanwhile, Blautia wexlerae produces acetate and butyrate, key SCFAs that regulate inflammation, provide colonocyte energy, and modulate systemic immune tone (25). Together, these shifts likely promoted intestinal stability and anti-inflammatory signaling.
Conversely, the placebo group’s microbial shifts toward Campylobacter, Staphylococcus, and Desulfovibrio species suggest a drift toward low-grade inflammation and increased oxidative stress. Desulfovibrio species, for example, produce hydrogen sulfide, a toxic metabolite linked to mucosal irritation and epithelial injury (35). The concurrent loss of Faecalibacterium prausnitzii, a major butyrate producer with strong anti-inflammatory properties (28), further indicates compromised microbial resilience.
Taken together, these data suggest that B. infantis YLGB-1496 contributes to immune microbiota crosstalk that reinforces intestinal barrier integrity, enhances mucosal antibody production, and prevents dysbiotic transitions, thereby supporting both GI and respiratory health in early infancy.
Strengths and limitations
4.2
The major strength of this study lies in its comprehensive, multi-layered design, integrating clinical outcomes, immunological markers, and detailed microbiota analyses within a randomized, double-blind, placebo-controlled framework. The inclusion of both oral and fecal immune markers provides evidence for systemic mucosal effects, and the high retention rate (99%) ensures strong internal validity. Additionally, the use of 16S rRNA sequencing with taxonomic resolution to the species level offers nuanced insights into microbial modulation rarely achieved in infant probiotic studies.
Nonetheless, several limitations warrant consideration. First, the study population comprised healthy infants, which may have limited the magnitude of measurable benefit compared to diseased or high-risk cohorts. However, this focus allowed evaluation of probiotic effects under physiological conditions, and complementary evidence from our previous clinical trial in children with RTI symptoms supports the potential relevance of this strain in symptomatic populations. Second, dietary intake and environmental exposures were controlled by questionnaire but not objectively measured, which could introduce confounding. Future studies incorporating objective measures, such as detailed dietary records or environmental monitoring, would further strengthen exposure assessment. Third, although the 12-week intervention period was adequate to capture short-term microbiota and immune modulation, it does not provide insight into long-term microbial stability or sustained clinical outcomes following supplementation, highlighting the value of extended follow-up in future studies. Finally, although 16S rRNA profiling provides valuable compositional data, it does not capture functional metabolic activity; metagenomic or metabolomic analyses would strengthen mechanistic understanding.
Despite these limitations, the findings provide robust clinical and mechanistic evidence that B. infantis YLGB-1496 supports gut microbiota maturation, mucosal immunity, and systemic resilience during a critical developmental window. These results lay the groundwork for future longitudinal studies exploring persistent and functional outcomes of early-life probiotic supplementation. A key strength of this study is the integration of clinical outcomes, detailed immunological profiling, and gut microbiota analyses within a randomized, double-blind, placebo-controlled trial design. The exceptionally high retention rate (99%) minimizes attrition bias and strengthens internal validity. Furthermore, the inclusion of both oral and fecal immune markers provides a comprehensive assessment of mucosal immune responses. Microbiota profiling was conducted with taxonomic resolution to the species level, and statistical analyses incorporated false discovery rate correction to reduce the likelihood of type I error, ensuring robustness of microbiome findings.
Conclusion
5
This randomized, double-blind, placebo-controlled trial demonstrates that 12 weeks of B. infantis YLGB-1496 supplementation in healthy infants below 1 year of age significantly improves gastrointestinal health while supporting mucosal immune homeostasis and beneficial gut microbiota maturation. Infants receiving B. infantis YLGB-1496 showed robust improvements in diarrhea-related outcomes, sustained elevation of fecal and oral IgA, increased IL-10, and reductions in IL-1β and calprotectin, indicating a balanced anti-inflammatory immune profile. Although respiratory outcomes showed directional reductions in symptom burden, these did not remain statistically significant after correction for multiple comparisons. Microbiota analyses revealed enrichment of beneficial taxa and reductions in pathobionts. These findings collectively suggest that B. infantis YLGB-1496 exerts multifaceted benefits through microbiota-immune crosstalk, strengthening epithelial barrier integrity and promoting systemic immune stability. As early life may represent a critical window for immune and microbial development, such targeted probiotic interventions may offer a safe and effective approach to support infant health and resilience against infection and inflammation.
The reference list from the paper itself. Each links out to its DOI / PubMed record.
- 1Guo F Cai D Li Y Gu H Qu H Zong Q . How early-life gut microbiota alteration sets trajectories for health and inflammatory bowel disease? Front Nutr. (2021) 8:690073. doi: 10.3389/fnut.2021.69007334422881 PMC 8377158 · doi ↗ · pubmed ↗
- 2Jian C Carpén N Helve O de Vos WM Korpela K Salonen A. Early-life gut microbiota and its connection to metabolic health in children: perspective on ecological drivers and need for quantitative approach. E Bio Medicine. (2021) 69:103475. doi: 10.1016/j.ebiom.2021.103475, 34256346 PMC 8324810 · doi ↗ · pubmed ↗
- 3Sanders ME Merenstein D Merrifield CA Hutkins R. Probiotics for human use. Nutr Bull. (2018) 43:212–25. doi: 10.1111/nbu.12334 · doi ↗
- 4Dawod B Marshall JS Azad MB. Breastfeeding and the developmental origins of mucosal immunity: how human milk shapes the innate and adaptive mucosal immune systems. Curr Opin Gastroenterol. (2021) 37:547–56. doi: 10.1097/MOG.0000000000000778, 34634003 PMC 11451935 · doi ↗ · pubmed ↗
- 5Day RL Harper AJ Woods RM Davies OG Heaney LM. Probiotics: current landscape and future horizons. Future Sci OA. (2019) 5:FSO 391. doi: 10.4155/fsoa-2019-0004, 31114711 PMC 6511921 · doi ↗ · pubmed ↗
- 6Mageswary MU Ang X-Y Lee B-K Chung Y-LF Azhar SNA Hamid IJA . Probiotic Bifidobacterium lactis Probio-M 8 treated and prevented acute RTI, reduced antibiotic use and hospital stay in hospitalized young children: a randomized, double-blind, placebo-controlled study. Eur J Nutr. (2022) 61:1679–91. doi: 10.1007/s 00394-021-02689-8, 34825264 PMC 8616720 · doi ↗ · pubmed ↗
- 7Szajewska H Canani RB Guarino A Hojsak I Indrio F Kolacek S . Probiotics for the prevention of antibiotic-associated diarrhea in children. J Pediatr Gastroenterol Nutr. (2016) 62:495–506. doi: 10.1097/MPG.0000000000001081, 26756877 · doi ↗ · pubmed ↗
- 8Underwood MA German JB Lebrilla CB Mills DA. Bifidobacterium longum subspecies infantis: champion colonizer of the infant gut. Pediatr Res. (2015) 77:229–35. doi: 10.1038/pr.2014.156, 25303277 PMC 4350908 · doi ↗ · pubmed ↗