Identification of the PFK gene family in Solanum species and expression analysis in the fruitof Solanum lycopersicum
Zepeng Wang, Zhongyu Wang, Ruiqiang Xu, Qingyuan Meng, Jintao Wang, Ning Li, Qinghui Yu

TL;DR
This study identifies and analyzes PFK genes in Solanum species, revealing their role in fruit development and sugar metabolism in tomatoes.
Contribution
The first pangenome-scale analysis of the PFK gene family in Solanum species, identifying key regulators of sugar accumulation in tomatoes.
Findings
156 PFK genes were identified across 12 Solanum species, with expansion via segmental duplication.
SolyPFK07 and SolyPFPA2 were found to be key regulators of sugar accumulation in tomato fruit.
Promoters of PFK genes contained elements responsive to hormones and abiotic stresses.
Abstract
Phosphofructokinase (PFK) is a crucial rate-limiting enzyme in glycolysis, essential for sugar metabolism and fruit quality. This study provides the first pangenome-scale analysis of the PFK family across Solanum species. Using pan-genome data, 156 PFK genes were identified across 12 Solanum species. Comprehensive bioinformatic analyses, protein-protein interaction predictions, and promoter motif scans were performed. Expression patterns across four fruit developmental stages were characterized via RNA‐seq and validated by qRT‐PCR. The PFK family, categorized into PFK and PFP subfamilies, expanded primarily through segmental duplication under strong purifying selection. We identified distinct, stage-specific expression patterns, with SolyPFK07 and SolyPFPA2 emerging as key regulators of sugar accumulation. Promoters contained numerous elements responsive to hormones and abiotic…
Genes, proteins, chemicals, diseases, species, mutations and cell lines named across the full text — each resolved to its canonical identifier and authoritative record.
Click any figure to enlarge with its caption.
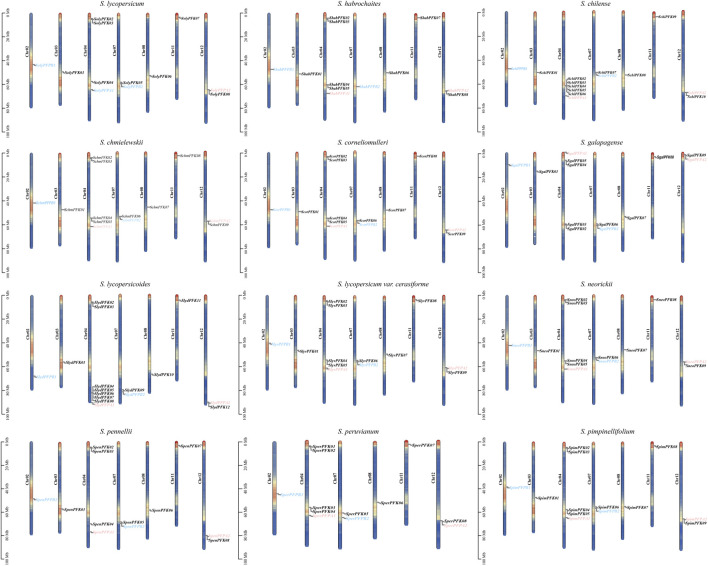 FIGURE 1
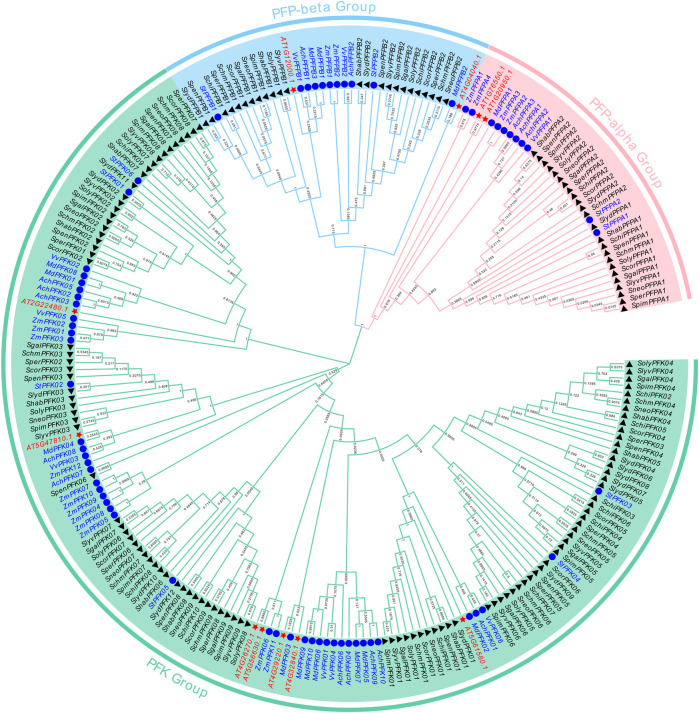 FIGURE 2
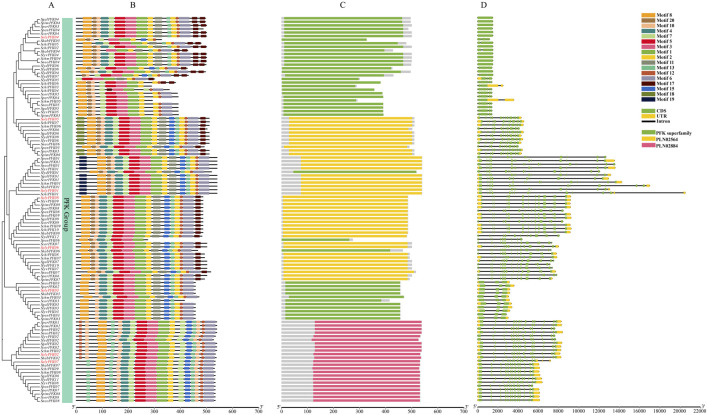 FIGURE 3
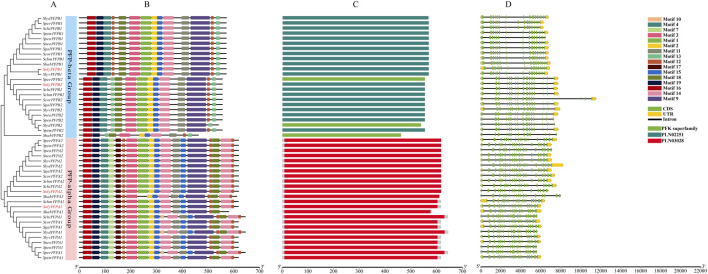 FIGURE 4
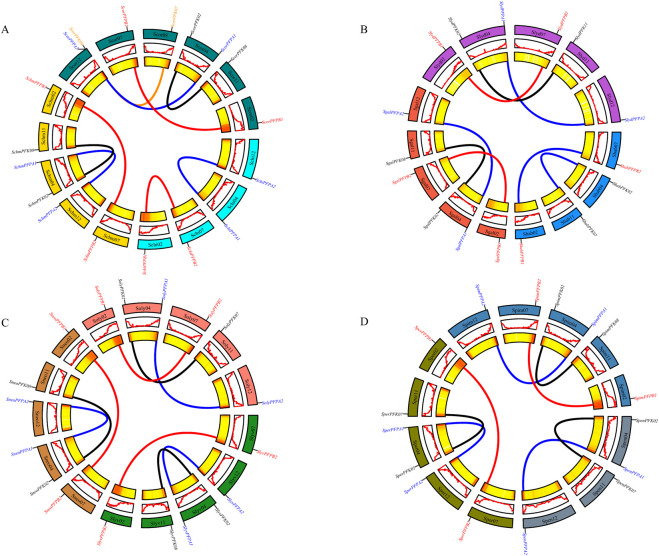 FIGURE 5
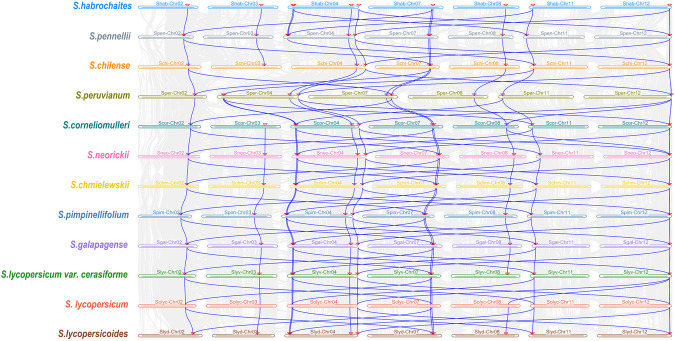 FIGURE 6
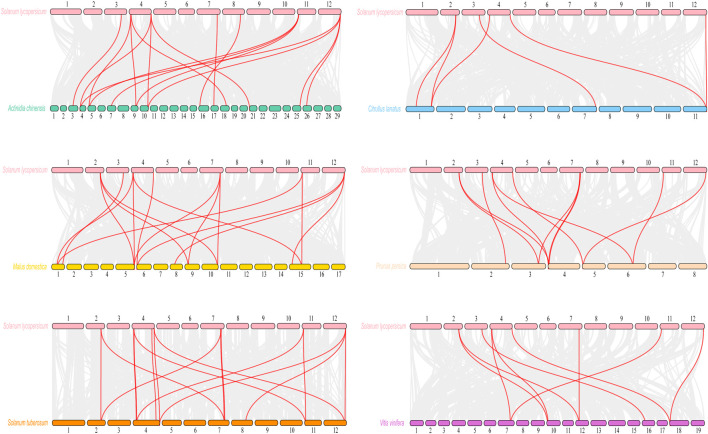 FIGURE 7
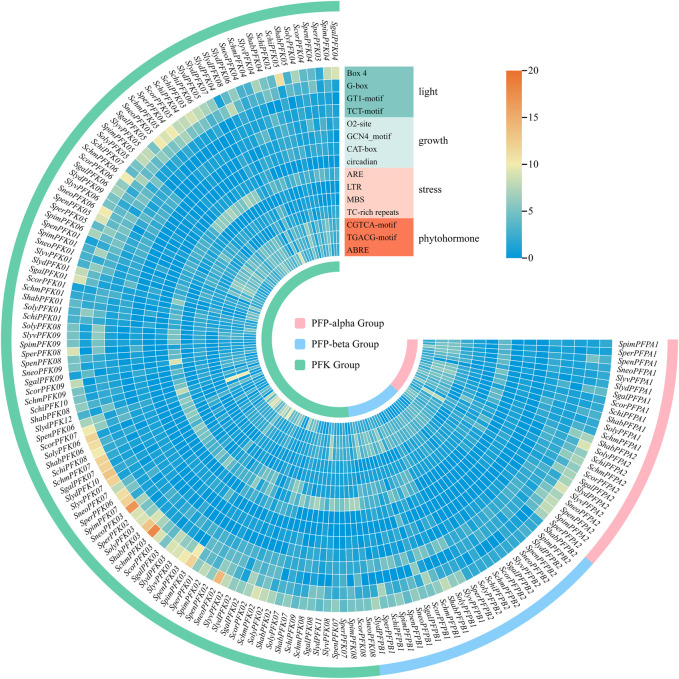 FIGURE 8
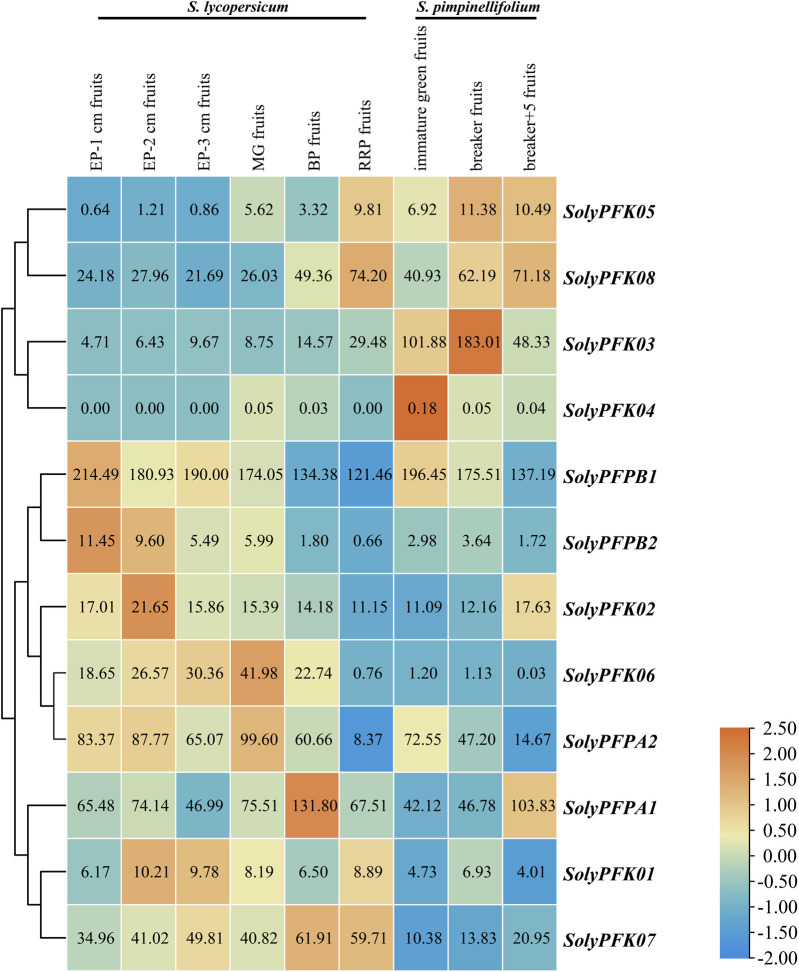 FIGURE 9
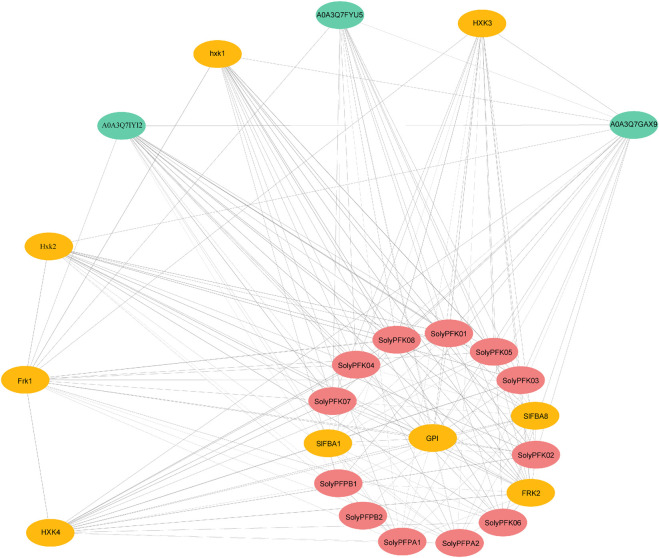 FIGURE 10
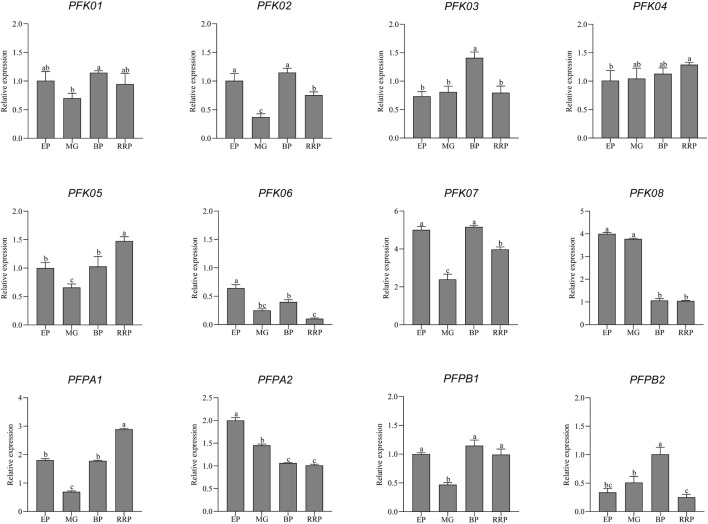 FIGURE 11
| Gene | Forward primer sequence (5'→ 3′) | Reverse primer sequence (5'→ 3′) |
|---|---|---|
|
| GCAGTGGTAGGGACAAGATTGA | GGCATCCAATAACCCGAGTT |
|
| TGGCTTTGATACTGCTGTGGAG | CAACAGTCCACATCACGGTTAC |
|
| ATGCTCTTTGTGCTGGGTGG | GCTTCTTCAACGGCAGTATCAA |
|
| TGTGCCCTGGGATGAATACG | CCAATCATCAACCATCTTCGG |
|
| TAATGGGACGGGATAGTGGG | TGTGTCCATTCTCTTTCAGCC |
|
| GTGGTCCTGGTAAAGCATCAAT | GGGTAACAGCCTTGGCATCT |
|
| CGGTTGGTCCTGTCAATAACA | GAGTAGGTGGTTCTTCGTCCTTG |
|
| CAACCGTCTCATTGTATCGCT | CCTGGAAGTAACGACACGGA |
|
| CAGAGTCACCCTTCTTTCTTGATG | CTTGTTGACTTCCAGCATTGG |
|
| TGTTGAAGAAGCACAGAGAGCC | AAAGGCACCTCTGGAATCAAG |
|
| CATCCAGCCACTGTAGATTTGA | TCCTGGTCTTCAACGCAAA |
|
| GGAGCAATGGCAGGATACAC | CTTGGCTGATTGGTTGACG |
|
| CAGGGTGTTCTTCAGGAGCAA | GGTGTTATGGTCGGAATGGG |
| Gene ID | Gene name | Chromosome location | Amino acid | Molecular weight | Isoelectrc point | Gravy | Subcellular localization | Protein secondary structure | ||
|---|---|---|---|---|---|---|---|---|---|---|
| a | b | c | ||||||||
| Solyc02g081160.3.1 |
| Soly-Chr02 | 569 | 61765.81 | 6.01 | −0.134 | Cyto | 44.46% | 5.98% | 33.92% |
| Solyc03g093520.3.1 |
| Soly-Chr03 | 539 | 59714.13 | 8.71 | −0.265 | Chlo | 31.91% | 6.68% | 42.49% |
| Solyc04g014270.3.1 |
| Soly-Chr04 | 533 | 58460.03 | 8.55 | −0.133 | Cyto | 31.89% | 8.26% | 41.84% |
| Solyc04g015200.3.1 |
| Soly-Chr04 | 456 | 50513.51 | 6.31 | −0.161 | Chlo | 31.80% | 8.11% | 40.13% |
| Solyc04g072580.1.1 |
| Soly-Chr04 | 499 | 54851.02 | 5.20 | −0.234 | Cyto | 31.26% | 7.41% | 43.09% |
| Solyc04g082880.4.1 |
| Soly-Chr04 | 616 | 67301.18 | 6.76 | −0.112 | Cyto | 46.59% | 5.52% | 33.93% |
| Solyc07g045160.3.1 |
| Soly-Chr07 | 509 | 56188.95 | 6.25 | −0.230 | Cysk | 33.99% | 7.47% | 42.04% |
| Solyc07g049280.3.1 |
| Soly-Chr07 | 554 | 60090.89 | 7.56 | −0.169 | Chlo | 44.04% | 5.78% | 34.12% |
| Solyc08g066100.3.1 |
| Soly-Chr08 | 500 | 55053.79 | 6.92 | −0.197 | Cyto | 33.80% | 7.80% | 41.60% |
| Solyc11g010450.2.1 |
| Soly-Chr11 | 532 | 58365.79 | 6.47 | −0.104 | Cyto | 30.45% | 7.33% | 43.80% |
| Solyc12g095760.2.1 |
| Soly-Chr12 | 617 | 67267.19 | 7.23 | −0.153 | Cyto | 46.35% | 5.51% | 34.85% |
| Solyc12g095880.2.1 |
| Soly-Chr12 | 485 | 53800.03 | 6.12 | −0.339 | Cyto | 31.96% | 8.04% | 40.21% |
| Species | Chr | Duplicate gene pairs | Ka | Ks | Ka/Ks | Duplicated type |
|---|---|---|---|---|---|---|
|
| SolyChr02/SolyChr07 |
| 0.13 | 1.62 | 0.08 | Segmental |
| SolyChr04/SolyChr11 |
| 0.09 | 0.51 | 0.18 | Segmental | |
| SolyChr04/SolyChr12 |
| 0.05 | 0.56 | 0.08 | Segmental | |
|
| ShabChr02/ShabChr07 |
| 0.16 | 1.60 | 0.10 | Segmental |
| ShabChr04/ShabChr11 |
| 0.09 | 0.52 | 0.17 | Segmental | |
|
| SchiChr02/SchiChr07 |
| 0.12 | 1.42 | 0.09 | Segmental |
| SchiChr04/SchiChr12 |
| 0.05 | 0.54 | 0.09 | Segmental | |
|
| SchmChr02/SchmChr07 |
| 0.13 | 1.61 | 0.08 | Segmental |
| SchmChr04/SchmChr11 |
| 0.09 | 0.52 | 0.18 | Segmental | |
| SchmChr04/SchmChr12 |
| 0.05 | 0.54 | 0.09 | Segmental | |
|
| ScorChr02/ScorChr07 |
| 0.13 | 1.63 | 0.08 | Segmental |
| ScorChr04/ScorChr11 |
| 0.09 | 0.52 | 0.18 | Segmental | |
| ScorChr04/ScorChr12 |
| 0.05 | 0.54 | 0.09 | Segmental | |
| ScorChr08/ScorChr12 |
| 0.08 | 0.63 | 0.13 | Segmental | |
|
| SgalChr02/SgalChr07 |
| 0.11 | 2.32 | 0.05 | Segmental |
| SgalChr04/SgalChr11 |
| 0.09 | 0.66 | 0.13 | Segmental | |
| SgalChr04/SgalChr12 |
| 0.04 | 0.60 | 0.08 | Segmental | |
|
| SlydChr02/SlydChr07 |
| 0.14 | 1.51 | 0.09 | Segmental |
| SlydChr04/SlydChr11 |
| 0.09 | 0.47 | 0.19 | Segmental | |
| SlydChr04/SlydChr12 |
| 0.06 | 0.56 | 0.11 | Segmental | |
|
| SlyvChr02/SlyvChr07 |
| 0.13 | 1.62 | 0.08 | Segmental |
| SlyvChr04/SlyvChr11 |
| 0.09 | 0.51 | 0.18 | Segmental | |
| SlyvChr04/SlyvChr12 |
| 0.05 | 0.56 | 0.08 | Segmental | |
|
| SneoChr02/SneoChr07 |
| 0.13 | 1.61 | 0.08 | Segmental |
| SneoChr04/SneoChr11 |
| 0.09 | 0.52 | 0.17 | Segmental | |
| SneoChr04/SneoChr12 |
| 0.05 | 0.54 | 0.09 | Segmental | |
|
| SpenChr04/SpenChr11 |
| 0.09 | 0.53 | 0.16 | Segmental |
| SpenChr04/SpenChr12 |
| 0.05 | 0.52 | 0.09 | Segmental | |
|
| SperChr02/SperChr07 |
| 0.13 | 1.44 | 0.09 | Segmental |
| SperChr04/SperChr11 |
| 0.09 | 0.54 | 0.17 | Segmental | |
| SperChr04/SperChr12 |
| 0.05 | 0.54 | 0.09 | Segmental | |
|
| SpimChr02/SpimChr07 |
| 0.13 | 1.60 | 0.08 | Segmental |
| SpimChr04/SpimChr11 |
| 0.09 | 0.54 | 0.17 | Segmental | |
| SpimChr04/SpimChr12 |
| 0.05 | 0.56 | 0.08 | Segmental |
Peer Reviews
No public reviews on file for this paper yet. If you reviewed it on a platform where reviews are public (OpenReview, ICLR, NeurIPS, ICML), you can paste yours below so the community can read it here.
Videos
No videos yet. Explain this paper in a talk, walkthrough, or lecture? Add one.
Taxonomy
TopicsPlant nutrient uptake and metabolism · Cancer, Hypoxia, and Metabolism · Glycosylation and Glycoproteins Research
Introduction
1
Sugars are not only the primary energy source for plant growth but also serve as crucial signaling molecules that regulate growth and development in higher plants (Lastdrager et al., 2014; Lü et al., 2019). Phosphofructokinase (PFK), a key rate-limiting enzyme in glycolysis, plays an essential role in plant sugar metabolism. In plants, two types of phosphorylating enzymes are typically involved in the phosphorylation process. One is ATP-dependent phosphofructokinase (PFK, EC 2.7.1.11), which catalyzes the irreversible phosphorylation of fructose-6-phosphate (F-6-P) to fructose-1,6-bisphosphate (F-1,6-BP). The other is pyrophosphate-dependent fructose-6-phosphate phosphotransferase (PFP, EC 2.7.1.90), which catalyzes the reversible conversion of F-6-P to F-1,6-BP (Bapteste et al., 2003; Lim et al., 2014; Siebers and Schönheit, 2005). Generally, PFP is composed of α- and β-subunits, where the α-subunit regulates catalytic activity via fructose-2,6-bisphosphate (Fru-2,6-BP), while the β-subunit performs the catalytic function (Chen et al., 2020a; Qin et al., 2014).
With the completion of whole-genome sequencing in multiple plant species, the PFK gene family has been increasingly investigated. In Arabidopsis (Arabidopsis thaliana), 11 PFK genes have been identified, including seven members belonging to the PFK subfamily and four members belonging to the PFP subfamily (Mustroph et al., 2007). In cassava (Manihot esculenta), 13 PFK genes have been identified, comprising nine MePFK subtype genes and four MePFP subtype genes, among which MePFPA1 plays a prominent role under waterlogging stress (Wang et al., 2021). In four cotton species (Gossypium hirsutum, Gossypium barbadense, Gossypium arboreum, and Gossypium raimondii), a total of 80 PFK genes have been identified, including 56 genes from the PFK subfamily and 24 genes from the PFP subfamily (six PFPA and 18 PFPB genes). Notably, GhPFK11 and GhPFK17 have been identified as major candidate genes involved in drought tolerance regulation in cotton (Mehari et al., 2022). In wheat (Triticum aestivum), 24 TaPFK subtype genes and 12 TaPFP subtype genes have been identified, with the TaPFP genes playing a dominant role in growth and development (Yu et al., 2021). In rice (Oryza sativa), 15 distinct sequences with high similarity to PFK-encoding genes in Arabidopsis have been identified (Mustroph et al., 2013). In maize (Zea mays), a total of 18 ZmPFK genes have been identified, and functional analysis revealed that members of the ZmPFK family are crucial in response to low-temperature stress, with ZmPFK2, ZmPFK6, and ZmPFK18 playing essential roles in maize growth, development, and stress responses (Fu et al., 2025). In addition, comprehensive genome-wide identification of PFK genes has also been conducted in several other crops, including pear (Pyrus bretschneideri), spinach (Spinacia oleracea), sugarcane (Saccharum officinarum), red oak (Quercus rubra), and eastern cottonwood (Populus deltoides) (Lü et al., 2019; Chen et al., 2017; Zhu et al., 2013; Kim et al., 2023a; Kim et al., 2023b). Collectively, these studies indicate that the PFK gene family has been widely investigated, and its regulatory functions are gradually being uncovered and experimentally validated.
Tomato (Solanum lycopersicum) is one of the most important vegetable crops worldwide. It is extensively cultivated in many regions due to its high economic and nutritional value and is highly favored by both markets and consumers (Wang et al., 2023). At present, research on fruit quality traits has become a primary focus in tomato breeding programs, particularly for processing tomatoes. Sugar content plays a crucial role in determining tomato fruit quality. During tomato development, from flowering to full ripening, sugar accumulation is regulated by both endogenous and exogenous signals, primarily mediated through hormone and sugar signaling pathways, ultimately affecting fruit flavor and quality at the red-ripe stage (Baldet et al., 2006; Mounet et al., 2009). Previous studies have shown that MdPFPβ enhances photosynthetic performance in transgenic tomato plants, modulates the activities of sugar metabolism-related enzymes, and promotes the accumulation of sucrose, fructose, and glucose in fruits, suggesting that PFK genes are involved in the regulation of sugar metabolism in tomato (Yu et al., 2022). Currently, cultivated tomato has lost a considerable portion of its genetic diversity due to domestication bottlenecks and intensive artificial selection for larger fruits and higher yields. In contrast, wild tomato species exhibit broad genetic and phenotypic diversity. For example, S. pennellii not only contains higher sugar levels but also displays stronger resistance to biotic and abiotic stresses compared with cultivated tomato; S. peruvianum provides valuable resistance resources against various diseases, including Septoria leaf spot, Fusarium wilt, leaf mold, and late blight; S. pimpinellifolium possesses a rich flavor that is three times stronger than cultivated tomato and is also enriched in vitamin C; and S. neorickii has a high soluble solids content (Dai et al., 2022; Zhu, 2015). Therefore, the continued exploitation of wild tomato germplasm remains of great practical significance for breeding high-quality tomato varieties.
The assembly and release of the tomato pan-genome have substantially enhanced the ability of breeders to integrate and exploit the abundant genetic diversity found in wild tomato species (Li et al., 2023). In this context, we conducted a genome-wide identification and expression analysis of the PFK gene family across 12 tomato species, resulting in the identification of 156 PFK genes. Comprehensive analyses, including phylogenetic tree construction, gene structure characterization, motif identification, Chromosomal distribution, promoter element prediction, and protein–protein interaction network analysis, were performed. Furthermore, RNA-seq and qRT-PCR approaches were combined to examine the expression patterns of PFK genes in relation to sugar content during four stages of fruit development, thereby elucidating their potential roles in sugar accumulation dynamics. The findings of this study establishes a theoretical basis for the in-depth analysis of the function of the PFK gene in the growth and development of tomato fruit and its sugar metabolism. This is highly valuable for creating high-quality tomato germplasm resources and breeding high-quality tomatoes.
Materials and methods
2
Plant materials
2.1
The Tomato Genetics Resource Center (TGRC) supplied the processing tomato cultivar 'E−6203′that was used in this study. Seeds were sown in seedling trays and grown in a greenhouse at 25 °C for cultivation. When the seedlings reached the four-leaf stage, they were transplanted to the experimental field of the Bazhou Academy of Agricultural Sciences, Korla City, Xinjiang, China. The early developmental stage of tomato fruit is characterized by active cell division and cell enlargement. The ripening and maturation stages of tomato fruit include the mature green stage, the breaker stage, and the red ripe stage, during which the fruit size and shape remain largely unchanged, while the fruit color and metabolic composition undergo dramatic changes. Tomato fruits were harvested at 15 days after pollination (fruit expansion stage), 40 days (mature green stage), 49 days (breaker stage), and 59 days (red ripe stage). For each plant, 3–5 fruits were collected and immediately frozen in liquid nitrogen. A portion of the samples was used for RNA extraction, while the remaining samples were stored at −80 °C for future use.
Identification of PFK gene family members
2.2
To identify potential members of the PFK gene family in Solanum species, genome-wide data from the tomato pan-genome generated in our previous study were used to screen for PFK genes in each species independently (Li et al., 2023). Additionally, genome sequences of kiwifruit (Actinidia chinensis), apple (Malus domestica), watermelon (Citrullus lanatus), peach (Prunus persica), potato (Solanum tuberosum), grape (Vitis vinifera), maize (Zea mays) and arabidopsis (Arabidopsis thaliana) were downloaded from the Ensembl database (https://plants.ensembl.org/). The hidden Markov model (HMM) profile of the PFK domain (Pfam ID: PF00365) was retrieved from the InterPro database (http://pfam-legacy.xfam.org/) and used as a query in HMMER searches against the predicted protein sequences of tomato PFK genes, with an E-value cutoff of ≤1e^−5^ (Prakash et al., 2017). Finally, all candidate proteins were further validated using the Conserved Domain Database (CDD) tool at NCBI (https://www.ncbi.nlm.nih.gov/).
Physicochemical properties, secondary structure prediction, and subcellular localization of PFK proteins
2.3
The physicochemical properties of tomato PFK proteins were analyzed using the ExPASy online tool (https://web.expasy.org/tools/) (Gasteiger et al., 2003). The secondary structures of all PFK proteins were predicted with the SOPMA program (https://npsa-pbil.ibcp.fr/cgi-bin/npsa_automat.pl?page=npsa_sopma.html) and subcellular localization was assessed using WoLF PSORT II (https://wolfpsort.hgc.jp/), in order to predict their potential functional compartments (Geourjon and Deléage, 1995).
Phylogenetic analysis of PFK genes
2.4
PFK protein sequences from tomato, kiwifruit, apple, potato, grape, maize, and arabidopsis were aligned using MUSCLE implemented in MEGA 7.0. A phylogenetic tree of the PFK gene family was constructed using the Neighbor-Joining (NJ) method with 1,000 bootstrap replicates to assess branch reliability (Kumar et al., 2018). The resulting tree was subsequently visualized and refined using the EVOLVIEW online platform (https://www.evolgenius.info/evolview-v2/) (Zhang et al., 2012).
Gene structure analysis of PFK genes
2.5
To analyze the structural characteristics of PFK genes, the coding sequences (CDS) were compared with their corresponding genomic DNA sequences using TBtools. Conserved motif prediction was performed with the MEME online suite (https://meme-suite.org/meme/), with the maximum number of motifs set to 20, motif widths ranging from 6 to 100 amino acids, and an E-value threshold of 1e-5. (Ba et al., 2009). Finally, the phylogenetic relationships, gene structures, conserved protein motifs, and protein domains of the PFK gene family were integrated and visualized using TBtools (Chen et al., 2020b).
Chromosomal localization, collinearity, and Ka/Ks analysis of PFK genes
2.6
Based on the Chromosomal location information of PFK genes, their positional distribution was visualized using TBtools. MCScanX was employed to generate collinearity maps of PFK genes among tomato, kiwifruit, watermelon, apple, peach, potato, and grape, as well as to analyze collinearity within Solanum species (Wang et al., 2012). Circos was used to visualize Chromosome-level collinearity relationships (Krzywinski et al., 2009). The Ka/Ks ratios of collinear PFK gene pairs in tomato were calculated using the Ka/Ks tool (Wang et al., 2010).
Promoter cis-acting element analysis of PFK genes
2.7
The 2,000 bp upstream sequences of PFK genes were extracted using TBtools and submitted to the PlantCARE online database (http://bioinformatics.psb.ugent.be/webtools/plantcare/html/) to predict cis-acting regulatory elements in the promoter regions (Lescot et al., 2002). Expression heatmaps of PFK genes were generated using the HeatMap tool in the ChiPlot online platform (https://www.chiplot.online/).
Expression pattern analysis of PFK genes
2.8
Transcriptome data were used to investigate the expression patterns of PFK genes during different developmental stages of tomato fruit, these data were downloaded from the Tomato Functional Genomics Database (TFGD; http://132.236.156.160/cgi-bin/TFGD/digital/home.cg). Expression heatmaps of PFK genes were generated using the HeatMap module in TBtools, and the resulting figures were refined with Adobe Illustrator 2020 for visualization.
Protein–protein interaction analysis of PFK proteins
2.9
Protein–protein interaction networks of PFK proteins were predicted using the STRING online database (https://string-db.org/), and the interaction networks were subsequently visualized with Cytoscape software (Szklarczyk et al., 2018; Su et al., 2014).
qRT-PCR analysis of PFK genes
2.10
Total RNA was extracted using the RNAprep Pure Plant Kit (DP441, Tiangen Biotech, Beijing, China). First-strand cDNA was synthesized with the All-In-One 5× RT MasterMix kit (abm, Canada). Each qRT-PCR reaction was performed in a 20 μL volume containing 10 μL of 2× ChamQ Universal SYBR qPCR Master Mix (Vazyme, China), 8.2 μL of ddH_2_O, 0.4 μL of each gene-specific primer, and 1 μL of cDNA template. Amplifications were performed on a LightCycler 96 Real-Time PCR System (Roche, Switzerland) with the following program: 94 °C for 120 s (pre-denaturation), followed by 45 cycles of 94 °C for 5 s (denaturation), 15 s for annealing, and 72 °C for 10 s (extension). Gene-specific primers for members of the tomato SolyPFK gene family were designed based on their CDS sequences (Table 1) and synthesized by Sangon Biotech (Shanghai, China). Relative expression levels were calculated using the 2^−ΔΔCT^ method, with SolyActin serving as the internal control. All experiments were conducted with three biological replicates.
Results
3
Physicochemical characterization of PFK genes
3.1
In this study, a total of 156 putative PFK genes were identified across 12 Solanum species (cultivated and wild tomatoes) via genome-wide identification analysis., including S. lycopersicum (12), S. habrochaites (12), S. chilense (14), S. chmielewskii (13), S. corneliomulleri (13), S. galapagense (13), S. lycopersicoides (16), S. lycopersicum var. cerasiforme (13), S. neorickii (13), S. pennellii (12), S. peruvianum (12), and S. pimpinellifolium (13). Genes were named according to their chromosomal locations and subfamily classifications. Analysis of physicochemical properties (Table 2; Supplementary Tables S1-S11) revealed that the amino acid lengths of PFK family members ranged from 273 residues (SpenPFK06) to 644 residues (SlydPFPA1), with molecular weights ranging from 30,139.41 Da (SpenPFK06) to 70,739.20 Da (SlydPFPA1). The predicted isoelectric points (pI) varied between 5.05 (SlydPFK05) and 8.95 (SlydPFK02). The GRAVY (grand average of hydropathicity) values ranged from −0.339 (SlyvPFK09) to −0.086 (SchiPFPA1), indicating that all PFK family members are hydrophilic proteins.
Subcellular localization analysis revealed that members of the PFK gene family were predominantly distributed in the cytoplasm, chloroplast, and cytoskeleton. Specifically, PFK genes on Chr08 and Chr12 were localized to the cytoplasm and cytoskeleton, whereas all PFK genes on Chr11 were exclusively localized to the cytoplasm. The PFK genes on Chr03 were found in the chloroplasts, while those on Chr02 were distributed in both the cytoplasm and chloroplasts. PFK genes on the remaining chromosomes were observed in the cytoplasm, chloroplasts, and cytoskeleton.
The predicted secondary structure of proteins encoded by the PFK gene family was primarily composed of α-helices, β-sheets, and random coils. Among these, α-helices (28.25% in SlydPFK11% to 47.90% in SchiPFPA1) and random coils (31.93% in SlydPFPB1 to 46.43% in SneoPFK08) represented the major structural components, whereas β-sheets were comparatively less abundant, ranging from 4.21% (SlydPFPA2) to 10.26% (SpenPFK06).
Chromosomal localization of PFK genes
3.2
Chromosomal localization analysis revealed that all tomato PFK gene family members were distributed across seven chromosomes (Figure 1). Among them, the largest number of PFK genes was located on Chr04 (62), followed by Chr12 (24) and Chr07 (23). The remaining genes were distributed on Chr02 (12), Chr03 (11), Chr08 (12), and Chr11 (12). In the tomato PFK gene family, members of the PFK subfamily were mapped to Chr03, Chr04, Chr07, Chr08, Chr11, and Chr12; the PFP-α subfamily was distributed on Chr04 and Chr12; and the PFP-β subfamily was distributed on Chr02 and Chr07. Notably, only S. peruvianum lacked PFK genes on Chr03, whereas all other Solanum species had PFK genes distributed on Chr02, Chr03, Chr04, Chr07, Chr08, Chr11, and Chr12.
Chromosomal localization of the PFK gene. The names of the chromosomes are shown on the left of each Chromosome. The black line indicates the gene location. The five colors on the Chromosome, dark blue, light blue, yellow, light red, and dark red, represent the gene density, with red representing high levels and blue representing low levels. The size of the Chromosome is listed in metabases (Mb).
Phylogenetic classification of PFK genes
3.3
To elucidate the evolutionary relationships of PFK genes across different species, a phylogenetic tree was constructed based on the conserved protein domains of PFK from kiwifruit (AchPFK, 15), apple (MdPFK, 14), potato (StPFK, 10), grape (VvPFK, 9), maize (ZmPFK, 18), arabidopsis (AtPFK, 11), and tomato (SlPFK, 156) (Figure 2). In Arabidopsis thaliana, At1g20950 and At1g76550 were identified as the PFP-α subunits, while At1g12000 and At4g04040 were designated as the PFP-β subunits. Utilizing the Arabidopsis protein sequences along with those from six other plant species, a phylogenetic tree was constructed. Based on the distribution of Arabidopsis subunits, the PFK genes from these seven species were divided into two major subfamilies: the PFK subfamily and the PFP subfamily. The PFP subfamily was further resolved into PFP-α and PFP-β clades. Members within the same subfamily exhibited closer phylogenetic relationships. The distribution of members across subfamilies was uneven. The PFK subfamily contained the largest number of members (159), including 10 AchPFKs, 10 MdPFKs, 6 StPFKs, 6 VvPFKs, 12 ZmPFKs, 7 AtPFKs,and 108 SlPFKs. The PFP-α subfamily comprised 37 members, including 3 AchPFKs, 1 MdPFK, 2 StPFPs, 1 VvPFP, 4 ZmPFKs, 2 AtPFKs, and 24 SlPFKs. Similarly, the PFP-β subfamily also consisted of 37 members, including 2 AchPFKs, 3 MdPFKs, 2 StPFPs, 2 VvPFPs, 2 ZmPFKs, 2 AtPFKs, and 24 SlPFKs. Overall, genes within the same subfamily generally shared conserved functional characteristics, suggesting that members may have retained similar biochemical roles during evolution. Notably, most tomato PFK genes were clustered within the PFK subfamily, whereas a smaller proportion were assigned to the PFP subfamily, implying that sugar metabolism in tomato fruits is primarily regulated through the PFK-mediated pathway.
The phylogenetic tree and classification of PFK gene. In the phylogenetic tree, species are distinguished by different colored shapes: black triangles indicate tomato and its wild relatives (S. lycopersicum, S. habrochaites, S. chilense, S. chmielewskii, S. corneliomulleri, S. galapagense, S. lycopersicoides, S. lycopersicum var. cerasiforme, S. neorickii, S. pennellii, S. peruvianum, and S. pimpinellifolium); blue circles represent Actinidia chinensis, Malus domestica, Solanum tuberosum), Vitis vinifera), and Zea mays; and red stars represent Arabidopsis thaliana.
Motif composition and gene structure of PFK genes
3.4
Exon–intron structural variation represents an important source of gene family diversification and plant biodiversity. As shown in Figure 3, within the PFK subfamily, SgalPFK04, SpimPFK04, SperPFK03, SpenPFK04, ScorPFK04, SolyPFK04, SchiPFK02, SlyvPFK04, SchmPFK04, SneoPFK04, SlydPFK06, and SlydPFK04 contained only a single exon. SchiPFK05 and ShabPFK04 harbored two exons, whereas SlydPFK05, SneoPFK03, SperPFK02, SolyPFK03, ShabPFK03, SchmPFK03, ScorPFK03, SgalPFK03, SlydPFK03, SlyvPFK03, SpenPFK03, and SpimPFK03 each contained three exons, indicating considerable variation in gene structure. As shown in Figure 4, members of the PFP subfamily generally contained a larger number of exons. Moreover, gene structures within the same subfamily exhibited both conserved and divergent regions. Even when exon numbers were identical, gene length often varied among homologs. For example, SolyPFK03 and SperPFK02 in the PFK subfamily both contained three exons, but differed in gene length. Similarly, SolyPFPA2 and SchmPFPA2 within the PFP-α subfamily both contained twenty exons, yet showed variations in both gene length.
Features of the PFK genes in PFK subfamily. (A) Phylogenetic tree of PFK proteins in Solanum species. (B) Distribution of conserved motifs across Solanum species PFK proteins. (C) The domains of Solanum species PFK proteins. (D) Schematic representation of the gene structure of Solanum species PFK genes.
Features of the PFK genes in PFP subfamily. (A) Phylogenetic tree of PFK proteins in Solanum species. (B) Distribution of conserved motifs across Solanum species PFK proteins. (C) The domains of Solanum species PFK proteins. (D) Schematic representation of the gene structure of Solanum species PFK genes.
PFK proteins exhibited diverse motif types, with functionally similar proteins typically sharing conserved Motif of similar composition and arrangement. Within the PFK subfamily, most members contained highly similar motif compositions and arrangements, including Motif 8, Motif 20, Motif 10, Motif 4, Motif 7, Motif 5, Motif 3, Motif 1, Motif 2, Motif 11, Motif 15, Motif 13, Motif 12, Motif 6, and Motif 17. In contrast, Motif 18 and Motif 19 were only present in a subset of members, suggesting that these genes may perform specialized functions. In the PFP-α subfamily, most members exhibited a conserved motif pattern consisting of Motif 16, Motif 19, Motif 4, Motif 13, Motif 18, Motif 3, Motif 1, Motif 2, Motif 15, Motif 14, Motif 11, Motif 9, and Motif 12. Similarly, members of the PFP-β subfamily shared a conserved arrangement of Motif 16, Motif 19, Motif 4, Motif 7, Motif 17, Motif 12, Motif 3, Motif 1, Motif 2, Motif 15, Motif 14, Motif 11, Motif 9, and Motif 18. Although the PFP-α and PFP-β subfamilies shared the majority of Motif, certain Motif were specific to one subgroup. For example, Motif 13 was unique to the PFP-α subfamily, whereas Motif 17 was only present in the PFP-β subfamily, indicating potential involvement in distinct regulatory functions.
Notably, all members of both the PFK and PFP subfamilies contained Motif 1 and Motif 3, suggesting that these Motif are widely distributed and highly conserved across tomato PFK proteins. Many members within the same subfamily also shared additional conserved Motif, supporting the functional conservation of these proteins. Meanwhile, some Motif were specific to certain subfamilies: Motif 6, Motif 8, and Motif 20 were restricted to the PFK subfamily, whereas Motif 9, Motif 14, and Motif 16 were unique to the PFP subfamily. These results indicate that PFK proteins exhibit a combination of conserved and subfamily-specific motifs, reflecting both structural conservation and functional diversity. Protein domain analysis revealed five distinct domain types across all tomato PFK proteins: the PFK superfamily, PLN02251, PLN02564, PLN02884, and PLN03028. Within the PFK subfamily, some members contain a single PFK superfamily domain, while others possess only the PLN02564 domain. Notably, a small subclade within this subfamily is characterized exclusively by the presence of the PLN02884 domain. The PFP subfamily primarily involves three domain types: the PFK superfamily, PLN02251, and PLN03028. Specifically, all members of the PFP-α subfamily exclusively contain the PLN03028 domain. In the PFP-β subfamily, proteins contain either the PFK superfamily or PLN02251 domain; only three members (SperPFPB2, SlydPFPB2, and ShabPFPB2) harbor a single PFK superfamily domain, whereas the remaining members exclusively contain the PLN02251 domain. These findings suggest that the diversity in domain composition among tomato PFK proteins reflects functional specialization within the family, providing a structural basis for their distinct roles in glycolysis and related metabolic pathways.
Synteny and Ka/Ks analysis of PFK genes
3.5
Synteny analysis within tomato species revealed the presence of multiple collinear gene pairs (Figure 5). In cultivated tomato (S. lycopersicum), three pairs of collinear genes were identified: SolyPFPB1/SolyPFPB2, SolyPFK02/SolyPFK07, and SolyPFPA1/SolyPFPA2. Two collinear pairs were detected in S. habrochaites (ShabPFPB1/ShabPFPB2, ShabPFK02/ShabPFK07) and in S. chilense (SchiPFPB1/SchiPFPB2, SchiPFPA1/SchiPFPA2). In S. chmielewskii, three pairs were identified (SchmPFPB1/SchmPFPB2, SchmPFK02/SchmPFK08, SchmPFPA1/SchmPFPA2), whereas S. corneliomulleri contained four pairs (ScorPFPB1/ScorPFPB2, ScorPFK02/ScorPFK08, ScorPFPA1/ScorPFPA2, ScorPFK07/ScorPFK09). Three collinear pairs were also identified in S. galapagense (SgalPFPB1/SgalPFPB2, SgalPFK02/SgalPFK08, SgalPFPA1/SgalPFPA2), S. lycopersicoides (SlydPFPB1/SlydPFPB2, SlydPFK02/SlydPFK11, SlydPFPA1/SlydPFPA2), S. lycopersicum var. cerasiforme (SlyvPFPB1/SlyvPFPB2, SlyvPFK02/SlyvPFK08, SlyvPFPA1/SlyvPFPA2), S. neorickii (SneoPFPB1/SneoPFPB2, SneoPFK02/SneoPFK08, SneoPFPA1/SneoPFPA2), S. peruvianum (SperPFPB1/SperPFPB2, SperPFK01/SperPFK07, SperPFPA1/SperPFPA2), and S. pimpinellifolium (SpimPFPB1/SpimPFPB2, SpimPFK02/SpimPFK08, SpimPFPA1/SpimPFPA2). In contrast, S. pennellii contained only two collinear pairs (SpenPFK02/SpenPFK07, SpenPFPA1/SpenPFPA2). Overall, most tomato species contained three collinear gene pairs, typically consisting of one PFK subfamily pair and two PFP subfamily pairs. All collinear gene pairs were located on different chromosomes, indicating that PFK gene expansion in tomato species mainly occurred through segmental duplication during evolution.
Collinearity analysis of PFK genes in Solanum species. The red lines, blue lines, orange lines, and black lines show the syntenic gene pairs of PFK genes. (A) S. chilense, S. chmielewskii, and S. corneliomulleri. (B) S. habrochaites, S. galapagense, and S. lycopersicoides. (C) S. lycopersicum, S. lycopersicum var. cerasiforme, and S. neorickii. (D) S. pennellii, S. peruvianum, and S. pimpinellifolium.
Synteny analysis among Solanum species (Figure 6) revealed that homologous segments of PFK genes were present across all species, indicating that these regions are highly conserved during evolution. Within these regions, multiple genes showed orthologous counterparts in all species, with most maintaining a consistent order of arrangement, suggesting that they originated from a common ancestor. The synteny analysis thus highlights both conservation and variation in the pan-genome structure of Solanum, with structural variations potentially contributing to differences in gene regulation and function. Interestingly, unlike other tomato species, S. peruvianum lacks PFK genes on Chr03, suggesting that its glycolytic function may be compensated by isoenzymes or paralogous genes located on other chromosomes to sustain essential metabolic activities. As PFK is a key rate-limiting enzyme in glycolysis, the loss of PFK genes is expected to markedly reduce glycolytic flux, leading to decreased sugar consumption and increased sugar accumulation.
Collinearity analysis of PFK genes among Solanum species. The gray lines in the background show the collinear blocks within tomato and other plant genomes, while the blue lines highlight the syntenic gene pairs of PFK genes.
To further explore the evolutionary relationships among PFK gene family members, a comparative synteny map was constructed for AchPFK, ClPFK, MdPFK, PpPFK, StPFK, VvPFK, and SlPFK (Figure 7). The results showed that orthologous PFK gene pairs were present across kiwifruit, watermelon, apple, peach, potato, grape, and tomato. Specifically, PFK genes in apple, peach, and grape exhibited synteny with PFK members located on tomato Chr02, Chr03, Chr04, Chr07, Chr11, and Chr12; PFK genes in kiwifruit showed synteny with those on tomato Chr03, Chr04, Chr07, Chr08, Chr11, and Chr12; PFK genes in watermelon were syntenic with those on tomato Chr02, Chr03, Chr04, and Chr12; and PFK genes in potato corresponded to syntenic regions on tomato Chr02, Chr04, Chr07, Chr11, and Chr12. These results indicate that PFK genes associated with fruit glycolysis and sugar accumulation in tomato are mainly distributed across Chr02, Chr03, Chr04, Chr07, Chr08, Chr11, and Chr12. Furthermore, 16 orthologous gene pairs were identified between AchPFK and SlPFK, MdPFK and SlPFK, as well as StPFK and SlPFK; six orthologous pairs were found between ClPFK and SlPFK, 11 pairs between PpPFK and SlPFK, and nine pairs between VvPFK and SlPFK. This suggests that PFK genes in kiwifruit, apple, and potato share a closer evolutionary relationship with those in tomato.
Collinearity analysis of PFK genes among different species. The gray lines in the background show the collinear blocks within tomato and other plant genomes, while the red lines highlight the syntenic gene pairs of PFK genes.
Gene duplication is an effective mechanism for organisms to acquire new genes and maintain gene functionality. Thus, duplication plays a crucial role in gene family expansion during evolution. In this study, the substitution rates of homologous PFK gene pairs were calculated to investigate their evolutionary origins (Table 3). The results showed that in cultivated tomato, three homologous gene pairs (SolyPFK02/SolyPFK07, SolyPFPA1/SolyPFPA2, and SolyPFPB1/SolyPFPB2) were all derived from segmental duplication events. Similarly, S. chmielewskii, S. galapagense, S. lycopersicoides, S. lycopersicum var. cerasiforme, S. neorickii, S. peruvianum, and S. pimpinellifolium each contained three homologous gene pairs, all located on Chr02, Chr04, Chr07, Chr11, and Chr12. S. habrochaites, S. chilense, and S. pennellii contained two homologous gene pairs, whereas S. corneliomulleri harbored four homologous pairs distributed across Chr02, Chr04, Chr07, Chr08, Chr11, and Chr12. All of these homologous pairs were found to originate from segmental duplication events.
The ratio of nonsynonymous (Ka) to synonymous (Ks) substitution rates (Ka/Ks) is a widely used parameter in molecular evolution for evaluating whether genes or protein-coding sequences are under selective pressure. A Ka/Ks ratio close to 1 indicates neutral evolution, a ratio greater than 1 suggests positive selection, and a ratio less than 1 reflects purifying selection (Hurst, 2002). In the present study, all PFK genes exhibited Ka/Ks values less than 1, indicating that members of the PFK gene family have experienced strong purifying selection throughout evolution.
Cis-acting element analysis of PFK gene promoters
3.6
Cis-acting element analysis of tomato PFK gene family members revealed four major categories based on their functions: light-responsive elements, plant growth and development-related elements, stress-responsive elements, and phytohormone-responsive elements (Figure 8). Among these, light-responsive elements (Box 4, G-box, GT1-motif, TCT-motif) were the most abundant, with a total of 2036 elements identified. Among these, Box 4 elements were the most numerous (954), followed by G-box elements (527). SchmPFK03 contained the highest number of Box 4 elements, followed by SneoPFK03, while SpimPFK03 harbored the most G-box elements, followed by ShabPFK03. Box 4 represents a DNA module involved in light responses, and G-box is a cis-acting element associated with light responsiveness. As Box 4 elements were detected in all PFK genes, it can be inferred that these genes may participate in light response pathways, thereby regulating photosynthesis and promoting tomato growth and development. In addition, 277 GT1-motif and 278 TCT-motif elements were identified. A total of 395 growth- and development-related elements were detected across all PFK genes, including 165 O2-site elements (involved in zein metabolism regulation), 87 CAT-box elements (associated with meristem expression), 82 GCN4_motif elements (associated with endosperm expression), and 61 circadian elements (involved in circadian growth regulation). Regarding stress responsiveness, 1020 cis-elements were identified, consisting of four main types: ARE, LTR, MBS, and TC-rich repeats. ARE elements, which regulate binding of transcription factors and anaerobic induction, were the most abundant (526). MBS elements (drought-responsive) ranked second (196), followed by low-temperature (LTR) elements (152) and TC-rich repeats involved in defense and stress responses (146). Phytohormone-responsive elements were also highly represented, with 1,342 elements in total. The main types included abscisic acid-responsive elements (ABRE, 432) and methyl jasmonate-responsive elements (CGTCA-motif and TGACG-motif, 455 each). Abscisic acid regulates tomato growth and enhances stress tolerance, while methyl jasmonate promotes defense responses, conferring disease resistance. Collectively, these findings suggest that PFK genes play critical roles in regulating plant growth and development, as well as enhancing stress resistance, thereby contributing to tomato growth and adaptation under adverse environmental conditions.
Cis-acting element distribution of PFK genes. The number of cis-acting elements is indicated by a color scale ranging from dark blue to dark red. Blue signifies the lowest number, while red signifies the highest number.
Expression analysis of PFK genes
3.7
To investigate the potential biological functions of PFK genes during tomato fruit development, their expression profiles were analyzed using RNA-seq data from different developmental stages of Heinz and currant tomatoes. As shown in Figure 9, SolyPFK01, SolyPFK02, SolyPFK04, SolyPFK05, and SolyPFPB2 exhibited consistently low expression levels throughout all growth stages in Heinz tomato. Similarly, in currant tomato, SolyPFK01, SolyPFK02, SolyPFK04, SolyPFK05, SolyPFK06, and SolyPFPB2 maintained low expression levels across all stages. Notably, the expression of SolyPFK04 was negligible in both tomato varieties.
Heatmap of PFK genes expression. Dark blue, light blue, yellow, light red and dark red are used to represent gene expression levels. Blue indicates weak gene expression, red indicates strong gene expression. EP:Expansion stage; MG:Mature green stage; BP:Breaker stage; RRP:Red ripening stage.
SolyPFPB1 exhibited the highest expression levels across all developmental stages, suggesting its extensive involvement in regulating tomato fruit development. Concurrently, the expression of SolyPFPB1 displayed a decreasing trend as fruit development progressed. This pattern may be attributed to the predominance of glycolysis during early fruit development, where high PFK expression and enhanced enzymatic activity facilitate the catabolism of photosynthates to provide energy for cell growth. Conversely, as the fruit transitions from the breaker to the red ripe stage, the downregulation of PFK expression and reduced enzymatic activity lead to a slower glycolytic rate. This reduction in sugar consumption favors sugar accumulation, resulting in a rapid increase in total sugar content. Furthermore, certain genes exhibited differential expression trends between the two tomato varieties, likely reflecting genetic variations in fruit development and metabolic regulation strategies. In Heinz tomato, SolyPFPA1 exhibited high expression levels during fruit development, peaking at the breaker stage; however, its expression significantly decreased at the red ripe stage, dropping to approximately 50% of the level observed at the breaker stage. Similarly, SolyPFPA2 maintained relatively high expression from the expansion to the mature green stage in Heinz tomato, but subsequently declined at the breaker stage and dropped further at the red ripe stage to less than 10% of the breaker-stage level. This downregulation may be attributed to reduced glycolytic activity and enhanced sugar accumulation during fruit maturation. Conversely, in currant tomato, SolyPFPA1 displayed a continuous upward trend, reaching its peak at the red ripe stage with expression levels more than double those of the preceding stage. In contrast, SolyPFPA2 showed a gradual downward trend, reaching its lowest point at the red ripe stage, where expression was approximately one-third of that in the previous stage. Although both belong to the PFP-α subfamily, SolyPFPA1 and SolyPFPA2 exhibited opposite expression patterns in currant tomato, reflecting potential functional differentiation in sugar metabolism pathways during ripening. It is speculated that SolyPFPA1 may be associated with higher metabolic activity or specific ripening regulatory mechanisms, whereas the continuous downregulation of SolyPFPA2 likely reflects an adaptive regulation for sugar preservation and accumulation. Notably, SolyPFK08 maintained high expression levels with a continuous upward trend across all developmental stages in both tomato varieties, suggesting a stable and conserved regulatory role for this gene. Collectively, these results demonstrate that PFK genes exhibit stage-specific and cultivar-specific expression characteristics, highlighting their crucial regulatory functions in tomato fruit growth, glycolysis, and sugar accumulation.
Protein–protein interaction analysis of PFK proteins
3.8
To further elucidate the potential biological functions of PFK proteins, we predicted protein interactions among 12 PFK members using the STRING database (Figure 10). Several proteins exhibited direct interactions, such as SolyPFPA1 with SolyPFPB1, SolyPFPA1 with SolyPFPA2, and SolyPFPA2 with SolyPFPB1. In addition, SolyPFKs were found to interact with other transcriptional regulatory proteins, including GPI, hxk1, Hxk2, HXK3, HXK4, Frk1, FRK2, and SlFBA1. The HXK proteins belong to the hexokinase family, which are key enzymes in sugar metabolism with both catalytic and glucose-sensing functions. Specifically, hxk1 and Hxk2 repress the expression of photosynthesis-related genes while promoting the expression of metabolism-related genes, thereby coordinating carbon source utilization. Hxk2 has also been implicated in regulating crop growth, development, and stress responses, while HXK3 and HXK4 are primarily participate in fundamental metabolic processes. FRK proteins, members of the fructokinase family, specifically catalyze the phosphorylation of fructose to generate fructose-6-phosphate (F6P), with Frk1 and FRK2 being responsible for this activity. SlFBA1 and GPI are also key enzymes in the glycolytic pathway, suggesting that PFK proteins may cooperate with these enzymes to regulate sugar metabolism in tomato fruit. Interestingly, several unannotated proteins, such as A0A3Q7FYU5, A0A3Q7IYI2, and A0A3Q7GAX9, were also identified in the interaction network. Although their functions remain unclear, they exhibited direct or indirect interactions with PFK proteins, implying potential roles in metabolic regulation. Collectively, these findings indicate that PFK proteins have diverse functions and may act in concert with other proteins to regulate tomato growth, development, and sugar metabolism.
Interaction network of PFK proteins.
qRT-PCR analysis of PFK genes
3.9
Phosphofructokinase (PFK) plays a crucial regulatory role during fruit growth and development. In this study, the expression patterns of PFK genes were analyzed in cultivated tomato fruits at different developmental stages using qRT-PCR (Figure 11). Most genesincluding PFK01, PFK02, PFK06, PFK07, PFK08, PFPA2, PFPB1, and PFPB2, exhibited high expression levels during the fruit expansion stage, which gradually decreased by the red ripe stage. This trend suggests that these genes function in glycolysis during the early stages of fruit development to promote growth, whereas their expression declines in later stages, reducing glycolytic activity and thereby facilitating sugar accumulation. Notably, PFK02, PFK06, PFK07, PFK08, PFPA2, and PFPB2 showed significant expression differences between the expansion and red ripe stages, highlighting their prominent regulatory roles during these periods. In contrast, PFK03, PFK04, PFK05, and PFPA1 displayed low expression in early fruit growth but higher expression at maturity, suggesting their involvement in glycolysis throughout fruit development, contributing to the biosynthesis of metabolic compounds. Among them, PFK04 expression gradually increased across developmental stages, implying enhanced glycolytic activity, while PFK03 exhibited its highest expression specifically at the breaker stage, significantly higher than at other stages. Moreover, PFK04, PFK05, and PFPA1 were markedly more highly expressed in the red ripe stage compared to the expansion stage, whereas PFK03 showed no significant difference between these two stages. Interestingly, PFPA2 expression continuously declined throughout fruit development, indicating its primary role in glycolysis during early fruit growth, supplying energy for cell proliferation and expansion. As the fruit matured, decreased PFPA2 activity slowed glycolysis, reducing sugar consumption and promoting sugar accumulation.
qRT-PCR analysis of PFK genes expression in tomato fruits. EP:Expansion stage; MG:Mature green stage; BP:Breaker stage; RRP:Red ripening stage. The standard deviation determined from three biological replicates is shown in error bars. The statistical significance of differences in PFK gene expression levels was determined using one-way ANOVA (p < 0.05). Significant differences (p < 0.05) are indicated by different lowercase letters.
An integrated analysis of RNA-seq and qRT-PCR data reveals that different PFK family members exhibit distinct phase-specific patterns and functional differentiation during tomato fruit development. Specifically, PFK05 was significantly upregulated during the middle-to-late stages of fruit development across multiple tomato varieties, suggesting its potential involvement in metabolic regulation associated with fruit ripening. PFK07 displayed a distinct stage-specific expression pattern characterized by a decline from the expansion to the mature green stage, a significant increase at the breaker stage, and a subsequent downregulation at the red ripe stage, indicating it may play a key regulatory role during the breaker stage. Conversely, PFPA2 expression exhibited a progressive declining trend throughout the entire fruit development period. This pattern, consistent with its RNA-seq profile in currant tomato, implies that PFPA2 may contribute to reducing the glycolytic rate during maturation, thereby facilitating sugar accumulation. In summary, PFK genes play crucial regulatory roles in the glycolytic pathway and sugar accumulation through differential expression during tomato fruit development.
Discussion
4
Wild relatives of tomato are widely distributed, highly adaptable, and exhibit extensive genetic variation, thereby providing valuable genetic diversity and resources for tomato breeding. The assembly and release of the tomato super-pangenome have substantially deepened our understanding of tomato genome evolution, elucidating the evolutionary relationships between wild and cultivated species and facilitating the identification of beneficial allelic variations from wild germplasm. Glycolysis, as a fundamental metabolic pathway, provides energy for cellular metabolism, with phosphofructokinase (PFK) functioning as a key rate-limiting enzyme and major regulatory node in plants. Despite its central role, studies on the PFK gene family in tomato remain scarce. In this study, we performed a comprehensive identification of PFK genes across the Solanum species, encompassing 12 tomato species. A total of 156 PFK genes were identified, including 108 genes in the PFK subfamily and 48 genes in the PFP subfamily. These genes were distributed across seven chromosomes. Specifically, PFK subfamily members were located on chromosomes 3, 4, 7, 8, 11, and 12; the PFP-α subfamily members were found on chromosomes 4 and 12; and the PFP-β subfamily members were distributed on chromosomes 2 and 7. This suggests that gene duplication is a key driving force behind the expansion of this gene family. The members within each subfamily originated from a common ancestral chromosome, and these genes were retained after duplication. Therefore, the chromosomal distribution of the PFK gene family members reveals a potential mechanism for achieving functional diversification through duplication and divergence, providing a genetic basis for the regulation of sugar metabolism in tomato across different tissues and environmental conditions.
In this study, we analyzed the phylogenetic relationships of PFK genes from six representative species, including tomato, kiwifruit, potato, apple, maize, and grape. The PFK gene family was divided into two major subgroups, PFK and PFP. Genes within the same subfamily exhibited high sequence homology, suggesting that duplicated homologs likely originated from a common ancestor and may share similar biological functions (Lynch and Conery, 2000). MePFK03 and OsPFK05 both belong to the PFK_A subfamily, and their expression levels are upregulated under waterlogging stress, indicating that they play important regulatory roles in metabolism under hypoxic conditions in cassava and rice (Wang et al., 2021). Gene duplication is widely recognized as a major driver of rapid gene family expansion and evolutionary innovation. Through chromosomal localization and gene structure analyses, we revealed duplication events that contributed to the expansion of the Solanum pangenome during evolution. A total of 34 pairs of segmental duplications were identified among the 156 PFK genes, whereas no tandem duplications were detected, indicating that segmental duplication has played a dominant role in the expansion of the PFK gene family. Evolutionary pressure analysis further showed that the Ka/Ks ratios of all 34 duplicated gene pairs were less than 1, suggesting that PFK genes in tomato have been subjected to strong purifying selection, thereby maintaining the structural and functional stability of this family throughout long-term evolution. This strong purifying selection indicates that the PFK gene family plays an important role in maintaining the efficiency and robustness of basic metabolism and the glycolytic pathway in tomato. Collinearity analysis within the Solanum species demonstrated that homologous PFK regions are conserved across all tomato species, with multiple orthologous genes displaying highly syntenic arrangements, suggesting their derivation from a common ancestor. Comparative collinearity among tomato and other representative species revealed that kiwifruit, apple, and potato shared the largest number of syntenic PFK homologs with tomato, implying closer evolutionary relationships among these species. In addition, these crops may share common mechanisms in the regulation of sugar metabolism, which provides new genetic resources and theoretical support for systematically identifying PFK homologous genes and achieving coordinated genetic improvement across multiple crops through comparative genomics approaches.
Cis-regulatory elements act as crucial molecular switches in transcriptional regulation, particularly under biotic and abiotic stresses, and play pivotal roles in controlling gene expression (Lescot et al., 2002). To investigate the potential biological functions of tomato PFK genes, we analyzed cis-elements within the 2,000 bp upstream promoter regions. The results revealed that PFK genes harbor a wide range of elements associated with plant growth and development, hormone responsiveness, and stress adaptation. These include elements involved in meristem-specific expression, hormone regulation, and responses to abiotic stresses such as low temperature and drought. Notably, the majority of PFK family members were predicted to respond to multiple phytohormones, particularly abscisic acid (ABA) and methyl jasmonate (MeJA), both of which are key regulators in plant stress signaling pathways. ABA and MeJA are known to enhance plant tolerance by increasing antioxidant enzyme activity, scavenging reactive oxygen species, and promoting the accumulation of osmoprotectants, thereby mitigating stress-induced damage. Accordingly, it is plausible that PFK genes participate in abiotic stress responses through ABA- and MeJA-mediated signaling pathways, contributing to improved stress tolerance in tomato. This indicates that PFK genes in tomato not only participate in fundamental growth and developmental processes throughout the plant’s life cycle but also play crucial roles in responding to various environmental challenges.
Phosphofructokinases (PFKs) have been implicated in diverse biological processes, including tissue development, sugar accumulation in fruits, and responses to abiotic stresses. For example, PFP1-1, PFP1-2, and PFP1-3 regulate starch deposition and soluble sugar synthesis in rice grains (Chen et al., 2020a; Duan et al., 2016). In maize, ZmPFK2 and ZmPFK6 are highly expressed in roots, stems, and leaves, and actively respond to abiotic stresses such as drought and low temperature (Fu et al., 2025). Similarly, MePFK03 expression is significantly induced in cassava roots under waterlogging stress (Wang et al., 2021). The potential biological functions of PFK genes during tomato fruit development were investigated in this study. Based on RNA-seq and qRT-PCR data, the expression patterns of PFK genes were analyzed at different stages of tomato fruit development. The results indicate that PFK genes play important regulatory roles in fruit growth, glycolysis, and sugar accumulation in tomato.
Fruit development is a complex process in which plants convert photosynthetic products into edible tissues. In this study, we observed that PFK genes exhibit differential expression patterns across various stages of tomato fruit development, which is highly correlated with their pivotal roles in regulating fruit sugar content. We hypothesize that PFK genes may modulate the metabolic flux of the glycolytic pathway, thereby affecting the transport efficiency of photoassimilates from source to sink, their metabolic conversion within the fruit, and ultimately, the level of sugar accumulation.
Conclusion
5
Phosphofructokinase (PFK), as a major rate-limiting enzyme and regulatory node in glycolysis, plays essential roles in plant growth, stress responses, fruit development, and sugar accumulation. In this study, a total of 156 PFK genes were systematically identified across 12 Solanum species, which were unevenly distributed on seven chromosomes. Phylogenetic analysis divided these genes into two major subfamilies, PFK and PFP (further classified into PFP-α and PFP-β). Within each subfamily, motif compositions were highly conserved, whereas certain motifs were unique to specific subfamilies, suggesting functional diversification of PFK proteins. Collinearity analysis indicated that segmental duplication was the main driver of PFK family expansion, and Ka/Ks analysis revealed that strong purifying selection has shaped their evolutionary trajectory. Cis-acting element analysis identified numerous motifs associated with development, abiotic stress, and hormone responses, implying that PFK genes contribute to tomato growth and stress adaptation. Protein–protein interaction analysis further suggested that PFK proteins cooperate with other metabolic regulators to promote fruit growth and development. Moreover, RNA-seq and qRT-PCR data demonstrated stage-specific expression of PFK genes during tomato fruit development, highlighting their involvement in glycolysis and sugar accumulation. Collectively, this study provides a comprehensive characterization of the PFK gene family in Solanum, offering valuable insights into their evolutionary patterns, regulatory mechanisms, and potential biological functions in abiotic stress responses and fruit development.
The reference list from the paper itself. Each links out to its DOI / PubMed record.
- 1Bailey T. L. Boden M. Buske F. A. Frith M. Grant C. E. Clementi L. (2009). MEME SUITE: tools for motif discovery and searching. Nucleic Acids Research 37, 202–208. 10.1093/nar/gkp 335 19458158 PMC 2703892 · doi ↗ · pubmed ↗
- 2Baldet P. Hernould M. Laporte F. Mounet F. Just D. Mouras A. (2006). The expression of cell proliferation-related genes in early developing flowers is affected by a fruit load reduction in tomato plants. J. Exp. Bot. 57, 961–970. 10.1093/jxb/erj 082 16488916 · doi ↗ · pubmed ↗
- 3Bapteste E. Moreira D. Philippe H. (2003). Rampant horizontal gene transfer and phospho-donor change in the evolution of the phosphofructokinase. Gene 318, 185–191. 10.1016/s 0378-1119(03)00797-2 14585511 · doi ↗ · pubmed ↗
- 4Chen Y. H. Zhang Q. Hu W. C. Zhang X. T. Wang L. M. Hua X. T. (2017). Evolution and expression of the fructokinase gene family in saccharum. BMC Genomics 18, 1–15. 10.1186/s 12864-017-3535-7 28222695 PMC 5319016 · doi ↗ · pubmed ↗
- 5Chen C. He B. Liu X. Ma X. Liu Y. Yao H. Y. (2020 a). Pyrophosphate‐fructose 6‐phosphate 1‐phosphotransferase (PFP 1) regulates starch biosynthesis and seed development via heterotetramer formation in rice (Oryza sativa L.). Plant Biotechnology Journal 18, 83–95. 10.1111/pbi.13173 31131526 PMC 6920184 · doi ↗ · pubmed ↗
- 6Chen C. Chen H. Zhang Y. Thomas H. R. Frank M. H. He Y. (2020 b). T Btools: an integrative toolkit developed for interactive analyses of big biological data. Mol. Plant 13, 1191–1202. 10.1016/j.molp.2020.06.009 32585190 · doi ↗ · pubmed ↗
- 7Dai Q. Xu R. Q. Li N. Wang B. K. Wang J. Huang S. Y. (2022). Genome-wide characterization and analysis of GRF gene family in the Solanum pennellii. Xinjiang Agric. Sci. 59. 2456–2465.
- 8Duan E. C. Wang Y. H. Liu L. L. Zhu J. P. Zhong M. S. Zhang H. (2016). Pyrophosphate: Fructose-6-phosphate 1-phosphotransferase (PFP) regulates carbon metabolism during grain filling in rice. Plant Cell Rep. 35, 1321–1331. 10.1007/s 00299-016-1964-4 26993329 PMC 4869756 · doi ↗ · pubmed ↗