Correction to: Nattokinase attenuates bisphenol A or gamma irradiation-mediated hepatic and neural toxicity by activation of Nrf2 and suppression of inflammatory mediators in rats
Mustafa M. M. Elbakry, Somaya Z. Mansour, Hamed Helal, Esraa S. A. Ahmed

Abstract
Genes, proteins, chemicals, diseases, species, mutations and cell lines named across the full text — each resolved to its canonical identifier and authoritative record.
Click any figure to enlarge with its caption.
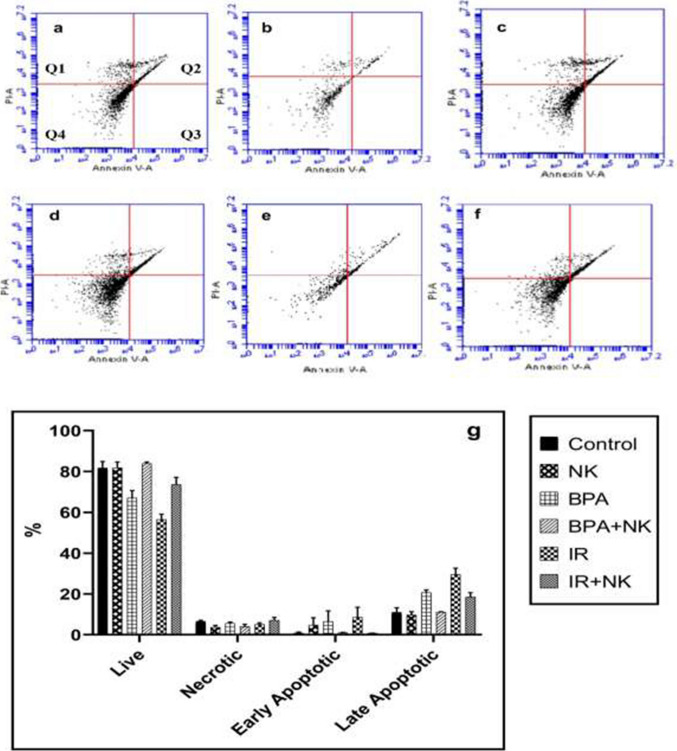 Figure 1
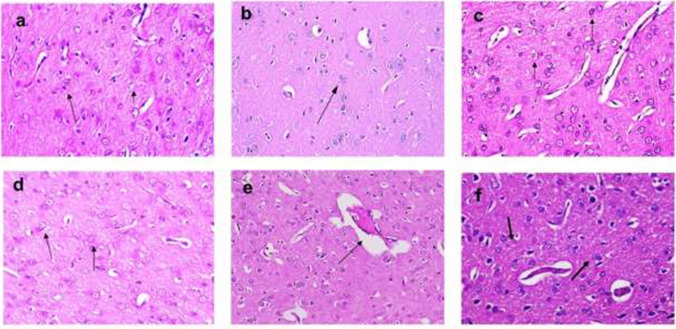 Figure 2
Peer Reviews
No public reviews on file for this paper yet. If you reviewed it on a platform where reviews are public (OpenReview, ICLR, NeurIPS, ICML), you can paste yours below so the community can read it here.
Videos
No videos yet. Explain this paper in a talk, walkthrough, or lecture? Add one.
Taxonomy
TopicsEffects and risks of endocrine disrupting chemicals · Microplastics and Plastic Pollution · GABA and Rice Research
Correction to: Environmental Science and Pollution Research
10.1007/s11356-022-21126-9
The authors sincerely apologize for the unintended errors which occurred while uploading the figures (Figure 7 and Figure 9) to the journal platform during the article publication.
- In Figure 7, the incorrect image was uploaded in error for Figure 7c
- In Figure 9, the incorrect image was uploaded in error for Figure 9f
As a corrective action to solve such concern, we attached the correct figures (Figure 7 and Figure 9) that can be uploaded instead of the previously uploaded figure.
We appreciate your kindness and please accept the authors' apology for that accidental mistake.Fig. 7 Dot plot chart of the percentages of live (Q4), necrotic (Q1), late apoptotic (Q2), and early apoptotic (Q3) cells representative of one sample, a control group, b NK group, c BPA group, d BPA+ NK group, e IR group, and f I R+ NK group. g Mean values of three samples of the percentages of live, early apoptotic, late apoptotic, and necrotic cells after injection of BPA or exposure to γ-radiation, and treatment with NK. FL1-H: a detector for fluorescence height for annexin V; FL2-H: a detector for fluorescence height for PI. Q1 represents necrosis, Q2 represents late apoptosis, Q3 represents early apoptosis, and Q4 represents live cellsFig. 9 Photomicrograph of the cerebral cortex of control and NK groups (a, b) showing a normal arrangement of neuronal cells in association with small blood vessels in between (arrow) (H&E × 200). BPA: Photomicrograph of the cerebral cortex (c) showing eosinophilic apoptotic bodies and perivascular edema (arrow) (H&E ×200). BPA+ NK: Photomicrograph of the cerebral cortex (d) showing few numbers of degenerated neuronal cells with pyknotic nuclei (arrow) (H&E ×200). IR: Photomicrograph of the cerebral cortex (e) showing eosinophilic apoptotic bodies and perivascular edema with congestion (arrow) (H&E× 200). IR+ NK: Photomicrograph of the cerebral cortex (f) showing few numbers of apoptotic neuronal cells with focal gliosis (arrow) (H&E×200)