Blood DNA methylation markers are associated with diabetic kidney disease progression in type 1 diabetes
Anna Syreeni, Emma H. Dahlström, Laura J. Smyth, Claire Hill, Stefan Mutter, Valma Harjutsalo, Zhuo Chen, Rama Natarajan, Andrzej S. Krolewski, Joel N. Hirschhorn, Jose C. Florez, Alexander P. Maxwell, Per-Henrik Groop, Amy Jayne McKnight, Niina Sandholm

TL;DR
This study finds DNA methylation markers in blood that predict kidney disease progression in type 1 diabetes patients.
Contribution
Identifies 11 novel methylation sites associated with diabetic kidney disease progression in type 1 diabetes.
Findings
Eleven methylation sites were linked to diabetic kidney disease progression.
Methylation at cg01730944 near CDKN1C was associated with early-stage progression.
Survival models with methylation markers improved risk prediction for early-stage disease.
Abstract
DNA methylation has been shown to be associated with kidney function and diabetic kidney disease (DKD), but prospective studies are scarce. Therefore, we conducted epigenome-wide association studies (EWASs) on early- and late-stage DKD progression using DNA methylation data obtained by analysing baseline blood samples from participants in the Finnish Diabetic Nephropathy Study type 1 diabetes cohort. We included 403 individuals with normal AER (early-stage progression group) and 372 individuals with severe albuminuria (late-stage progression group), and followed up DKD progression, defined as a decrease in eGFR to <60 ml/min per 1.73 m2 in the early-stage progression group, and end-stage kidney disease (ESKD) in the late-stage group. Replication was conducted in two type 1 diabetes cohorts in addition to publicly available EWAS summary statistics from diabetes and general population…
Genes, proteins, chemicals, diseases, species, mutations and cell lines named across the full text — each resolved to its canonical identifier and authoritative record.
Click any figure to enlarge with its caption.
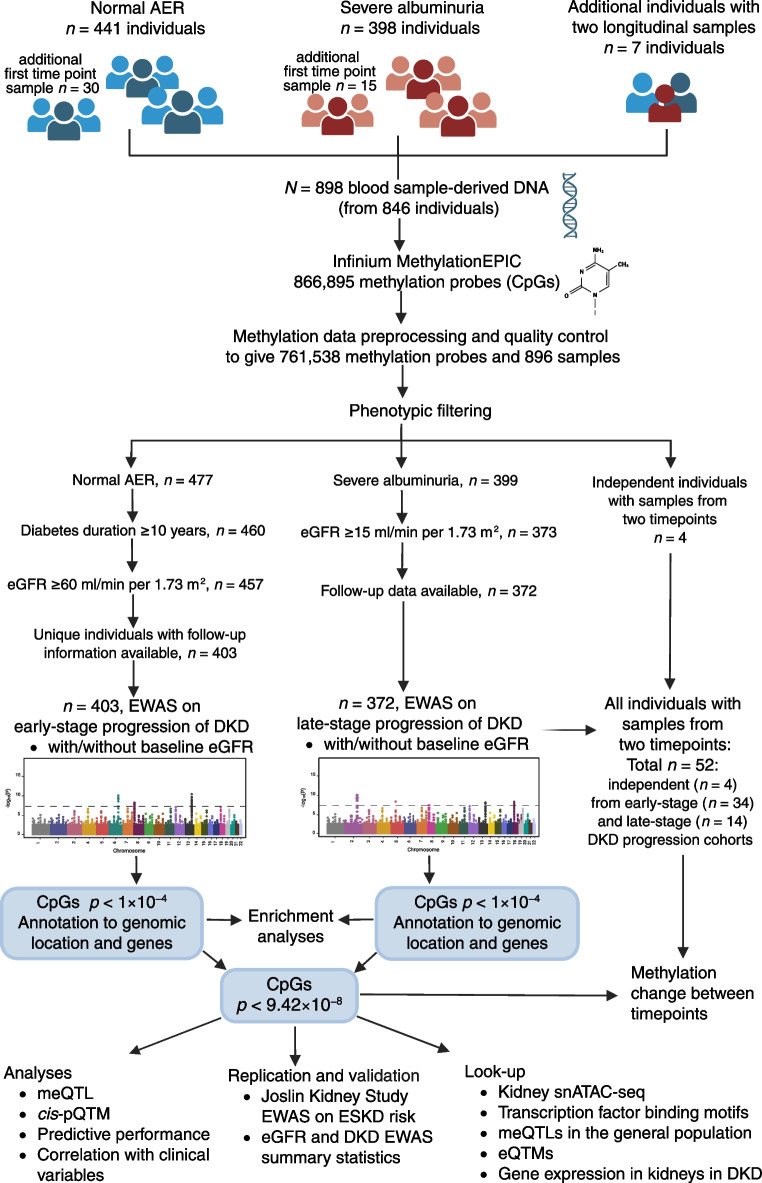 Figure 1
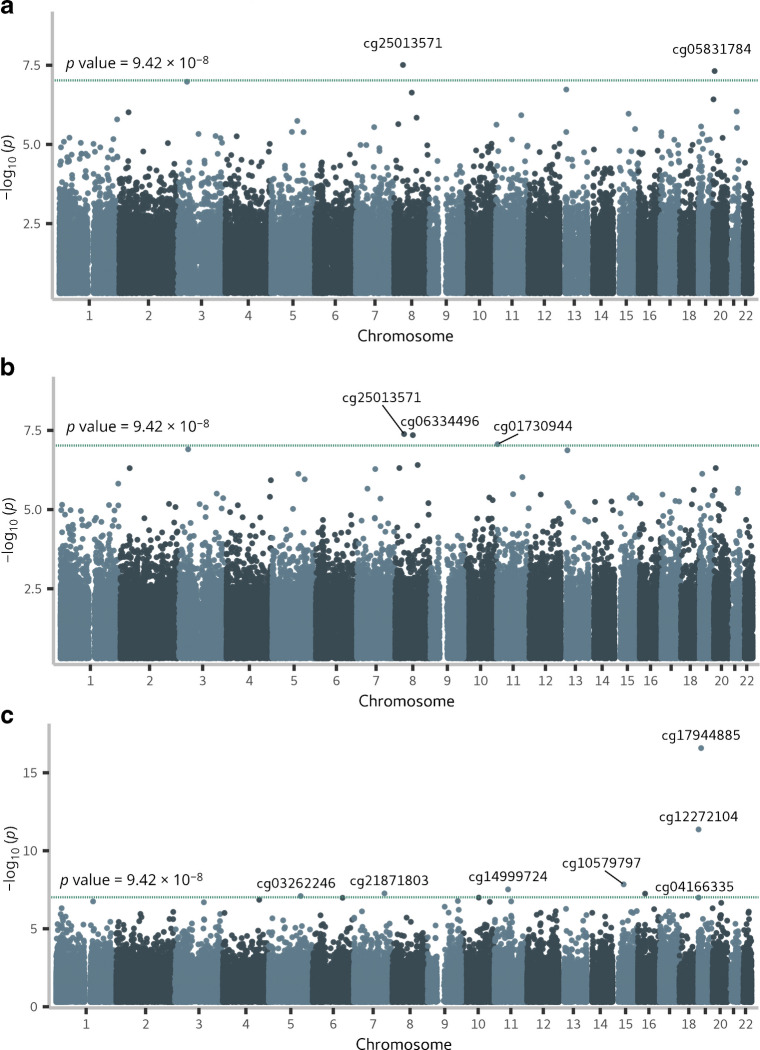 Figure 2
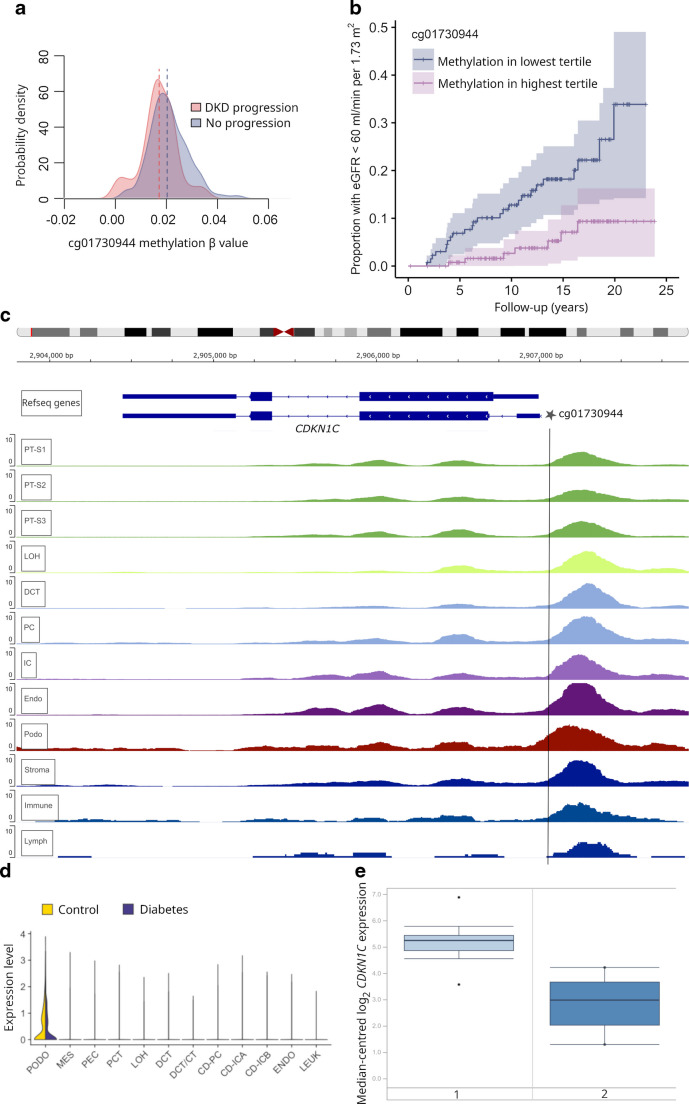 Figure 3
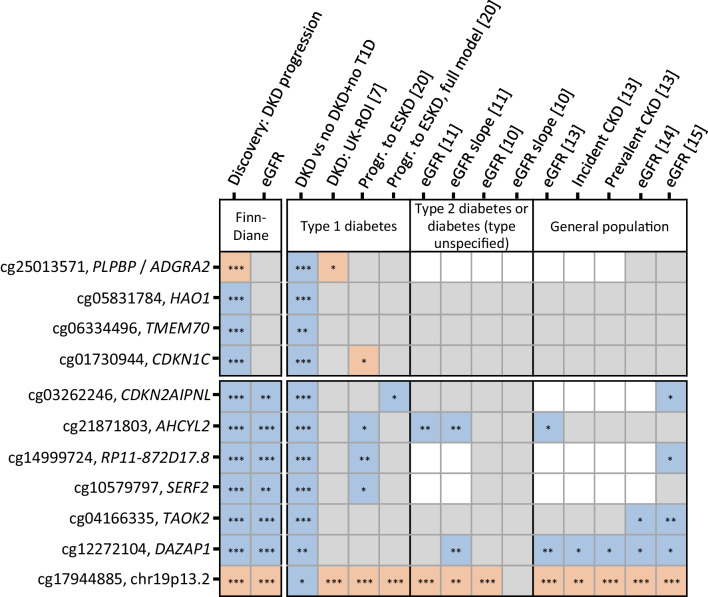 Figure 4
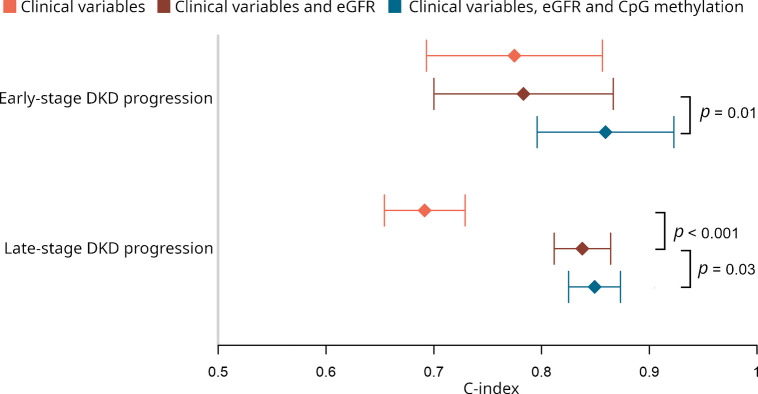 Figure 5
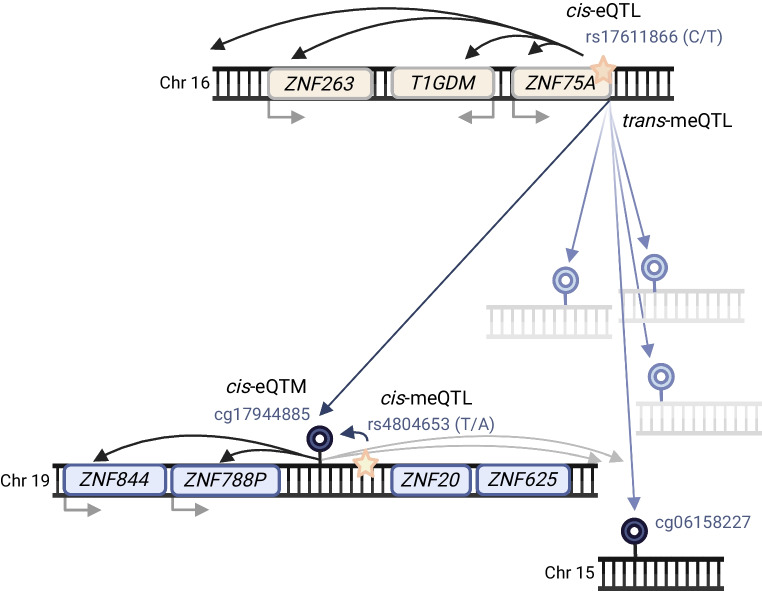 Figure 6
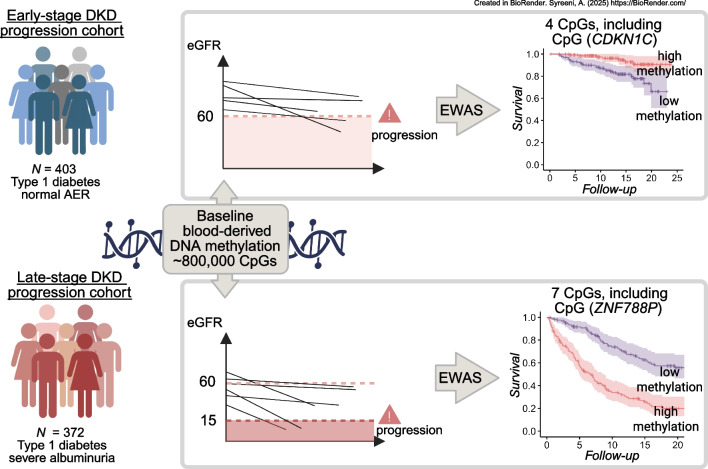 Figure 7
 Figure 8
- —http://dx.doi.org/10.13039/501100013500Diabetestutkimussäätiö
- —http://dx.doi.org/10.13039/100015736Folkhälsanin Tutkimussäätiö
- —Helsinki University Hospital
- —Northern Ireland Kidney Research Fund Fellowship
- —http://dx.doi.org/10.13039/100010116Medicinska Understödsföreningen Liv och Hälsa
- —Finska Läkaresällskapet
- —http://dx.doi.org/10.13039/501100002341Research Council of Finland
- —http://dx.doi.org/10.13039/501100009708Novo Nordisk Fonden
- —HSC R&D Division
- —http://dx.doi.org/10.13039/100000062National Institute of Diabetes and Digestive and Kidney Diseases
- —Wanek family project for the cure of Type 1 diabetes (City of Hope Beckman Research Institute)
- —http://dx.doi.org/10.13039/501100006306Sigrid Juséliuksen Säätiö
- —http://dx.doi.org/10.13039/100000009Foundation for the National Institutes of Health
- —http://dx.doi.org/10.13039/100010113Wilhelm och Else Stockmanns Stiftelse
- —University of Helsinki (including Helsinki University Central Hospital)
Peer Reviews
No public reviews on file for this paper yet. If you reviewed it on a platform where reviews are public (OpenReview, ICLR, NeurIPS, ICML), you can paste yours below so the community can read it here.
Videos
No videos yet. Explain this paper in a talk, walkthrough, or lecture? Add one.
Taxonomy
TopicsEpigenetics and DNA Methylation · Chronic Kidney Disease and Diabetes · Genetic Associations and Epidemiology
Introduction
Diabetic kidney disease (DKD) is a devastating complication of diabetes. One-third of individuals with type 1 diabetes and severe albuminuria develop end-stage kidney disease (ESKD) within 15 years [1]. Both genetic [2, 3] and epigenetic [4] variability affects the risk of DKD. A common epigenetic modification, DNA methylation (the addition of a methyl group at CpG sites) contributes to the regulation of gene expression. Epigenome-wide association studies (EWASs) using blood-derived methylation data have identified methylation sites that are associated with DKD [5–8] and ESKD [9] in type 1 diabetes. Additionally, kidney function, assessed by eGFR, is associated with DNA methylation both in individuals with diabetes [10–12] and those without [13–15]. Remarkably, some findings, such as methylation at cg17944885, have been replicated across studies in diabetes cohorts, the general population and multiple ethnic groups. Thus, DNA methylation studies may provide both insights into causal disease pathways and robust prognostic biomarkers to identify individuals at risk.
Importantly, DNA methylation can represent either the cause or consequence of the disease. For example, hyperglycaemia may alter DNA methylation and thereby contribute to metabolic memory, i.e. the prolonged effect of hyperglycaemia on microvascular complications [16, 17]. Additionally, genetic variation can regulate DNA methylation [18–20].
A cross-sectional study showed differential blood DNA methylation at the early and late stages of DKD, indicating differences in epigenetic signatures attributed to the disease stage [21]. Furthermore, we and others have previously identified CpGs associated with the progression of advanced DKD to ESKD [7, 20], and a recent study identified methylation sites associated with incident chronic kidney disease (CKD) in type 2 diabetes [22]. However, no EWAS have investigated early-stage progression of DKD in type 1 diabetes. Here, we hypothesised that CpG methylation differences may precede early-stage DKD progression in type 1 diabetes, and conducted a prospective study to analyse baseline DNA methylation in disease progression at the early and late stages of DKD. Additionally, we searched for genetic variants associated with methylation, i.e. methylation quantitative trait loci (meQTLs), and serum protein associations for our key methylation findings.
Methods
Cohorts
The study included participants from the ongoing multicentre Finnish Diabetic Nephropathy (FinnDiane) Study, which was approved by the Ethics Committee of Helsinki University Central Hospital (491/E5/2006, 238/13/03/00/2015 and HUS-3313-2018) and was conducted according to the Declaration of Helsinki. The whole FinnDiane cohort comprises over 6000 individuals with type 1 diabetes, of which this study included 779. The study included 62% male participants and 38% female participants, thus, a slight over-representation of male participants, although we did not more formally evaluate the representativeness of this subcohort compared with the total FinnDiane cohort. At the study visit, participants sign an informed consent and complete questionnaires with the attending nurse or physician. All participants were Finnish residents of European ancestry. Basic anthropometric measurements are taken [23], and blood samples are drawn (for DNA extraction and measurement of serum creatinine, for example). Albuminuria is classified based on two of three consecutive 24 h or timed overnight urine collections.
DKD progression
The early-stage DKD progression subcohort comprised 403 individuals (Fig. 1) with a type 1 diabetes duration ≥10 years, normal AER (AER <30 mg/24 h or <20 μg/min) and eGFR ≥60 ml/min per 1.73 m^2^. We collected serum creatinine data from baseline visits and medical records until 10 March 2022, converted measurements obtained using the Jaffe method to isotope dilution mass spectroscopy (IDMS) units (creatinine_IDMS_=0.953 × creatinine_Jaffe_ – 7.261) and calculated the eGFR using the revised Chronic Kidney Disease – Epidemiology Collaboration (CKD-EPI) equation [24].Fig. 1. Study flow chart. snATAC-seq, single-nucleus transposase-accessible chromatin with sequencing. Created in BioRender. Syreeni, A. (2025) https://BioRender.com/
At least one follow-up eGFR measurement was required; the median number was 15 (IQR 8–24). Early-stage DKD progression was defined as a decrease in eGFR to <60 ml/min per 1.73 m^2^. Thus, the follow-up lasted from baseline to the first eGFR value <60 or the final eGFR record.
The 372 participants in the late-stage DKD progression subcohort had type 1 diabetes, severe albuminuria (AER >300 mg/24 h or >200 µg/min) and eGFR >15 ml/min per 1.73 m^2^ at baseline. We collected data on ESKD, defined as requiring dialysis and/or a transplant, and data on mortality from the Finnish Care Register for Health Care, study visit questionnaires and medical records. For individuals who were not yet being treated for ESKD, an eGFR value <15 ml/min per 1.73 m^2^ was considered as an ESKD event. The participants were followed up until the event, death or 31 December 2020.
Longitudinal samples
Altogether, 52 individuals had DNA samples available at two timepoints, 3.6–16.4 years apart. Of these, 48 had one DNA sample analysed as part of the DKD progression cohorts (see electronic supplementary material [ESM] Fig. 1), whereas four individuals were new. Thirty of the 52 individuals had normal AER and eGFR >60 ml/min per 1.73 m^2^ at both timepoints. The remaining individuals had normal AER (n=8) or moderate albuminuria (n=14; AER of 30–300 mg/24 h or 20–200 µg/min) at the first timepoint and progressed to severe albuminuria. Additionally, we calculated eGFR slopes between timepoints from three or more eGFR values obtained over a period of 2 years.
DNA methylation assessment
We analysed genome-wide DNA methylation in blood samples using the Infinium MethylationEPIC version 1.0 BeadChip (Illumina) within the Northern Ireland Regional Genetics Centre in Belfast, UK. Altogether 798 samples were from our previous cross-sectional GENIE Consortium DKD EWAS [7], while 100 were new. Quality control (QC) was performed using ‘RnBeads’ on 898 samples and 866,895 methylation probes, of which two samples and 105,357 probes were removed (ESM Methods). We extracted methylation M values from the remaining 761,538 probes from 896 samples. We calculated principal components (PC) from the non-negative control probe intensities and the mean M value of probes that are known to have invariable methylation levels in blood sample-based DNA [25]. These were used to correct for technical deviations.
Statistical analysis
DKD progression
We analysed associations between each methylation site and DKD progression separately for the early- and late-stage progression cohorts using Cox proportional hazards models adjusted for sex (confirmed from the methylation data), baseline age, estimated proportions of six white blood cell types, PCs 1–3 and the intrapersonal mean M value from invariable sites. The second model additionally included baseline eGFR. The significance threshold was p<9.4 × 10^−8^, as recommended [26].
Longitudinal analyses
Using the two-timepoint data, we compared the methylation change (Δmethylation) over time between DKD progressors and non-progressors using logistic regression and residualised methylation values. Additionally, we tested the association between eGFR slope and Δmethylation using linear regression (ESM Methods).
Replication
We included several look-up replication cohorts: a UK and Republic of Ireland (UK-ROI, n=504) type 1 diabetes cohort with DKD EWAS data [7] and a Joslin Kidney Study (JKS) cohort with prospective ESKD EWAS data (n=277) [20], as well as eGFR EWAS summary statistics from the Chronic Renal Insufficiency cohort [10], the Hong Kong Diabetes Register [11] and the general population [13–15]. To assess whether diabetes contributed to the associations, we compared ESKD arising from DKD (ESKD-DKD, n=108) vs ESKD due to other causes (n=71) [9], DKD (n=252, UK-ROI) vs individuals without diabetes nor kidney disease (n=340) from the Northern Ireland Cohort for the Longitudinal Study of Ageing (NICOLA) [27], and ESKD-DKD (n=108, UK-ROI and Renal Transplant Collection samples [28]) vs the 340 NICOLA participants.
Sensitivity analyses
We conducted a 10-year risk analysis in the late-stage DKD progression subcohort and competing risk analyses in both DKD progression cohorts. To study pleiotropy, we tested correlation between methylation and baseline clinical variables. Additionally, we analysed the association between DNA methylation and baseline eGFR using R package ‘limma’ (version 3.46.0, ESM Methods).
Predictive performance
We created Cox regression models using clinical risk factors, both with and without CpG methylation values. Relevant clinical variables meeting p value thresholds in univariable Cox models (p<0.25) or multivariable Cox models (p<0.10) for early- and late-stage DKD progression were chosen. Additionally, we included age, sex and methylation assay QC variables in all models, including the clinical model, to separate the methylation effect from technical variability. Altogether, we compared three models comprising: (1) clinical variables; (2) clinical variables and baseline eGFR; and (3) clinical variables, eGFR and CpG methylation. Additionally, we studied the cumulative effect of methylation sites by incorporating all significant CpGs into the model comprising clinical variables and eGFR. The DKD progression models were evaluated using fivefold cross-validation (ESM Methods).
Annotation of methylation sites
CpG location
For methylation sites reaching epigenome-wide significance (p<9.4 × 10^−8^), we examined the overlap of CpG genomic locations with kidney open chromatin peaks [29–32] using the Susztaklab Kidney Biobank, transcription factor (TF) motifs, expression quantitative trait methylation (eQTM; methylation vs gene expression) datasets [30, 33–35] and meQTLs [19, 36]. We also performed our own meQTL analyses to identify local (cis, ±1 Mb) genetic effects and distal (trans) genetic effects for the CpGs (ESM Methods).
Kidney gene expression
Differential gene expression in human kidneys in CKD/DKD was studied in datasets [37–40] collected in the Nephroseq database (ESM Methods). Additionally, we studied two human DKD kidney tissue gene expression datasets [41, 42] that were pre-processed similarly to the previous study [43]. Kidney single-cell gene expression data [44] were accessed through the Kidney Interactive Transcriptomics data portal (https://humphreyslab.com/SingleCell/).
Protein expression
Quality-controlled serum proteomic data, obtained using the OLINK HT assay, were available for 315 individuals from the FinnDiane EWAS cohorts (188 with normal AER, 127 with severe albuminuria). We analysed the association between methylation and protein levels of cis-located genes (cis protein quantitative trait methylation [cis-pQTM]; ESM Methods). Thereafter, we studied the association between significant cis-pQTM proteins and incident kidney diseases in the UK Biobank (UKBB) [45] (ESM Methods).
Enrichment analysis
We analysed the enrichment of gene ontology (GO) terms and Kyoto Encyclopedia of Genes and Genomes (KEGG) pathways for genes related to early- and late-stage DKD progression EWAS results using the R package ‘missMethyl’ (version 1.22.0). We assessed trait enrichment using EWAS Toolkit.
Results
CpGs associate with DKD progression
In the early-stage DKD progression subcohort of 403 individuals with normal AER, 37% were women, and the mean age was 42 years (Table 1). Over the follow-up period (median 13.1 years, IQR 8.4–16.9), DKD progressed in 49 individuals. EWAS identified two methylation sites significant for early-stage progression (p<9.4 × 10^−8^): cg25013571 between PLPBP and ADGRA2 (HR 3.35; 95% CI 2.18, 5.13), and cg05831784 in HAO1 (HR 0.42; 95% CI 0.30, 0.57) (Table 2, Fig. 2 and ESM Fig. 2). cg25013571 (PLPBP/ADGRA2) remained significant in an EWAS adjusted for baseline eGFR, but the cg05831784 (HAO1) association was modestly attenuated. Furthermore, in the eGFR-adjusted EWAS, cg06334496 in TMEM70 and cg01730944 close to the transcription start site of CDKN1C, also known as p57^Kip2^, were significantly associated with early-stage DKD progression. cg01730944 was generally hypomethylated (methylation β values <0.05) (Fig. 3a and ESM Fig. 3), and low methylation values were associated with the risk of progression (Fig. 3b). In the competing risk analysis (n=44 death events), cg06334496 (TMEM70) was no longer significant (p=1.1 × 10^−6^, ESM Table 1). Table 1. Baseline characteristics of the study participantsEarly-stage DKD progression cohort (n=403)Late-stage DKD progression cohort (n=372)No eventEvent (eGFR decline <60) during follow-uppNo eventEvent (ESKD) during follow-upp**n35449167205Women131 (37)20 (41)0.6153 (32)89 (43)0.02Age, years42 ± 1145 ± 140.1343 ± 1243 ± 100.67T1D duration, years27 ± 928 ± 120.7430 ± 930 ± 100.69Systolic BP^a^, mmHg133 ± 18135 ± 180.36143 ± 17149 ± 211.8 × 10^−3^Diastolic BP^a^, mmHg78 ± 8.678 ± 9.70.7282 ± 9.984 ± 110.18Pulse pressure^a^, mmHg55 ± 1558 ± 190.2860 ± 1665 ± 198.9 × 10^−3^HbA_1c_^b^, mmol/mol66.2 ± 13.670.2 ± 15.80.1171.7 ± 16.076.0 ± 18.00.03HbA_1c_^b^, %8.2 ± 3.48.6 ± 3.60.118.7 ± 3.69.1 ± 3.80.03Central obesity^c^163 (46)31 (66)0.01119 (73)134 (66)0.17Triglycerides^d^, mmol/l0.93 (0.71–1.27)1.05 (0.85–1.27)0.041.27 (0.93–1.86)1.60 (1.19–2.46)2.0 × 10^−6^Granulocytes, %63 (57–70)63 (57–69)0.8467 (60–73)69 (64–74)9.8 × 10^−3^Monocytes, %7 (5–9)8 (6–9)0.438 (6–10)8 (6–9)0.84CD4^+^ T cells, %11 (8–14)12 (7–17)0.1710 (7–13)9 (6–13)0.17CD8^+^ T cells, %5 (2–8)3 (1–8)0.264 (2–8)4 (1–7)0.30B cells, %3 (2–5)3 (2–5)0.863 (2–5)2 (1–4)4.6 × 10^−5^NK cells, %4 (0.1–7)5 (1–8)0.200.9 (0.0–4.6)0.7 (0.0–4.3)0.76eGFR, ml/min per 1.73 m^2^105 ± 14100 ± 190.0785 (71–106)43 (28–66)1.5 × 10^−29^CVD^e^18 (5.1)8 (16)2.7 × 10^−3^34 (20)49 (24)0.42Follow-up time, years13.5 (8.9–17.3)9.7 (4.4–14.4)8.0 × 10^−4^14.1 (7.5–21.3)6.0 (2.9–10.0)4.2 × 10^−19^Categorical data are expressed as n (%). Continuous data are expressed as mean ± SD or median (IQR). The χ^2^ test was used for comparing frequencies of categorical variables between the event and no event groups, and unpaired t test or the non-parametric Mann–Whitney U test was used for continuous variables^a^Systolic and diastolic BP and pulse pressure: values were missing for two individuals in the early-stage DKD progression group (both in the ‘no event’ group) and for five individuals in the late-stage DKD progression group (two in the ‘no event’ group; three in the ‘event’ group)^b^HbA_1c_ values were missing for three individuals in the early-stage diabetic kidney disease progression group (two in the ‘no event’ group; one in the ‘event’ group) and for four individuals in the late-stage DKD progression group (one in the ‘no event’ group; three in the ‘event’ group)^c^Central obesity was defined as WHR >0.5. Central obesity values were missing for five individuals in the early-stage DKD progression group (three in the ‘no event’ group; two in the ‘event’ group) and for seven individuals in the late-stage DKD progression group (four in the ‘no event’ group; three in the ‘event’ group)^d^Triglyceride values were missing for two individuals in the early-stage DKD progression group (one in the ‘no event’ group; one in the ‘event’ group) and one individual in the late-stage DKD progression group (in the ‘event’ group)^e^The self-reported CVD status is a combination of acute myocardial infarction, coronary artery bypass operation, stroke, peripheral vascular bypass operation and/or coronary heart diseaseNK, natural killer; T1D, type 1 diabetesTable 2Epigenome-wide significant methylation CpGs sites for the progression of DKDCpG probeChromosomeClosest gene(s)Association with DKD progression^a^Association with baseline eGFR in the subcohort^b^Association with baseline eGFR in the combined cohort^c^HR (95% CI)pppEarly-stage DKD progression EWAS^d^ cg250135718PLPBP and ADGRA23.35 (2.18, 5.13)3.1 × 10^−8^0.480.33 cg0583178420HAO10.42 (0.30, 0.57)4.8 × 10^−8^2.3 × 10^−3^0.23Early-stage DKD progression EWAS, eGFR-adjusted cg250135718PLPBP and ADGRA23.53 (2.25, 5.54)4.1 × 10^−8^0.480.33 cg063344968TMEM700.12 (0.06, 0.26)4.5 × 10^−8^0.580.56 cg0173094411CDKN1C0.43 (0.31, 0.58)8.6 × 10^−8^0.350.74Late-stage DKD progression EWAS^e^ cg032622465CDKN2AIPNL0.23 (0.13, 0.39)8.0 × 10^−8^1.7 × 10^−8^5.5 × 10^−6^ cg218718037AHCYL20.38 (0.26, 0.54)5.4 × 10^−8^6.7 × 10^−8^6.6 × 10^−9^ cg1499972411RP11-872D17.8 (PRG2 transcript variant)0.29 (0.19, 0.45)3.0 × 10^−8^4.2 × 10^−10^1.4 × 10^−11^ cg1057979715SERF20.31 (0.21, 0.46)1.4 × 10^−8^3.4 × 10^−5^6.7 × 10^−5^ cg0416633516TAOK20.28 (0.18, 0.44)5.6 × 10^−8^1.1 × 10^−5^2.7 × 10^−5^ cg1227210419DAZAP10.32 (0.23, 0.44)4.3 × 10^−12^1.8 × 10^−10^4.1 × 10^−12^ cg1794488519ZNF788P and ZNF625–ZNF202.21 (1.84, 2.65)2.6 × 10^−17^1.1 × 10^−21^3.7 × 10^−28^^a^Cox proportional hazards model results for DKD progression: the same covariates were included in both early- and late-stage DKD progression EWAS: baseline age, sex, estimated proportions for six white blood cell types, technical PC1, PC2 and PC3, and sample mean M values from invariable sites. The HR represents a 1 unit change in the methylation M value of the CpG site^b^Association with eGFR in the subcohort (early- or late-stage DKD progression). Association was determined for log_2_-transformed eGFR values using limma and the same covariates as in the Cox proportional hazards model. ESM Table 2 shows the corresponding effect size^c^Association with eGFR in the combined cohort including all individuals from the early- and late-stage DKD progression cohorts (n=775). Albuminuria status (normal AER or severe albuminuria) was added to a limma model that included the same covariates as in the subcohort analyses. Corresponding effect sizes are reported in ESM Table 2^d^n=403; n=49 for eGFR decline <60 ml/min per 1.73 m^2^ events^e^n=372; n=205 for ESKD eventsFig. 2Manhattan plots of EWAS results for DKD progression. (a) Results from the EWAS on early-stage DKD progression, (b) results from early-stage DKD progression EWAS additionally adjusted for baseline eGFR, and (c) results from the EWAS on late-stage DKD progression to ESKD. Methylation sites that reached epigenome-wide significance (p<9.42 × 10^−8^, green horizontal lines) are labelledFig. 3Methylation site cg01730944 is located close to CDKN1C. (a) Density plot of the baseline methylation β values for cg01730944 in the early-stage DKD progression cohort (n=403), showing lower methylation in individuals whose DKD progressed during follow-up (eGFR decline <60 ml/min per 1.73 m^2^) compared with individuals whose DKD did not progress). (b) Kaplan–Meier plot comparing individuals in the lowest and highest tertiles for cg01730944 methylation, showing the proportion of individuals who progressed to eGFR <60 ml/min per 1.73 m^2^ during follow-up. (c) Open chromatin peaks in kidney cell types; human kidney single-nucleus transposase-accessible chromatin data (version 2) on 57,229 cells [30] accessed through the Susztaklab Kidney Biobank (https://susztaklab.com/). Adapted from https://susztaklab.com/Human_snATAC/, with the cg01730944 position incorporated. (d) Kidney single-cell expression data for 23,980 nuclei [44] showing that CDKN1C is mainly expressed in podocytes. Adapted from Kidney Interactive Transcriptomics online analysis platform (http://humphreyslab.com). (e) In vivo expression of CDKN1C in human glomerular cells [37] showing lower expression (fold change=−4.95, p=4.9 × 10^−5^) in diabetic kidney disease (group 2, n=9) compared to individuals without DKD (group 1, n=13). Adapted from the Nephroseq version 5 database (https://www.nephroseq.org/). CD–ICA/B, collecting duct – intercalated cells A/B; CD–PC, collecting duct – principal cell; DCT, distal convoluted tubule; DCT/CT, distal convoluted tubule/connecting tubule; Endo/ENDO, endothelia; IC, intercalated cells, Immune, immune cells; LEUK, leukocytes; LOH, loop of Henle; Lymph, lymphocytes; MES, mesenchyme; PC, principal cells of collecting duct; PCT, proximal convoluted tubule; PEC, parietal epithelial cell; Podo/PODO, podocytes; PT–S1 – PT–S3, proximal tubule segments 1–3
In the late-stage DKD progression subcohort, 372 individuals with severe albuminuria (38% women, mean age at baseline 43 years) were followed up for a median of 8.3 years (IQR 4.1–15.3). Individuals who developed ESKD (n=205, 55%) had lower baseline eGFR compared with those who did not progress to ESKD (43 vs 85 ml/min per 1.73 m^2^, Table 1).
The EWAS on late-stage DKD progression identified seven significant CpGs (p<9.4 × 10^−8^, Table 2), with cg17944885 between ZNF788P and ZNF625–ZNF20 (chr19p13.2) as the lead site (i.e. the site with the lowest p value; HR 2.21; 95% CI 1.84, 2.65). In the competing risk analysis (n=51 deaths), all seven methylation sites remained significantly associated with ESKD risk. Methylation sites associated with late-stage progression were associated with baseline eGFR (Table 2), which probably attenuated their association with ESKD risk in the eGFR-adjusted EWAS, which showed no significant associations (ESM Table 2 and ESM Fig. 4).
Two-timepoint analysis showed that methylation levels of the 11 DKD progression-associated CpGs were relatively stable over time; only at cg17944885 (chr19p13.2) did those who progressed from normal AER to severe albuminuria have a nominal increase in methylation, i.e. in the expected direction, when compared with those who did not progress (p=0.049, ESM Figs 5 and 6). No association between Δmethylation and eGFR slope was observed (ESM Table 3).
Multiple CpGs show replication
We studied several EWAS datasets to validate the 11 significant key findings. Notably, no cohort with a comparable early-stage DKD progression phenotype and EWAS data currently exists. Furthermore, the CpGs associated with early-stage progression were not associated with eGFR in the discovery data, implying that EWASs for eGFR are unsuitable for replicating these signals. Nevertheless, all four early-stage DKD progression-associated CpGs showed significant differential methylation in DKD compared to individuals without diabetes or kidney disease (p<4.5 × 10^−3^, ESM Table 4). Furthermore, cg25013571 (PLPBP/ADGRA2) was nominally associated with DKD in the UK-ROI type 1 diabetes cohort [7] (p=0.044, Fig. 4). Of note, only 25 CpGs overlapped between the suggestive sites from our eGFR-adjusted early-progression model (p<1 × 10^−4^, n=270) and the approximately 35,000 significant CpGs from the EWAS on incident CKD [22] (ESM Fig. 7).Fig. 4. Replication summary of the 11 CpGs associated with early-stage DKD progression (four first rows) or late-stage DKD progression (seven last rows). *p<0.05 (nominal replication); **p<4.5 × 10^−3^ (0.05/11; i.e. significant replication); *****significant finding in the corresponding study. Cell colours indicate effect direction, non-significant association and data availability: blue, lower methylation associated with higher risk of progression, lower eGFR or DKD; light red, higher methylation associated with higher risk of progression, lower eGFR or DKD; grey, association with p value >0.05; white, CpG is not available. Type 1 diabetes studies: DKD vs no DKD+no T1D, analysis of UK-ROI and NICOLA cohorts; DKD: UK-ROI, UK-ROI results in Smyth et al (2022) [7]; Progr. to ESKD, JKS no-covariates model and Progr. to ESKD, full model, full-covariates model results from Chen et al (2024) [20]; eGFR and eGFR slope in type 2 diabetes or diabetes (type unspecified) studies: Hong Kong Diabetes Register, Li et al (2023) [11] and Chronic Renal Insufficiency cohort, Sheng et al (2020) [10]; general population studies on eGFR, incident CKD and prevalent CKD: Chu et al (2017) [13], Schlosser et al (2021) [14] and Breeze et al (2021) [15]. Progr., progression
Six of seven late-stage DKD progression-associated CpGs were nominally (p<0.05) or significantly (p<4.5 × 10^−3^; Bonferroni correction) associated with eGFR in the validation datasets. Remarkably, higher methylation at cg17944885 (chr19p13.2) was associated with lower eGFR in five eGFR EWASs (p<1.4 × 10^−9^) [10, 11, 13–15], the DKD in the UK-ROI cohort (p=9.5 × 10^−16^) [7] and the risk of ESKD in the JKS cohort (p<6.2 × 10^−4^) [20]. Additionally, cg12272104 (DAZAP1) was robustly replicated. Notably, cg12272104 methylation was correlated with methylation values at eGFR-associated cg00994936 [13] at the same locus (FinnDiane: r=0.65, p<0.001). Furthermore, the novel cg21871803 (AHCYL2, ESM Fig. 8) associated significantly with eGFR slope (p=1.3 × 10^−4^) [11] and nominally with DKD progression to ESKD [20].
Association with clinical variables
Methylation sites associated with early-stage DKD progression correlated only modestly with clinical variables (ESM Fig. 9). All seven late-stage DKD progression-associated CpGs correlated with baseline eGFR (p<0.05), modestly with other clinical variables (ESM Fig. 10), and more strongly with one another (ESM Fig. 11).
Prediction models
When predicting early-stage DKD progression, baseline eGFR did not improve the clinical model (concordance index [C-index] 0.783 vs 0.775, p=0.49). Thus, baseline eGFR does not help distinguishing early-stage DKD progressors. The key CpG sites (i.e. all significant sites with p value below epigenome-wide significance) did not improve the model when included separately (ESM Fig. 12), but a model including all four sites outperformed the clinical model that included eGFR (C-index 0.859 vs 0.783, p=0.01; Fig. 5). More importantly, a significant increase in the positive predictive value (0.485 vs 0.210, p=3.9 × 10^−5^; ESM Table 5) suggests that the CpG-containing model better identifies individuals at risk of early-stage DKD progression.Fig. 5. Predictive performance of the lead CpGs. The diamonds show the C-indexes and 95% CI for three Cox proportional hazards models applied to the early-stage DKD progression cohort (n=393 without missing values on studied variables) and late-stage DKD progression cohort (n=362 without missing values on studied variables). The two-tailed p values indicate significant differences in the concordances between the compared models. The first model (clinical variables) used baseline triglyceride concentration, central obesity (WHR >0.5) and current smoking status for the early-stage DKD progression analysis, and baseline triglyceride concentration, HbA_1c_ and systolic BP for the late-stage DKD progression analysis. Additionally, these models included proportions for six white blood cell types, technical PCs 1–3, the mean methylation M value from invariable sites, age and sex. The second model also included baseline eGFR. Additional variables in the third model were the mean methylation M values for four early-stage DKD progression-associated methylation sites (cg25013571, cg05831784, cg06334496 and cg01730944) or seven late-stage DKD progression-associated methylation sites (cg03262246, cg21871803, cg14999724, cg10579797, cg04166335, cg12272104 and cg17944885)
As expected, adding baseline eGFR into the clinical model improved the Cox model for late-stage DKD progression (C-index 0.838 vs 0.691, p<0.001). The significant CpGs did not improve the model when included separately (ESM Fig. 13), but a model including them all outperformed the clinical model that included eGFR (C-index 0.849 vs 0.838, p=0.03). However, the positive predictive value did not improve (p=0.37). Fivefold cross-validation of the CpG-containing early- and late-stage progression models showed good model performance but moderate overfitting (ESM Table 6).
Six novel meQTLs
We studied the impact of genetic variation on methylation levels at 11 key sites in 756 FinnDiane participants. We identified nine independent meQTLs (false discovery rate <0.05; Table 3 and ESM Table 7). The cis-meQTL rs4804653 and trans-meQTL rs17611866 for cg17944885 (chr19p13.2) and the cis-meQTL rs555097 for cg14999724 (RP11-872D17.8; ESM Fig. 14) had been identified previously [19, 36], thus, six were novel. However, the novel cis-meQTL rs111929214 for cg03262246 (CDKN2AIPNL) correlated modestly with kidney tissue meQTL rs17167255 [10] in the 1000G European dataset (R^2^=0.40) and more strongly in the 1000G Finnish dataset (R^2^=0.60) (https://www.internationalgenome.org/, accessed through LDlink [https://ldlink.nih.gov/]). Table 3. Significant independent^a^ cis- and trans-meQTLs for the key CpGs identified in the 756 FinnDiane study participantsCpG sitemeQTLProbeChromosomeClosest genecis/transChromosomers numberDistance to CpGEA/OAβ (95% CI)pFDRAssociated kidney phenotype in GWAS^b^Kidney phenotype* p* value^c^CpG associated with early-stage DKD progression cg0583178420HAO1**cis20rs4815959−949,339A/G0.175 (0.079, 0.272)3.9 × 10^−4^0.04CKD^d^2.3 × 10^−2^trans6rs12198601NAG/T0.269 (0.182, 0.355)1.7 × 10^−9^1.9 × 10^−3^Late DKD in type 2 diabetes [63]1.6 × 10^−3^trans8rs111233810NAA/AG0.377 (0.248, 0.506)1.6 × 10^−8^0.01Renal failure^e^ (FinnGen)8.6 × 10^−3^CpGs associated with late-stage DKD progression cg032622465CDKN2AIPNL**cis5rs1119292144984G/A0.095 (0.047, 0.142)9.4 × 10^−5^0.02eGFR_cr_^f^5.5 × 10^−3^ cg1499972411RP11-872D17.8 (PRG2 transcript variant)cis11rs555097−872A/C0.100 (0.060, 0.140)1.4 × 10^−6^5.4 × 10^−4^eGFR_cr/cys_ [64]7.2 × 10^−4^ cg1794488519ZNF788P and* ZNF625-ZNF20cis19rs48046534240A/T0.255 (0.162, 0.348)9.9 × 10^−8^2.7 × 10^−4^eGFR_cr_ in type 1 diabetes [63]3.5 × 10^−2^trans16rs17611866NAT/C0.460 (0.376, 0.543)3.8 × 10^−25^5.3 × 10^−18^Cystatin C [65]1.2 × 10^−3^ cg1227210419DAZAP1cis*19rs34622118530,159C/CA0.112 (0.055, 0.170)1.5 × 10^− 4^0.03Serum urate [65]6.2 × 10^−7^cis19rs2283578−713,116A/C0.105 (0.049, 0.161)2.5 × 10^−4^0.03Late DKD in type 2 diabetes [63]2.3 × 10^−2^^a^Independent SNVs (r^2^<0.01 with other SNVs) in 1000 genomes Finnish population data (SNPclip tool used at https://ldlink.nih.gov/). cis: <±1 Mb distance between the CpG probe and the meQTL variant^b^Summary statistics for GWAS related to diabetes and complications were obtained from the Type 1 Diabetes Knowledge Portal (https://t1d.hugeamp.org/) and the Finnish Biobank data (FinnGen) data freeze 10 (http://r10.finngen.fi/) [47]. The most significant kidney-related phenotype association per meQTL variant is reported. ESM Table 7 shows all associations for which the p value is <0.05^c^Significant associations have a p value <1.56 × 10^−3^ (0.05/9; Bonferroni-corrected for the number of meQTL variants)^d^Meta-analysis of nine datasets in the Type 1 Diabetes Knowledge Portal^e^FinnGen data^f^Meta-analysis of 22 datasets in the Type Diabetes Knowledge PortalEA, effect allele; eGFR_cr_, eGFR based on serum creatinine; eGFR_cr/cys_, eGFR based on serum creatinine or cystatin C; FDR, false discovery rate; OA, other allele; SNV, single-nucleotide variant
The trans-meQTL rs17611866, a missense variant p.Val325Ala in ZNF75A, associates (in trans) with methylation at cg17944885 [18–20, 36] and expression of genes at chr19p13.2 ([46] and GTEx Portal). Interestingly, three other CpGs regulated by rs17611866 [18] showed significant association (cg17944885, chr19p13.2) or suggestive association (p<1 × 10^−4^; cg18470038 [chr12] and cg06158227 [chr15]) with late-stage DKD progression in our EWAS (Fig. 6). Furthermore, cg06158227 (chr15) was previously identified in an eGFR EWAS [13].Fig. 6. Links between methylation and gene expression of a trans-meQTL locus on chromosome 16. According to Huan et al [18], the single-nucleotide variant (SNV) rs17611866 correlates (in trans) with methylation levels of 45 CpGs, of which the eGFR-associated methylation sites cg17944885 (chr19p13.2 locus, in multiple EWASs) and cg06158227 [13] are shown. Methylation site cg17944885 is located near SNV rs4804653 (cis-meQTL) that is associated with its methylation levels in the Genetics of DNA Methylation Consortium data (http://mqtldb.godmc.org.uk/). We replicated both the cis- and trans-meQTLs in our diabetes cohort. A cis-eQTL is an SNV that affects gene expression; cis-meQTL and trans-meQTL are SNVs that associates with CpG site methylation; a cis-eQTM is a methylation site that associates with gene expression. Created in BioRender. Syreeni, A. (2025) https://BioRender.com/
To investigate the meQTL variants, we studied their associations with diabetes and complication-related traits in the Finnish biobank (FinnGen) [47] and the Type 1 Diabetes Knowledge Portal (https://t1d.hugeamp.org/). Association with eGFR was studied in a multiethnic genome-wide association (GWAS) study [48]. The trans-meQTL rs17611866 in ZNF75A showed no significant associations, but rs1447267563 near ZNF75A was the lead variant for ‘cystic kidney disease’. Furthermore, rs555097 (a cis-meQTL for cg14999724/RP11-872D17.8) was associated with eGFR (p=7.2 × 10^−4^), rs12198601 (a novel cis-meQTL for cg05831784/HAO1) was associated with DKD in type 2 diabetes (p=1.6 × 10^−4^), and rs34622118 (a novel cis-meQTL for cg12272104/DAZAP1) was associated with ‘macroalbuminuria in diabetes’ (p=2.1 × 10^−3^) and with ESKD in the ‘ESKD vs macroalbuminuria’ analysis (p=3.7 × 10^−3^), supporting its potential role in late progression (ESM Table 8). Taken together, these associations suggest a role for key methylation sites in kidney disease.
Gene and protein expression evidence
To identify potential target genes for the significant CpGs, we investigated methylation and gene expression. In blood cells, cg17944885 was a significant cis-eQTM for many zinc finger genes. Notably, when examining data on other tissues including kidneys, six of the 11 CpGs were significant eQTMs for the closest gene (Table 4 and ESM Table 9). Table 4. Significant cis-eQTM loci in look-up analysis of the lead methylation sites for DKD progression in blood cell and kidney tissue datasetsCpG sitecis-eQTM look-ups (genes within 1 Mb of CpG)Methylation probeMethylation risk for DKD progressionGeneGeneTissueTissueStudy-specific effect sizeStudy-specific effect sizepDatasetDatasetReferenceCpGs associated with early-stage DKD progression cg01730944LowerCDKN1CKidneyr=−0.2088.6 × 10^−8^TCGAEWAS Toolkit [51]CpGs associated with late-stage DKD progression cg03262246LowerC5orf15Kidneyβ=0.0772.0 × 10^−3^SusztaklabLiu et al [30] cg21871803LowerAHCYL2Kidneyr=−0.2611.4 × 10^−11^TCGAEWAS Toolkit [51] cg04166335LowerNPIPB13Kidneyβ=−0.1843.6 × 10^−5^SusztaklabLiu et al [30] cg12272104LowerDAZAP1Kidneyr=0.2191.6 × 10^−8^TCGAEWAS Toolkit [51]EFNA2Kidneyβ=−0.2093.7 × 10^−4^SusztaklabLiu et al [30] cg17944885HigherZNF788PKidneyr=0.1813.4 × 10^−6^TCGAEWAS Toolkit [51]Monocyteslog_2_FC=−0.0452.5 × 10^−8^MESAKennedy et al [33]Whole bloodlog_2_FC=−0.0815.9 × 10^−8^HELIXRuiz-Arenas et al [35]ZNF69Monocytesβ=−0.0266.0 × 10^−6^MESAKennedy et al [33]Whole bloodβ<0^a^1.9 × 10^−5^Dutch BiobanksBonder et al [34]ZNF439Monocytesβ=−0.0431.8 × 10^−7^MESAKennedy et al [33]Whole bloodlog_2_FC=−0.1201.1 × 10^−7^HELIXRuiz-Arenas et al [35]ZNF844Whole bloodβ<0^a^3.6 × 10^−26^Dutch BiobanksBonder et al [34]Whole bloodlog_2_FC=−0.2753.2 × 10^−16^HELIXRuiz-Arenas et al [35]ZNF763Whole bloodlog_2_FC=−0.1603.2 × 10^−9^HELIXRuiz-Arenas et al [35]ZNF44Whole bloodβ<0^a^2.5 × 10^−9^Dutch BiobanksBonder et al [34]ZNF136Whole bloodβ<0^a^5.9 × 10^−5^Dutch BiobanksBonder et al [34]ZNF433-AS1Whole bloodβ<0^a^3.8 × 10^−6^Dutch BiobanksBonder et al [34]Look-up eQTM datasets: TCGA, Cancer Genome Atlas datasets as represented in the EWAS Toolkit at https://ngdc.cncb.ac.cn/ewas/toolkit [51]; Susztaklab, kidney expression data from Liu et al accessed through the Susztaklab Kidney Biobank at https://susztaklab.com/; MESA, the Multi-Ethnic Study of Atherosclerosis; HELIX, Human Early-Life Exposome study comprising six population-based birth cohorts; Dutch Biobanks, meta-analysis of four Dutch Biobank studies^a^Effect size direction in the Dutch Biobank meta-analysis; the effect sizes separately for the four cohorts are reported in ESM Table 9; meta-analysis effect estimates are not availableFC, fold change
Our OLINK proteomic data for individuals with normal AER (no DKD, n=188) showed that cg14999724 methylation was associated with serum levels of proteoglycan 3, a product of the PRG3 gene (i.e. a cis-pQTM: β=−0.18, SE=0.04, p=1.7 × 10^−5^, ESM Fig. 15 and ESM Table 10). Interestingly, PRG3 is overexpressed in kidney collecting duct cells in people with diabetes (ESM Fig. 16). Furthermore, among individuals with severe albuminuria (n=127), cg14999724 methylation was associated with PRG2 and PRG3 (proteoglycans 2 and 3), and cg12272104 (DAZAP1) was associated with BSG (basigin), FSTL3 (follistatin-like 3), MIDN (midnolin) and PALM (paralemmin), which are the protein products of the genes located in cis. Importantly, these proteins show strong associations with incident kidney endpoints in the UKBB data (e.g. BSG in ‘dialysis’: HR 24.5; 95% CI 18.0, 33.6; p=1.9 × 10^−89^; ESM Table 11).
Next, we examined whether the nearest eQTM and pQTM genes for the top CpGs show altered expression in kidney disease. Notably, for ten of the 11 top CpGs, a related gene was differentially expressed in CKD or DKD (p<1.7 × 10^−3^) or associated with eGFR in human kidneys. For example, CDKN1C (near cg01730944) is downregulated in DKD glomeruli (fold change −4.95; Fig. 3e). Additionally, expression of AHCYL2 (near cg21871803) in glomeruli and tubules correlate with kidney function (r=0.34). For cg17944885 (chr19p13.2), five zinc finger eQTM genes were nominally or significantly (ZNF136) upregulated in CKD tubules (ESM Table 12). Furthermore, 12 related genes were differentially expressed in advanced vs early DKD whole-kidney samples [41] (ESM Table 13), implying biological differences related to the baseline disease stage and justifying separate progression analyses such as ours.
Regulatory potential
The early-stage DKD progression-associated cg05831784 (HAO1), cg01730944 (CDKN1C, Fig. 3c) and cg06334496 (TMEM70) are located in open chromatin in kidney [31] (thus on active DNA). The late-stage progression-associated loci were outside open chromatin. Furthermore, the early-stage progression-associated CpGs overlapped with several TF motifs (ESM Table 14), such as cg01730944 (CDKN1C), which overlapped with EGR1 and KLF15. Taken together, these results suggest that the genomic regions around the early-stage progression-associated CpGs may have functional implications.
Relevant enriched traits
Genes linked to CpGs from DKD progression EWASs showed no enriched GO terms or KEGG pathways at a false discovery rate <0.05 (ESM Figs. 17 and 18). For traits, early-stage DKD progression-associated CpGs were enriched in the ‘exposure on glucocorticoids’ EWAS results [49] (OR=4.5, p=1.3 × 10^−4^). For late-stage progression, ‘estimated glomerular filtration rate’ and ‘kidney disease’ were among the enriched traits, demonstrating the consistency of our EWAS results with those of previous studies (ESM Fig. 19).
Discussion
We and others have reported cross-sectional associations between DNA methylation and DKD or eGFR, and have explored the potential of CpG methylation to predict ESKD [7, 20]. Further, a recent study derived a methylation risk score for predicting incident CKD in type 2 diabetes [22]. To our knowledge, we present the first EWAS on early-stage progression of DKD in type 1 diabetes and the largest study to date to investigate CpGs associated with late-stage progression of DKD to ESKD. We identified four novel loci for early-stage DKD progression, including the podocyte-specific CDKN1C locus*.* Understanding molecular mechanisms and identification of early markers is crucial as early intervention is more effective than late intervention in delaying severe kidney disease [50]. For late-stage DKD progression, we discovered seven loci with significant replication support, including two previously reported sites and five novel sites.
CDKN1C expression is high in podocytes [44], which are the key cells for glomerular filtration. Cancer Genome Atlas kidney expression data in EWAS Toolkit [51] suggest that lower methylation at cg01730944 (risk of DKD progression) may be linked to higher CDKN1C expression. However, human kidney datasets consistently showed lower CDKN1C expression in established DKD. Thus, how cg01730944 methylation affects CDKN1C expression remains uncertain. Nevertheless, proximity to the transcription start site and overlap with putative TF motifs, including EGR1 and KLF15, suggest that methylation at cg01730944 may regulate transcription. Notably, EGR1 was upregulated in podocytes in individuals with diabetic nephropathy and preserved eGFR [44], and it is upregulated in hyperglycaemia [52], exacerbates mesangial cell proliferation [52] and contributes to tubular fibrosis [53]. Furthermore, podocyte-specific KLF15 overexpression in proteinuric mice was concomitant with upregulation of Cdkn1c and improved kidney health [54]. Thus, previous research supports links between cg01730944 locus and kidney disease.
The late-stage DKD progression-associated cg17944885 (chr19p13.2) and cg12272104 (DAZAP1) are known eGFR-associated loci, first identified by Chu et al [13]. We identified five additional novel CpGs for ESKD risk in individuals with severe albuminuria. These sites were also associated with eGFR in our data, and CpGs at AHCYL2, TAOK2, CDKN2AIPNL and RP11-872D17.8 were also identified in eGFR EWASs [13–15].
The novel CpG cg14999724 (RP11-872D17.8) for ESKD risk was replicated in a prospective EWAS [20]. We additionally replicated the cis-meQTL rs555097 [19], and showed that a decrease in cg14999724 methylation (risk of ESKD) was associated with increases in serum PRG3 and PRG2 protein levels in our study. While some proteoglycans are components of the endothelial cell glycocalyx, a protective barrier that is often disrupted in diabetes-related microvascular complications [55], PRG3 and PRG2 show high expression in the bone marrow, and are overexpressed in kidney tubules in CKD [40], supporting their relevance.
The novel cis-meQTL rs2283578 for cg12272104 (DAZAP1; chr19p13.3) lies within the PALM gene but exhibits low linkage disequilibrium (0.05≤r^2^<0.2) with variants that affect PALM expression or protein levels [56]. However, PALM, BSG and FSTL3, which were associated with cg12272104 methylation in our study, are strongly associated with kidney outcomes in the UKBB [45]: BSG with kidney diseases [57, 58] and FSTL3 with CKD progression to ESKD [59]. Notably, the protein FSTL1 (an FSTL3 homologue) and PALM2 (a PALM homologue) have been suggested as potential therapeutic targets in DKD [60]. Thus, we hypothesise that methylation at cg12272104 (DAZAP1) regulates expression of multiple genes in the locus, but further studies are needed to elucidate the target genes at chr19p13.3 and their causality in DKD progression.
The lead cg17944885 (chr19p13.2) is a well-known methylation locus for kidney function. Interestingly, despite high heritability (h^2^=0.4) [18] and robust meQTLs, i.e. high genetic influence, our previous Mendelian randomisation analysis suggested that cg17944885 methylation does not appear to cause DKD [7]. Thus, a decline in kidney function may trigger systemic perturbations that, possibly in parallel to meQTL loci, lead to increased methylation at cg17944885, which further regulates gene expression in cis.
We and others have used multiomics data to address the complex molecular processes taking place in cg17944885 at chr19p13.2. Zinc finger proteins at chr19p13.2 help to suppress expression of endogenous retroviral sequences [61], which are transposable elements, elevated levels of which exacerbate kidney disease [62]. Methylation at cg17944885 appears to be dynamic: our two-timepoint data showed a nominal increase in methylation related to DKD progression. Further, blood-derived hypermethylation at cg17944885 reverted to normal after kidney transplantation [28]. However, cg17944885 methylation in combination with methylation at other sites and together with clinical factors and baseline eGFR improved the survival model for ESKD, as supported by previous research [20].
Overall, the late-stage progression signals were strongly correlated with eGFR, suggesting that these methylation differences may be partly secondary to reduced kidney function, as supported by Mendelian randomisation studies [7]. In contrast, the findings for early-stage progression appeared to be mostly independent of baseline eGFR, suggesting that they may precede and possibly contribute to disease progression. However, the limited number of meQTLs currently available hinders the ability of Mendelian randomisation studies to determine causality. Future analyses using robust meQTLs may help prioritise which genetic variants influence disease risk through methylation for development of better genetic risk scores.
Our prospective data are unique, representing the first EWAS on early-stage progression of DKD in type 1 diabetes, and the largest study on DKD progression to ESKD to date, but we recognise some limitations. Importantly, replication of the early-stage findings is challenging given the lack of EWAS data in comparable prospective studies, and the near-complete lack of overlap with CpGs associated with incident CKD in type 2 diabetes. Moreover, early-stage progression-associated CpGs were not associated with baseline eGFR in our data, complicating efforts to find supportive evidence, but increasing the relevance of such methylation signals as prognostic biomarkers. Nevertheless, we found supporting evidence from cross-sectional EWAS for DKD in type 1 diabetes. Second, individuals in the early-stage DKD progression cohort had normal AER and good to moderate kidney function despite long-standing diabetes. None experienced extremely rapid DKD progression, and the majority participated as control individuals without DKD in our cross-sectional EWAS [7]. Moreover, some individuals with stable eGFR may have developed albuminuria during follow-up, potentially diluting our associations based on eGFR decline. Notably, eGFR declines with age, which we addressed by adjusting for baseline age. Further, although the cross-validation supported our progression models, the initial CpG selection was based on the full discovery data, and therefore model evaluation in the test sets is not fully independent. Therefore, although the model incorporating the four identified CpGs performed significantly better in identifying early-stage DKD progressors, identification of additional methylation biomarkers and building of a robust prediction model are necessary.
To conclude, our two prospective EWASs identified novel methylation sites for DKD progression in type 1 diabetes, and highlighted cg17944885 as a lead methylation locus in kidney disease. Our findings support a role for the podocyte marker gene CDKN1C in early-stage progression of DKD, highlight proteins related to cg12272104 (DAZAP1) in late-stage DKD progression, and provide further evidence that use of DNA methylation markers could improve identification of individuals at high risk of DKD progression.
Supplementary Information
Below is the link to the electronic supplementary material.ESM (PDF 2677 KB)ESM Tables (XLSX 456 KB)
The reference list from the paper itself. Each links out to its DOI / PubMed record.