Panalyze: automated virus pangenome variation graph construction, analysis and annotation
Chandana Tennakoon, Thibaut Freville, Tim Downing

TL;DR
Panalyze is a scalable tool for building and analyzing virus pangenome variation graphs, enabling efficient genomic diversity studies.
Contribution
Panalyze introduces a scalable, automated pipeline for virus pangenome variation graph construction and analysis.
Findings
Panalyze efficiently constructs and analyzes virus pangenome variation graphs across diverse computing environments.
The tool supports both large-scale and single-laptop operations, making it accessible for various research settings.
Panalyze generates valuable outputs for studying viral genomic diversity and optimizing pangenome analysis.
Abstract
Constructing and studying pangenome variation graphs (PVGs) supports new insights into viral genomic diversity. This is because such pangenomes are less prone to reference bias, which affects mutation detection. Interpreting the information arising from this is challenging, so automating these processes to allow exploratory investigations for PVG optimisation is essential. Moreover, existing methods do not scale well to the smaller virus genome sizes and to facilitate analysis in laptop environments. To address this, we developed an easily deployable pipeline to facilitate the rapid creation of virus PVGs that applies a broad range of analyses to these PVGs. We present Panalyze, a computationally scalable virus PVG construction, analysis and annotation tool implemented in NextFlow and containerised in Docker. Panalyze uses NextFlow to efficiently complete tasks across multiple compute…
Genes, proteins, chemicals, diseases, species, mutations and cell lines named across the full text — each resolved to its canonical identifier and authoritative record.
Click any figure to enlarge with its caption.
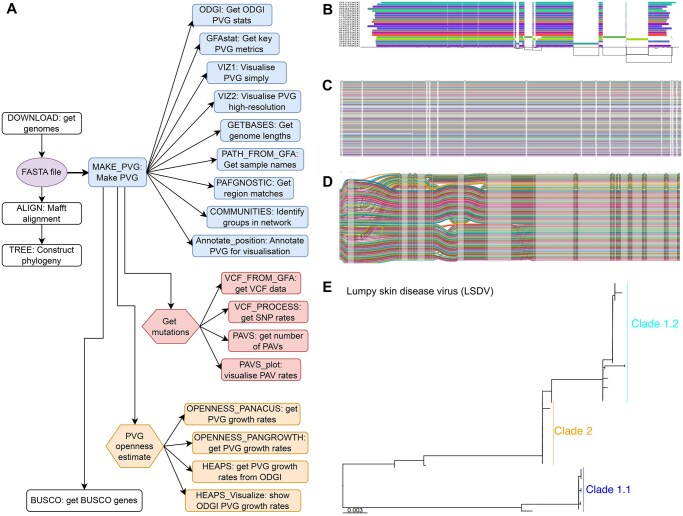 Figure 1
| Virus | Region | Samples | Scaffold (bp) | Length (bp) | Nodes | Edges | Openness |
|---|---|---|---|---|---|---|---|
| FMDV A | Genome | 142 | 8028 | 15 793 | 13 102 | 21 235 | 0.81 |
| FMDV C | Genome | 18 | 8148 | 10 779 | 5959 | 8359 | 1.14 |
| FMDV O | Genome | 441 | 8178 | 16 879 | 14 064 | 22 993 | 0.99 |
| GTPV | Genome | 6 | 150 350 | 163 590 | 7523 | 10 235 | 1.92 |
| LSDV | Genome | 121 | 150 524 | 156 966 | 7203 | 9827 | 1.88 |
| LSDV 5’ end | 7.5 Kb | 132 | 7500 | 8954 | 790 | 1037 | 1.80 |
| LSDV 3’ end | 5 Kb | 132 | 5001 | 7198 | 443 | 572 | 1.64 |
| MPOX | Genome | 2358 | 197 051 | 280 783 | 32 387 | 46 230 | 0.60 |
| PRCV | Genome | 15 | 27 660 | 32 086 | 7559 | 10 233 | 1.13 |
| RVFV | S segment | 414 | 1690 | 2739 | 1738 | 2495 | 0.97 |
| RVFV | M segment | 302 | 3885 | 6182 | 3639 | 5091 | 0.93 |
| RVFV | L segment | 306 | 6399 | 9092 | 5528 | 7677 | 0.99 |
| SPPV | Genome | 31 | 149 834 | 151 742 | 3136 | 4354 | 1.04 |
| FMDV A | Genome | 142 | 8028 | 15 793 | 13 102 | 21 235 | 0.81 |
| FMDV C | Genome | 18 | 8148 | 10 779 | 5959 | 8359 | 1.14 |
| FMDV O | Genome | 441 | 8178 | 16 879 | 14 064 | 22 993 | 0.99 |
- —UK Research and Innovation (UKRI) Biotechnology and Biological Sciences Research Council
Peer Reviews
No public reviews on file for this paper yet. If you reviewed it on a platform where reviews are public (OpenReview, ICLR, NeurIPS, ICML), you can paste yours below so the community can read it here.
Videos
No videos yet. Explain this paper in a talk, walkthrough, or lecture? Add one.
Taxonomy
TopicsGenomics and Phylogenetic Studies · Bacteriophages and microbial interactions · Evolution and Genetic Dynamics
1 Introduction
Pangenome variation graphs (PVGs) offer new insights into genome evolution over short and long scales. A PVG is a sequence graph whose nodes represent sequences and whose edges represent connections observed in data (Hein 1989) such that a genome can be decoded by traversing a series of paths (Garrison et al. 2018). PVGs combat reference allele bias by allowing reads to map to the most similar combination of paths in a PVG, instead of a single haplotype (Paten et al. 2018). Reference bias is not obviated by using a consensus reference sequence or by using a multi-sample reference (Chen et al. 2021, Chen et al. 2024). This affects the chance of a read mapping to a location, impacting mutation detection, phylogenetic analyses, and associated inferences in pathogens (Valiente-Mullor et al. 2021) particularly at variable regions that are often strongly associated with phenotypic changes (Haga et al. 2024). This results in unaligned reads, missed mutations, poorer inferences, and less precise evolutionary models (Baaijens et al. 2017, Hickey et al. 2020). Novel pathogen isolates genetically distinct from known references will be characterised less accurately (Boehm et al. 2021). In viruses, although genome assembly can be effective, extreme AT/GC content, host/vector contamination, short output contig lengths, and repetitiveness all contribute to incomplete and biased genomes (Alser et al. 2021, Lischer and Shimizu 2017). Moreover, contigs often need to be aligned to existing databases either as sequences or k-mers, or an existing unavoidably-biased scaffold may be used as a reference (Ondov et al. 2016, Bradley et al. 2019).
Only two studies have been published on viral PVGs. PVGs helped recover >8% of sequence that failed to align to known linear reference genomes (Duchen et al. 2024), and identify 27% more SNPs (Wright et al. 2025). A PVG can efficiently represent the diversity of multiple viral strains and so act as a better reference structure than a single linear reference (Downing 2026). This means reads can map to different parts of the haplotypes represented in the PVG, which reduces the effect of known mutations and improves mutation discovery (Paten et al. 2017, Rakocevic et al. 2019). This circumvents the issue of reference genetic distance, improves alignment quality, and may permit more accurate genetic reconstruction of the sample collection (Moshiri et al. 2022, Guarracino et al. 2023). Thus, there is a need for PVG creation and analysis to explore parameter spaces and optimise processes for viral PVGs.
There are many tools available for PVG creation and analysis. Most of these are developed with eukaryotic genome sizes in mind. These may require minimum sequence lengths larger than a typical virus genome length. There is a class of k-mer based reference-free methods that are fast when analyzing large genomes. However, with smaller sizes of virus genomes, we can efficiently use graph-based methods that provide richer structural representation. Moreover, many of these tools are hard to install due to complex installation procedures, assume numerous dependencies, and have steps requiring root access. Thus, it would be beneficial to have a curated set of pre-installed tools that can be easily deployed to automate PVG construction, analysis and annotation for small genome sizes. An existing tool, nf-core/pangenome (Heumos et al. 2024) achieves this for larger eukaryotic genome sizes, but does not work for genomes <5 Kb long, has limited analysis options, and requires a minimum number of computer server threads. Moreover, the smaller genome sizes of viruses means that their PVG analysis is possible on a laptop. Pandora is another alternative for bacterial pangenome graph construction and read mapping that does work on viral data, but lacks capacity to analyse PVGs (Colquhoun et al. 2021). Panalyze uses PGGB because of its versatility in downstream analyses, ability to produce variation graphs agnostic to genome type, and lack of licensing restrictions.
To address these issues, we present a scalable and rapid virus PVG construction, analysis and annotation tool operating in NextFlow v24.10.3 (Di Tommaso et al. 2017) and containerised in Docker (Merkel 2014) called Panalyze. It wraps a series of tools to allow for automated sequence retrieval, PVG creation, phylogenetic analysis, PVG visualisation using multiple methods, total PVG size calculation, PVG feature summarisation using different tools, PVG openness analysis, PVG core size estimation, VCF generation, BUSCO gene detection, PVG community detection and PVG annotation. Panalyze focuses on constructing PVGs for smaller (viral) genomes and on supporting the interpretation and analysis of PVGs. Panalyze can use cluster nodes efficiently in a scalable manner, or can be run on a single thread on a laptop or using many threads on a computer server. It also resolves the issue of complex installations and dependencies using Docker. We illustrate how Panalyze can work effectively for segmented, DNA and RNA viruses.
2 Methods
2.1 Pipeline overview
Panalyze integrates selected tools based on their reliability, effectiveness, and compatibility with downstream analysis; several alternatives were excluded due to poor maintenance or limited functionality. Panalyze has two entry points: a pre-existing FASTA file, or a search query from the user (Fig. 1A). The latter seeks all complete genomes or genomic sequences matching the query in the Nucleotide database (Sayers et al. 2021). The sample names are formatted to adhere to the PanSN-spec system (https://github.com/pangenome/PanSN-spec). The sequences are aligned with Mafft v7.453 (Katoh and Standley 2014) using automatic optimisation and default parameters. Evolutionary relationships are reconstructed using RAxML-NG (Randomised Axelerated Maximum Likelihood) v1.2.0 (Kozlov et al. 2019) with a GTR (general time reversible) model and gamma substitution rate heterogeneity. Other models can be selected with modeltest-ng (Darriba et al. 2020). Phylogenies are mid-pointed rooted and visualised using R v4.3.2 (R Core Team 2025) packages ape v5.7–1 (Paradis and Schliep 2019), ggtree v3.8.2 (Yu et al. 2017), phangorn v2.11.1 (Schliep 2011), Rcpp v1.0.11 (Eddelbuettel and Balamuta 2018), RcppArmadillo v0.12.6.6.0 (Eddelbuettel and Sanderson 2014), phytools v2.0–3 (Revll 2024), and treeio v1.24.3 (Wang et al. 2020).
Panalyze’s workflow and outputs. (A) Optional modules are coloured white, PVG analysis ones are in blue, mutation analysis ones are red, and openness modules are in orange. Users can either retrieve sequences of interest via the DOWNLOAD process, or curate a sample set and start the pipeline at ‘FASTA file’ (purple oval). MAKE_PVG (blue) will take the FASTA to make the PVG, before running analyses (blue), including: getting PVG metrics with the ODGI and GFAstat processes, visualisations with VIZ1 and VIZ2, genome lengths with GETBASES, creating PAFs with PAFGNOSTIC, community detection with COMMUNITIES and annotation. Other processes are on mutation detection (red): determining VCFs with VCF_FROM_GFA, VCF_PROCESS to infer mutation rates, getting PAVS with PAVS, and visualising the PAVs with PAVS_plot. Users can implement openness analyses (orange) using Panacus, Pangrowth and ODGI, HEAPS and HEAPS_Vizualize. Users can (optionally) identify Busco genes with BUSCO. (B) A region at 135–140 Kb from a 121-sample LSDV PVG visualised using ODGI viz, where each genome shown is a coloured bar and the PVG topology is shown as the genomic coordinates the x-axis (black lines). (C) 136–138 Kb of the same PVG visualised with VG viz. (D) A zoom-in from the same region using SequenceTubeMap (Beyer et al. 2019), showing one minor (22 samples from LSDV Clade 1) and one major (99 samples from LSDV Clades 1.2 and 2) haplotype. (E) A phylogeny of this region showing the LSDV clades and their differentiation between these two LSDV haplotypes.
Panalyze creates PVGs using the pangenome graph builder (PGGB) v0.4.0 pipeline (Garrison et al. 2024), which initiates all-to-all alignment with WFMASH v0.9.1 (Guarracino et al. 2021) subject to a threshold of 90% identity per Kb (Fig. 1B). If this fails to generate a valid PVG due to high similarity among the genomes, this is re-attempted with the identify threshold set to 50% and a k-mer mapping size altered to 11. PGGB keeps all paths and was used to reconstruct the input haplotypes directly. PGGB creates the PVG using SEQWISH v0.7.5–5 (Garrison and Guarracino 2023) using a k-mer of 19 bp and a window size of 27 bp, and then sorts and orders it to produce a progressively linearised PVG based on partial order alignment with SMOOTHXG v0.6.4. This also removes erroneous redundant nodes (Garrison and Guarracino 2023).
To allow analysis of a region <1.5 Kb in size, we pad the sequences with nucleotides to a minimum length of 1.5 Kb. Once a PVG is built, we break the PVG into single-nucleotide nodes, retaining the original topology. Then we remove the nodes belonging to the padded sequences. Finally, we collapse this pruned PVG so that consecutive unitigs (where present) are collapsed into contigs. When the mash algorithm is called with such a genome, the padding is entirely composed of N bases, which are ignored when detecting k-mers. The outputs of these programs are post-processed to reflect the original sequence.
Multiqc v1.14 (Ewels et al. 2016) collates PGGB metrics. The PVGs are generated in Graphical Fragment Assembly (GFA) format version 1. Panalyze does not use PVG pruning, chunking or lacing because virus PVGs are small. These PVGs are converted with the convert function in variation graph (VG) v1.43.0 (Garrison et al. 2018), indexed with VG’s autoindex function. The corresponding FASTA file is indexed with SAMtools (Li et al. 2009).
Next, a range of PVG analyses are applied. GFASTATS v1.3.6 (Formenti et al. 2022), Bandage (Wick et al. 2015), and ODGI (optimized dynamic genome/graph implementation) v0.8.3 (Guarracino et al. 2022) produce PVG summary statistics. Visualisations are created with ODGI (Fig. 1) and PGGB (Garrison et al. 2023). The number of bases in the PVG comes from ODGI. A VCF is produced by GFAUTIL v0.3.2 (Fischer 2021). The relative differences between the sequences’ coordinate systems is computed by GFAUTIL and visualised with ggplot2 v2_3.4.4 (Wickham 2016). PVG openness is computed firstly by Panacus v0.2.3 (Parmigiani et al. 2024a) using the nodes in the PVG with default coverage thresholds that included all segments, secondly with k-mers using Pangrowth (Parmigiani et al. 2024b), which also estimates the shared PVG size, and thirdly with sequences extracted from PVG nodes using ODGI’s heaps function using 1000 simulations. Three methods are used to ensure consistency of openness esti-mates. Pangrowth and Panacus provide faster sequence-based and k-mer-based estimates, while ODGI heaps offers unique insights by modelling openness as a function of sample size, enabling de-tection of inconsistencies and identifying the shared core PVG.
These PVG community data are parsed, visualised, and the pairwise alignment format (PAF) files are generated for input to PAFGNOSTIC to numerically summarise PVG properties. A tabular PVG annotation file is generated using Prokka (Seemann 2014) for visualisation with Bandage (Wick et al. 2015). Presence-absence variation (PAV) can be determined by ODGI and visualised, but should only be used for smaller or less diverse datasets due to the compute time required. Optional analyses include determining gene presence-absence via BUSCO (Manni et al. 2021).
2.2 Testing the workflow
To illustrate that Panalyze’s PVG analysis approach is broadly applicable to all virus genomes, a range of test datasets were analysed (Table 1). We used a computer cluster with Ubuntu v24.0 running on SLURM with 12 threads allocated per job, where each node had a Dual AMD EPYC 7763, 64 cores with 2 threads per core, 2.45 GHz processor and 2 GB memory. Firstly, we applied it to a set of 121 lumpy skin disease virus (LSDV) genomes, repre-senting large DNA viruses (taking 114 CPU hours, 78 minutes to complete). Secondly, we evaluated Panalyze’s performance on 15 porcine respiratory coronavirus (PRCV) genomes, representing small ssRNA viruses (6.7 CPU hours, 6.8 minutes). We repeated this on (ssRNA) 18 FMDV serotype C genomes (2.0 CPU hours, 2.6 minutes), and 441 FMDV serotype O genomes (353 CPU hours, 518 minutes). Thirdly, we evaluated its effectiveness in interpreting a segmented ssRNA virus, Rift Valley fever virus (RVFV), whose genome has three segments (S in 15 CPU hours/7.1 minutes, M in 18 CPU hours/10.3 minutes, L in 593 CPU hours, 553 minutes). Fourthly, we demonstrate the scalability of Panalyze by applying it to 2358 mpox genomes (23 CPU hours, 249 minutes).
The Scaffold refers to the average scaffold size, which was from GFAstats such that the total length refers to the sum of the sequence lengths of the nodes in the PVG from ODGI. FMDV A stands for FMDV serotype A. FMDV C stands for FMDV serotype C. FMDV O stands for FMDV serotype O. Openness was estimated using the alpha values from Panacus.
We repeated the analyses of the same sets of viral genomes using the nf-core/pangenome pipeline (Heumos et al. 2024) for comparison with Panalyze using the same sets of viral genomes, though the nf-core/pangenome pipeline required at least 12 threads. Metrics are extracted for the pruned PVGs to ensure con-sistency of comparisons.
Panalyze and the nf-core/pangenome pipeline provided idential results and the nf-core/pangenome pipe-line was faster overall. However, the RVFV segments S and M were too small to be assessed by nf-core/pangenome. In addition, Panalyze performs a wide range of PVG analysis and visualisa-tions absent in nf-core/pangenome.
To run Panalyze on laptop environments, we created two in-stances of virtual machines on a linux laptop having 64 GB RAM, and 32 cores. The high-resource instance had four cores with 8 GB RAM and the low-resource one had a single core with 4 GB RAM. We used a test dataset of 800 bp from the RVFV S segment for eight genomes running on a single thread. We were also able to run our pipeline on a windows virtual machine with eight cores and 8 GB of RAM.
3 Results
We created PVGs for large DNA (LSDV, mpox, GTPV, SPPV), small ssRNA (PRCV, FMDV) and segmented RNA (RVFV) viruses using Panalyze to illustrate its broad applicability to different virus types, as well as levels of diversity, sequence sizes and sample sizes (Table 1). The varied relative rate of nodes and edges compared to the sample sizes and average genome lengths illustrate how different the levels of sequence variability were. To illustrate the unusual patterns of variation in certain viral genomes, we extracted a portion of the LSDV PVG at which there are 15 mutations spanning 2 genes (Fig. 1E). Phylogenetic reconstruction shows divergent haplotypes: selecting a single representative reference sequence for this region would bias downstream analyses.
We modelled the rate of discovery of new mutations as a function of the number of samples added to the PVGs, estimated with Panacus calculation of alpha. We observed that RVFV’s segments had a slightly open PVG based on the alpha values from Panacus, whereas PRCV and the FMDV serotypes had slightly closed ones, which contrasted with the closed LSDV PVG and the open mpox PVG (Table 1). Similar values were observed with Panacus. Our estimate of gamma for LSDV’s PVG (Panacus 0.04) was comparable to a previous estimate of 0.05 derived from a gene-based pangenome (Xie et al. 2024).
4 Discussion
We present Panalyze: a portable pipeline for virus PVG construction, analysis and annotation written in domain-specific language (DSL) 2. It runs in NextFlow (Di Tommaso et al. 2017) using Docker (Merkel 2014) containers, and allows Nextflow’s process management to improve thread allocation and accelerate task completion. The selection of tools to run can be specified using a configuration file. This automation facilitates deeper engagement with complex datasets and it can analyse genomic regions of any size. It can run on any number of threads (from one to many), allowing it to be run locally on a laptop as well as on an HPC server. Panalyze can be applied to diverse viruses: large DNA, small ssRNA, and segmented ones.
Although there are emerging tools for PVG construction, analysis and annotation for smaller genomes, no tool has yet bridged these nor automated them in Nextflow. Panalyze addresses this in a user-oriented reproducible manner. We hope that Panalyze can help the virus research community progress from using linear reference genomes to more accurate PVGs generated from more representative datasets. Moreover, we expect that superior PVG methods will underpin better novel or recombinant sample characterisation as well as routine PVG analysis and mutation detection. Consequently, Panalyze supports virus evolutionary and epidemiological genomics.
Supplementary Material
vbag071_Supplementary_Data
The reference list from the paper itself. Each links out to its DOI / PubMed record.
- 1Alser M , Rotman J, Deshpande D et al Technology dictates algorithms: recent developments in read alignment. Genome Biol 2021;22:249. 10.1186/s 13059-021-02443-734446078 PMC 8390189 · doi ↗ · pubmed ↗
- 2Baaijens JA , Aabidine AZE, Rivals E et al De novo assembly of viral quasispecies using overlap graphs. Genome Res 2017;27:835–48. 10.1101/gr.215038.11628396522 PMC 5411778 · doi ↗ · pubmed ↗
- 3Beyer W , Novak AM, Hickey G et al Sequence tube maps: making graph genomes intuitive to commuters. Bioinformatics 2019;35:5318–20. 10.1093/bioinformatics/btz 59731368484 PMC 6954646 · doi ↗ · pubmed ↗
- 4Boehm E , Kronig I, Neher RA, et al Novel SARS-Co V-2 variants: the pandemics within the pandemic. Clin Microbiol Infect 2021;27:1109–17. 10.1016/j.cmi.2021.05.02234015535 PMC 8127517 · doi ↗ · pubmed ↗
- 5Bradley P , den Bakker HC, Rocha EPC et al Ultrafast search of all deposited bacterial and viral genomic data. Nat Biotechnol 2019;37:152–9. 10.1038/s 41587-018-0010-130718882 PMC 6420049 · doi ↗ · pubmed ↗
- 6Chen NC , Paulin LF, Sedlazeck FJ et al Improved sequence mapping using a complete reference genome and lift-over. Nat Methods 2024;21:41–9. 10.1038/s 41592-023-02069-638036856 PMC 11610747 · doi ↗ · pubmed ↗
- 7Chen NC , Solomon B, Mun T et al Reference flow: reducing reference bias using multiple population genomes. Genome Biol 2021;22:8. 10.1186/s 13059-020-02229-333397413 PMC 7780692 · doi ↗ · pubmed ↗
- 8Colquhoun RM , Hall MB, Lima L et al Pandora: nucleotide-resolution bacterial pan-genomics with reference graphs. Genome Biol 2021;22:267. 10.1186/s 13059-021-02473-134521456 PMC 8442373 · doi ↗ · pubmed ↗