Mind the “CRP gender gap”! sex differences in CRP evolution over time in neonatal sepsis: a monocentric retrospective cohort study
Andrea Nebbioso, Isaline Eggermont, Alfredo Vicinanza, Phu-Quoc Lê, Nancy Vitali, Gwenaëlle Augé, Nicolas Lefèvre

TL;DR
The study finds that female neonates show a faster initial rise in CRP levels compared to males, but no differences in peak or decline rates, suggesting sex influences immune response patterns in early life.
Contribution
This is the first study to analyze sex differences in CRP kinetics during neonatal sepsis using a piecewise regression model.
Findings
Female neonates had a faster CRP rise in the first 12 hours of life compared to males.
After 12 hours, female neonates showed a slower increase in CRP levels.
No significant sex differences were observed in CRP peak levels or decline rates.
Abstract
C-reactive protein (CRP) is a readily available test widely used to assess neonatal sepsis (NS). In children with sepsis or other infectious conditions, CRP is more likely to be higher in females than males, however, evidence is lacking on sex differences in CRP in the neonatal population. This study aims to describe sex differences of CRP evolution in the ascending and decreasing phase after its peak in neonates with likely NS. This is a monocentric retrospective cohort study conducted at Etterbeek-Ixelles Hospital in Brussels. We included all neonates born in the facility between January 2017 and December 2022 who received antibiotics in the first 72 hours of life. Patients whose CRP concentrations remained under 10 mg/L were excluded. To describe the ascending kinetics of CRP and its logarithm for male and female neonates, we fitted a piecewise linear mixed-effects regression model…
Genes, proteins, chemicals, diseases, species, mutations and cell lines named across the full text — each resolved to its canonical identifier and authoritative record.
Click any figure to enlarge with its caption.
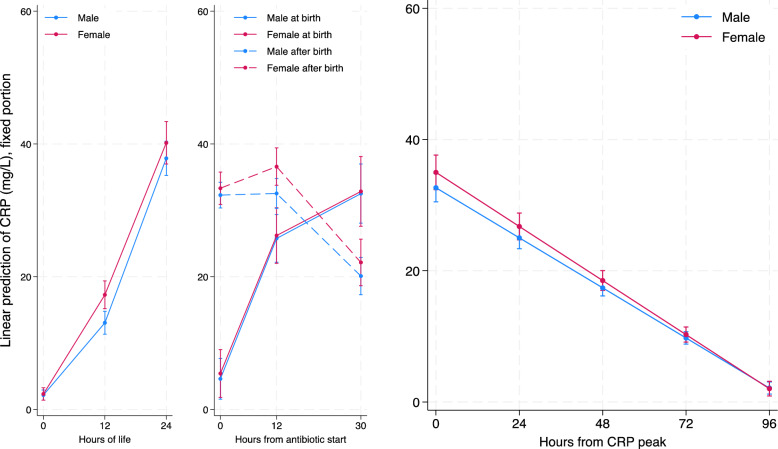 Figure 1
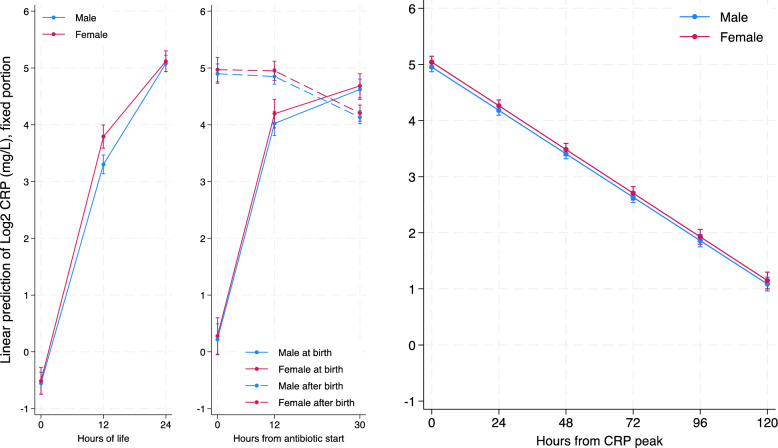 Figure 2
Peer Reviews
No public reviews on file for this paper yet. If you reviewed it on a platform where reviews are public (OpenReview, ICLR, NeurIPS, ICML), you can paste yours below so the community can read it here.
Videos
No videos yet. Explain this paper in a talk, walkthrough, or lecture? Add one.
Taxonomy
TopicsNeonatal and Maternal Infections · Sepsis Diagnosis and Treatment · Immune Response and Inflammation
Introduction
Neonatal sepsis (NS) has been defined as a systemic condition of infectious origin, resulting in substantial morbidity and mortality in neonates [1]. Most authors consider the first 72 hours of life the cut-off between early and late-onset NS, while others refer to late-onset NS (LONS) as occurring after seven days of life [1]. C-reactive protein (CRP) is the most widely used and readily available laboratory test to assess NS [2]. Two CRP values <10 mg/L obtained 24 hours apart have very high specificity and, therefore, strong power in excluding early-onset NS (EONS) [3]; however, once the clinician faces the opposite situation (one CRP measurement >10 mg/L), CRP cut-offs multiply and sensitivity drops below 70% [4]. Previous studies demonstrated that CRP values in healthy neonates are log-normally distributed and physiologically rise in the first 24 hours of life starting from a very low level at birth [5] as CRP does not pass through placenta [6]. No sex differences in neonatal CRP levels have been found in a healthy neonatal population [5]. Many studies focused on the specificity and sensibility of CRP at specific times for the diagnosis of NS [4]. The evolution of CRP over time in neonates with NS or other inflammatory conditions has been poorly described. One study, with different primary goals, accidentally described CRP values over time in neonates with NS with few cases of confirmed NS, mostly in preterm, with only 4 cases of term neonates [7]. Another study found higher CRP velocity in females, but they included also neonates with normal CRP levels, neonates not receiving antibiotics and they did not specify the sampling time and whether CRP measurement were done before or after antibiotic start [8]. Until now, no study has been published describing CRP values over time after antibiotic treatment in the neonatal population. The CRP decrease pattern over time after its initial peak has been described mainly in the adult population with an estimated half-life of 19 hours [9]. We found no neonatal-specific data assessing CRP half-life after its peak. Increasing evidences suggest that overlooking sex differences in research leads to poorer outcomes for females [10, 11]. A large epidemiological study on severe sepsis in children in the United States confirmed that being male is a risk factor for worse outcomes in cases of prematurity and some neonatal infections [12]. Moreover, a genome-wide association study with 224 LONS cases showed that genetic susceptibility to LONS exhibits sexual dimorphism, with NOTCH signaling playing a role in determining the associated risk [13]. In children with sepsis or other infectious conditions, CRP values are more likely to be higher in females than in males [14, 15]. In the early stage of the infection, inflammatory biomarkers are more elevated in females, indicating a stronger immune activation. Over time, a distinct kinetic pattern emerges between sexes in the return to homeostasis. In contrast, levels of proinflammatory cytokines, such as interleukin (IL)−1β, and tumor necrosis factor-alpha (TNF-α), are higher in men, whereas women exhibit elevated levels of anti-inflammatory mediators, notably IL-10 [16–19].
This study aims to determine whether there are sex-based differences in CRP kinetics over time during the early neonatal period in neonates with likely EONS. Our objective is to provide sex-based differential references describing how CRP rises before and stabilizes after antibiotic treatment and how quickly CRP decreases after its peak.
Methods
Operational definitions
Early onset neonatal sepsis (EONS): NS occurring within the first 72 hours of life [1].
Clinical symptoms: Fever (> 38°), hypothermia (< 36,0°), poor sucking, hemodynamic instability, apnoea, respiratory distress, cyanosis, grunting, irritability, recurrent hypoglycemia, and purpura-like cutaneous rash.
Infectious risk factors: maternal fever, prolonged membrane rupture, maternal group B streptococcus, colonization, chorioamnionitis and maternal antibiotic treatment + integrated calculation of risk using neonatal sepsis risk calculator, as developed by Kuzniewicz et al. [20–23].
Abnormal laboratory findings: CRP higher than 20 mg/L or white cells lower than 4000/μl.
Suspected EONS: neonates treated with antibiotics because the clinician suspected EONS on the basis a combination of at least two of the following three criteria: presence of at least one clinical symptom, one infectious risk factor and one abnormal laboratory finding.
Unlikely EONS: suspected EONS (as previously defined) with CRP measurements never higher than 10 mg/L.
Likely EONS: suspected EONS (as previously defined) with at least one CRP measurement higher than 10 mg/L.
Confirmed EONS: suspected EONS with positive culture of blood or another sterile site.
Unconfirmed EONS: culture-negative suspected EONS.
Study design and setting
This is a monocentric retrospective cohort study conducted in the neonatal unit (NU) and maternity ward (MW) of Etterbeek-Ixelles Hospital (EIH). We included all neonates born in the facility between January 2017 and December 2022 and treated with antibiotics. We excluded patients who started antibiotic therapy after 72 hours of life. Patients whose CRP concentrations remained under 10 mg/L during the hospital stay (unlikely EONS) were also excluded. Only blood samples obtained in EIH were considered in the analysis of patients who had to be transferred to other centres. EIH MW has an average of 2000 live births/year, and the NU has an admission rate of approximately 400 patients/year with a multi-ethnic patient population. Neonates treated with antibiotics in EIH MW are systematically admitted for the first few hours in the NU. As EIH NU provides sub-intensive neonatal care, preterm neonates before 32 weeks of gestational age are transferred to larger centres, as well as neonates with a birth weight under 1500 grams. EIH NU has incubators and can provide non-invasive ventilation, oxygen therapy, parenteral nutrition via central lines and nasogastric tube feeding. In EIH NU and MW, the first-line treatment of NS is a combination of amoxicillin-amikacin (5 days of amoxicillin and 2 days of amikacin), and the second-line treatment consists of the association of amoxicillin-cefotaxime. The tool of the neonatal sepsis risk calculator, as developed by Kuzniewicz et al*.* [20–23] has been systematically used to assess the NS risk since January 2020. In EIH NU and MW, CRP is measured before antibiotic treatment at 0, 12, and 24 hours of life in the presence of infectious risk factors. CRP is systematically measured 12 and 30 hours after antibiotic treatment. EIH laboratory uses an immunoturbidimetric method by Cobas 8000 module c702 of Roche Diagnostics in order to measure CRP. The detection limit is 0.3 mg/l, the inter-assay coefficient of variation is 4,93% at a concentration of 0,84 mg/L (standard deviation: 0,04 mg/L), based on local method verification using internal quality controls.
Data collection and statistical analysis
Patients’ files were retrospectively reviewed to collect the data. The following information was collected: date of birth, birth weight and its Z-score, gestational age at birth, sex, type of delivery, presence of infectious risk factors, data about clinical presentation of neonates (fever, jaundice, respiratory distress, time of antibiotic start and blood culture result), CRP values and time of sampling. Frequencies and proportions were calculated for categorical variables. The Fisher’s exact test was used to determine the association between categorical variables. Continuous variables were described using the median and interquartile range. The Mann-Whitney test was performed for continuous variables. By convention, we decided to express time in hours and CRP in mg/L. We will refer to “base 2 CRP logarithm” (CRPlog2) as the base 2 logarithm of CRP values expressed in mg/L. We decided to describe CRP and CRPlog2 kinetics according to three different time axes. The first axis of time considers birth as time 0 and aims to describe the ascending phase of CRP and CRPlog2 before antibiotic start. The second axis of time considers antibiotic start as time 0 and seeks to describe the ascending-descending transition phase. The third axis of time designates time 0 as the point at which CRP peaks and aims to describe the subsequent descending phase. We fitted two identical models (one for CRP and one for CRPlog2) for each time axis. To describe the ascending kinetics of CRP and CRPlog2 in male and female neonates, we fitted a piecewise linear mixed-effects regression model where birth was considered as time zero with one knot at 12 hours of life, with observations occurring after 24 hours of life or after antibiotic treatment being excluded. Sex was the only covariate in this model. To describe the transition of CRP and CRPlog2 from ascending to descending phase, we fitted a piecewise linear mixed-effects regression model where antibiotic treatment start was considered as time zero with one knot at 12 hours of antibiotic treatment and observations occurring before antibiotic treatment or 30 hours after were excluded. Sex and time of antibiotic start (at birth vs after birth) were the two covariates in this model. To describe the descending kinetics of CRP and CRPlog2 in male and female neonates, we fitted a linear mixed-effects regression model where the CRP peak was considered as time zero, with observations occurring before the CRP peak or 120 hours after being excluded. Sex was the only covariate in this model. In all fitted models, we introduced a random effect on intercepts and slopes and we used the restricted maximum likelihood method to calculate standard error. We used an unstructured covariance matrix for serial correlation for all fitted models. A p-value of < 0.05 was considered statistically significant. Statistical analyses were performed using STATA version 19 for MacOS (StataCorp, College Station, Texas 77845 USA).
Results
During the study period, 506 neonates met the inclusion criteria, with 304 males (60.1%) and 202 females (39.9%). Table 1 summarizes the population’s general demographic and clinical characteristics according to sex.
Table 1. General characteristics of neonates with CRP rise higher than 10 mg/L admitted to Ixelles neonatal unit (Bruxelles, Belgium) from January 2017 to December 2022Males (n=304)Females (n=202)Total (n=506)Fisher’s exact/Mann-Whitney test p-value Neonatal characteristics
Gestational age (n=506) Late preterm (32–37 weeks)10 (3.3%)3 (1.5%)13 (2.6%)0.17Term (>37 weeks)294 (96.7%)199 (98.5%)493 (97.4%)Gestational age weeks (median p25 p75)40 (39 41)40 (39 41)40 (39 41)0.58 Birth weight (n=506) Low birth weight (1.5–2.5 kg)11 (3.6%)3 (1.5%)14 (2.8%)0.17Normal birth weight (>2.5 kg)293 (96.4%)199 (98.5%)492 (97.2%)Birth weight Kg (median p25 p75)3.6 (3.23 3.86)3.43 (3.16 3.73)3.52 (3.2 3.8)0.006Birth weight Z-score (median p25 p75)0.10 (−0.48 0.79)0.16 (−0.5 0.81)0.12 (−0.48 0.79)0.34 Clinical characteristics Respiratory distress (n=499)65 (21.7%)44 (22.1%)109 (21.8%)0.91Jaundice (n=499)36 (12.0%)13 (6.5%)49 (9.8%)0.047Fever (n=503)28 (9.3%)19 (9.4%)47 (9.3%)1.0Treatment started at birth (n=506)86 (28.3%)63 (31.2%)149 (29.4%)0.49Treatment duration <72 hours (n=506)12 (3.9%)8 (3.9%)20 (3.9%)1.0Positive blood culture (n=506)0 (0%)0 (0%)0 (0%)1.0Contaminant positive blood culture (n=506)7 (2.3%)4 (2.0%)11 (2.2%) Delivery characteristics
Delivery type (n=506) Vaginal141 (34.9%)99 (49.0%)240 (47.4%)0.76Vacuum-assisted106 (46.4%)70 (34.7%)176 (34.8%)Caesarean57 (18.7%)33 (16.3%)90 (17.8%) Infectious risk factors Maternal fever (n=491)56 (19.0%)44 (22.3%)100 (20.4%)0.42Maternal chorioamnionitis (n=500)8 (2.7%)2 (1.0%)10 (2.0%)0.33Prolonged membrane rupture (>18 h) (n=490)68 (23.0%)38 (19.5%)106 (21.6%)0.37Meconial amniotic liquid (n=476)113 (39.5%)87 (45.8%)200 (42.0%)0.18Maternal antibiotic treatment (n=499)154 (51.5%)86 (43.0%)240 (48.1%)0.07GBS colonisation (n=482)84 (29.2%)42 (21.6%)126 (26.1%)0.07
In our population, 2.6% of neonates were born preterm, and 2.8% presented with a low birth weight. Treatment was started at birth in 29.4% of cases. Male neonates presented more frequently jaundice (12% vs 6.5%, p-value 0.047). We had no neonate with positive blood culture or fatal outcome. Table 2 shows the evolution of CRP and its base 2 logarithm before antibiotic treatment, in the first 12 hours of life and from 12 to 24 hours of life.Table 2. Piecewise mixed linear spline regression model with random effects on intercept and slopes predicting CRP and base 2 CRP logarithm in male and female neonates from birth to antibiotic start in the first 24 hours of lifeFixed effectsCRP (mg/L)CRPlog2 (mg/L)CoefficientP-value[95% Conf. Interval]CoefficientP-value[95% Conf. Interval]♂Intercept(at birth)2.177<0.0011.4112.943−0.563<0.001−0.758−0.367♀2.338<0.0011.4113.266−0.522<0.001−0.758−0.286Delta ♀-♂0.1610.793−1.0421.3630.0400.796−0.2660.347♂h0-12slope(/h)0.907<0.0010.7781.0360.316<0.0010.3000.334♀1.245<0.0011.0861.4040.355<0.0010.3330.377Delta ♀-♂0.3380.0010.1330.5420.0390.0070.0110.068♂h12-24slope(/h)2.064<0.0011.9162.2130.155<0.0010.1420.168♀1.908<0.0011.7182.0970.116<0.0010.1000.132Delta ♀-♂−0.1570.202−0.3970.084−0.039<0.001−0.060−0.018Random effectsVariance of intercept29.29..2.599..Variance of slopesH0-120.639..0.015..H12-240.784..0.005..Conditional intraclass correlation0.680.680680.930.930.93Conditional R^2^0.960.97Marginal R^2^0.590.76Number of patients497497Number of observations10421042Residual-fitted values diagnostic plots for both models are provided in supplementary materials sectionSlopes are expressed in mg/L/hour. Intercepts are expressed in mg/L♂: male neonates; ♀: female neonates Delta ♀-♂: difference between male and female neonates
At time 0 (birth) both sexes had mean CRP values statistically different from 0 (2.18 mg/L; 95% CI= 1.41 2.94 for males and 2.34 mg/L; 95% CI 1.41 3.27 for females) with no statistically significant difference between sexes. In both sexes, CRP level rose in the first 12 hours of life (0.91 mg/L/hour; 95% CI= 0.78 1.04 for males and 1.24 mg/L/hour; 95% CI= 1.09 1.4 for females). Female neonates had a statistically significant faster rise in CRP (+ 0.34mg/L/hour; 95% CI= 0.13 0.54) compared to males. From hour 12 to hour 24 of life, CRP had a more rapid rise in both sexes (2.06 mg/L/hour; 95% CI=1.92 2.21 for males and 1.91 mg/L/hour; 95% CI= 1.72 2.1 for females) with no statistically significant difference between sexes. Figure 1 graphically represents these findings in its left part.Fig. 1. Graphic representation of CRP concentrations according to regressions models shown in tables 2 (left part), 3 (middle part) and 4 (right part). On the left part: Piecewise mixed linear spline regression model with random effects on intercept and slopes predicting CRP (mg/l) in male and female neonates from birth to antibiotic start in the first 24 hours of life (497 patients, 1042 observations). In the middle part: Piecewise mixed linear spline regression model with random effects on intercept and slopes predicting CRP (mg/l) from antibiotics start to 30 hours thereafter in male and female neonates according to the timing of antibiotics start (506 patients, 1525 observations). On the right part: Mixed linear regression model with random effects on intercept and slope predicting CRP (mg/l) in male and female neonates from CRP peak to 120 hours thereafter (506 patients, 1730 observations)
For CRPlog2, the pattern was quite similar, with no statistically significant difference between sexes at birth, and with both sexes having a mean CRPlog2 level different from 0 (−0.56 log2 mg/L; 95% CI=−0.76 −0.37 for males and −0.52 log2 mg/L; 95% CI= −0.76 −0.29 for females). In the first 12 hours, both sexes had a statistically significant rise in CRPlog2 (0.32 log2 mg/L/hour; 95% CI= 0.31 0.35 for males and 0.36 log2 mg/L/hour; 95% CI=0.33 0.38 for females) with a statistically significant faster rise of CRPlog2 in females (+0.039 log 2 mg/L/hour 95% CI= 0.01 0.07). From hour 12 to hour 24 both sexes had a statistically significant increase in CRPlog2 (0.15 log2 mg/L/hour; 95% CI= 0.14 0.17 for males and 0.12 log2 mg/L/hour; 95% CI=0.10 0.13 for females) with a less rapid rise of CRPlog2 in females (−0.039/hour 95% CI= −0.06 −0.018). This means that, in our population, CRP plasma concentrations in the first 12 hours of life doubled every 3.2 hours for male neonates and every 2.8 hours for female neonates. Therefore, after the 12^th^ hour of life, it took 6.5 hours for male neonates and 8.6 hours for female neonates to double CRP plasma concentrations. Figure 2 graphically represents these findings in its left part.Fig. 2. Graphic representation of CRPlog2 according to regressions models shown in tables 2 (left part), 3 (middle part) and 4 (right part). On the left part: Piecewise mixed linear spline regression model with random effects on intercept and slopes predicting base 2 CRP logarithm (mg/l) in male and female neonates from birth to antibiotic start in the first 24 hours of life (497 patients, 1042 observations). In the middle part: Piecewise mixed linear spline regression model with random effects on intercept and slopes predicting base 2 CRP logarithm (mg/l) from antibiotics start to 30 hours thereafter in male and female neonates according to the timing of antibiotics start (506 patients, 1525 observations).On the right part: Mixed linear regression model with random effects on intercept and slope predicting base 2 CRP logarithm (mg/l) in male and female neonates from CRP peak to 120 hours thereafter (506 patients, 1730 observations)
Table 3 shows the different evolutions of CRP levels and its base 2 logarithm after antibiotic treatment, according to sex and the timing of antibiotic treatment (started at birth vs not); slopes are described in the first 12 hours of antibiotic treatment and afterward, up to 30 hours from antibiotic start.Table 3. Piecewise mixed linear spline regression model with random effects on intercept and slopes predicting CRP and base 2 CRP logarithm in male and female neonates according to the timing of antibiotics start (at birth or after) and from antibiotics start to hour 30 after its startFixed effectsCRP (mg/L)CRPlog2 (mg/L)CoefficientP-value[95% Conf. Interval]CoefficientP-value[95% Conf. Interval]Antibiotics started at birth♂Intercept(at antibiotic start)4.610.0031.557.680.2190.116−0.0540.492♀5.420.0031.829.030.2790.088−0.0410.598Delta ♀-♂0.810.737−3.925.54−0.0600.78−0.3600.480♂h0-12slope(/h)1.76<0.0011.472.060.317<0.0010.2970.337♀1.73<0.0011.392.070.326<0.0010.3030.350Delta ♀-♂−0.030.892−0.480.420.00930.560−0.0220.041♂h12-30slope(/h)0.38<0.0010.170.580.033<0.0010.02570.041♀0.370.0030.130.610.027<0.0010.01820.036Delta ♀-♂−0.0060.971−0.320.31−0.00610.309−0.01790.0057Antibiotics started after birth♂Intercept(at antibiotic start)32.30<0.00130.3634.244.900<0.0014.7275.070♀33.33<0.00130.9035.764.969<0.0014.7545.184Delta ♀-♂1.040.514−2.084.150.0710.616−0.2050.346♂h0-12slope(/h)0.020.821−0.160.20−0.00410.531−0.01680.0087♀0.270.020.040.50−0.00150.856−0.01750.0145Delta ♀-♂0.250.095−0.040.540.00270.804−0.01780.023♂h12-30slope(/h)−0.69<0.001−0.82−0.56−0.040<0.001−0.0447−0.0351♀−0.80<0.001−0.96−0.64−0.041<0.001−0.047−0.035Delta ♀-♂−0.110.293−0.320.10−0.001570.687−0.00920.0061Random effectsVariance of intercept83.9562.34113.071.571.3691.802Variance of slopesH0-120.0080.0060.009H12-300.00050.00020.001H post-antibiotic0.090.040.17Conditional intraclass correlation0.390.310.480.930.890.96Conditional R^2^0.670.96Marginal R^2^0.200.62Number of patients506506Number of observations15251525Residual-fitted values diagnostic plots for both models are provided in supplementary materials sectionSlopes are expressed in mg/L/hour. Intercepts are expressed in mg/L♂: male neonates; ♀: female neonates Delta ♀-♂: difference between male and female neonates
For neonates with antibiotics started at birth, at time 0 (antibiotic start and birth), both sexes had mean CRP values different from 0 (4.61 mg/L; 95% CI= 1.55 7.68 for males and 5.42 mg/L; 95% CI 1.82 9.03 for females). In both sexes, CRP levels rose in the first 12 hours of antibiotic treatment (1.76 mg/L/hour; 95% CI= 1.47 2.06 for males and 1.73 mg/L/hour; 95% CI= 1.39 2.07 for females). From hour 12 to hour 30 of antibiotic treatment, CRP kept rising at a less rapid rate in both sexes (0.38 mg/L/hour; 95% CI= 0.17 0.58 for males and 0.37 mg/L/hour; 95% CI= 0.13 0.61 for females). On the other hand, for neonates with antibiotics started after birth, at time 0 (antibiotic start), both sexes had mean CRP values statistically different from 0 (32.3 mg/L; 95% CI= 30.36 34.24 for males and 33.33 mg/L; 95% CI 30.90 35.76 for females), but these values were considerably higher than those of the neonates who received antibiotics at birth. Unlike neonates treated at birth, those treated after birth had CRP levels that remained stable in the first 12 hours of antibiotic treatment (0.02 mg/L/hour; 95% CI= −0.16 0.20 for males and 0.27 mg/L/hour; 95% CI= 0.04 0.50 for females) and from hour 12 to hour 30 of antibiotic treatment, CRP levels started to decrease (−0.69 mg/L/hour; 95% CI= −0.82 −0.56 for males and −0.80 mg/L/hour; 95% CI= −0.96 −0.64 for females). We found no statistically significant difference between sexes in both groups (antibiotics started at birth or after), neither in intercepts nor in slopes. Figure 1 graphically represents these findings in its middle part.
Regarding neonates with antibiotics started at birth, at time 0 (antibiotic start and birth), CRPlog2 values were not statistically different from 0 (0.22 log2 mg/L; 95% CI= −0.06 0.49 for males and 0.28 log2 mg/L; 95% CI −0.04 0.60 for females). In both sexes, CRPlog2 rose in the first 12 hours of antibiotic treatment (0.32 log2 mg/L/hour; 95% CI= 0.30 0.34 for males and 0.33 log2 mg/L/hour; 95% CI= 0.30 0.35 for females). From hour 12 to hour 30 of antibiotic treatment, CRPlog2 kept rising with a less rapid rate in both sexes (0.033 log2 mg/L/hour; 95% CI= 0.026 0.041 for males and 0.027 log2 mg/L/hour; 95% CI= 0.018 0.036 for females). On the other hand, for neonates with antibiotics started after birth, at time 0 (antibiotic start) both sexes had mean CRPlog2 values statistically different from 0 (4.9; 95% CI= 4.73 5.07 for males and 4.97; 95% CI 4.75 5.18 for females) and much higher compared to the neonates with antibiotics started at birth. Unlike neonates treated at birth, in those treated after birth, CRPlog2 remained stable in the first 12 hours of antibiotic treatment (−0.004 log2 mg/L/hour; 95% CI= −0.02 0.01 for males and −0.0015/hour; 95% CI= −0.02 0.014 for females) and from hour 12 to hour 30 of antibiotic treatment, CRPlog2 started to decrease (−0.04 log2 mg/L/hour; 95% CI= −0.045 −0.035 for males and −0.04 log2 mg/L/hour; 95% CI= −0.047 −0.035 for females). In both groups (antibiotic started at birth or after), we found no statistically significant difference between sexes, neither in intercept nor in slopes. Figure 2 graphically represents these findings in its middle part.
Table 4 presents the various evolutions in CRP levels and its base 2 logarithm following CRP peak. Table 4. Mixed linear regression model with random effects on intercept and slope predicting CRP and base 2 CRP logarithm in male and female neonates from CRP peak to 120 hours thereafterFixed effectsCRP (mg/L)CRPlog2 (mg/L)CoefficientP-value[95% Conf. Interval]CoefficientP-value[95% Conf. Interval]♂Intercept(at time of CRP peak)32.654<0.00130.50134.8084.954<0.0014.8685.039♀34.995<0.00132.35237.6385.041<0.0014.9365.146Delta ♀-♂2.3410.178−1.0695.7500.0870.208−0.0490.223♂Slope(/h)−0.3180<0.001−0.341−0.295−0.0322<0.001−0.03308−0.03138♀−0.3434<0.001−0.372−0.315−0.0324<0.001−0.03346−0.03142Delta ♀-♂−0.02540.173−0.0620.011−0.000210.756−0.0015360.001116Random effectsVariance of intercept18.28817.08519.5760.7380.690.789Variance of slope0.1710.1570.1860.0060.0050.007Conditional intraclass correlation0.860.840.880.900.880.91Conditional R^2^0.860.97Marginal R^2^0.360.66Number of patients506506Number of observations17301730Residual-fitted values diagnostic plots for both models are provided in supplementary materials sectionSlopes are expressed in mg/L/hour. Intercepts are expressed in mg/L♂: male neonates; ♀: female neonates Delta ♀-♂: difference between male and female neonates
At time 0 (CRP peak), both sexes had mean CRP values statistically different from 0 (32.65 mg/L; 95% CI= 30.5 34.81 for males and 35.0 mg/L; 95% CI 32.35 37.64 for females) with no statistically significant difference between sexes in CRP peak levels. In both sexes, CRP levels decreased (−0.32 mg/L/hour; 95% CI= −0.34 −0.29 for males and −0.34 mg/L/hour; 95% CI= −0.37 −0.31 for females) with no statistically significant difference between sexes. Figure 1 graphically represents these findings in its right part. Unfortunately, this model does not fit the data correctly, as CRP would drop below zero after 96 hours from peak. The CRPlog2 model seems much more adequate in describing the CRP dropping kinetic (residual-fitted values diagnostic plots are provided in supplementary materials). At time 0 (CRP peak), both sexes had mean CRPlog2 values statistically different from 0 (4.95 log2 mg/L; 95% CI= 4.87 5.04 for males and 5.04 log2 mg/L; 95% CI 4.94 5.15 for females) with no statistically significant difference between sexes. Therefore, we found no differences in CRP peak values between male and female neonates. In both sexes, CRPlog2 levels decreased (−0.032 log2 mg/L/hour; 95% CI= −0.033 −0.032 for males and −0.032 log2 mg/L/hour; 95% CI= −0.033 −0.031 for females) with no statistical difference between sexes. Thus, after the peak, CRP decreased by half every 31.1 hours in males and 30.9 hours in females, with no statistically significant difference. Figure 2 represents graphically these findings in its right part.
Discussion
In our population, for every two female neonates, three males were included, reflecting a higher proportion of male neonates treated for EONS, consistent with figures reported by other authors [24]. The higher risk of jaundice in our male population can be attributed to the multiethnicity of the Brussels community, with a high prevalence of glucose-6-phosphate-dehydrogenase deficiency, a condition linked to a gene located on the X chromosome. Neonates in our population seem to present less likely preterm birth and low birth weight compared to current literature (median gestational age of 40 weeks versus 39 and birth weight of 3520 g versus 3250 g) [24]. The lower proportion of confirmed EONS compared to other authors (0% versus 375/21 703=1.7%) [24] can be explained by the characteristics of our NU, which serves as a peripheral non-referral centre, with fewer preterm and critically ill neonates. CRP and CRPlog2 values in neonates with likely but unconfirmed EONS significantly rise significantly in the first 24 hours of life, exceeding levels observed in a healthy neonatal population [5]. Interestingly, female neonates showed an earlier and more rapid increase in CRP or CRPlog2 values with higher levels at 12 hours of life, consistent with previous reports [8, 14, 15]. Both sexes seem to reach a plateau of CRPlog2 at 24 hours of life, suggesting that male and female neonates would achieve the same level of CRPlog2 at a steady state, but female neonates would reach it faster. No statistically significant sex differences were found in CRP peak, however, as this is a retrospective study, we might have failed to show the difference in CRP peak between sexes just because once CRP was observed rising earlier in female neonates, they might have experienced a faster antibiotic start.
We will now focus on the hypothised mechanism that could explain the figures we observed in our population. The first hours of an inflammatory response mainly involve innate immunity, especially in neonates, whose adaptative immunity is still immature and depends significantly on the maternal antibodies providing only passive immunity against pathogens. This innate response seems triggered by the detection of pathogen-associated molecular patterns by the Toll-like receptors (TLR) [25]. TLR activation could lead to the production of pro-inflammatory cytokines, such as the IL-6, controlling the secretion of CRP by the hepatocytes. The evidences from Chang et al [26] even if coming from a non-paediatric population, seem to corroborate this hypothesis. Moreover, the genes of principal protein members of the TLR signaling pathway seem to be linked to the X-chromosome [25], and polymorphisms of X-linked genes of the TLR pathway may play a role in the differences we observed. Higher CRP levels were reported in prepubertal girls with acute inflammatory processes such as pneumonia, bronchiolitis, pyelonephritis, and severe sepsis [14, 15], even though most in vitro studies showed higher IL-6 levels in men than in women after TLR stimulation [27–29]. Genes encoding some of the main proteins in the TLR signaling pathway are located on the X chromosome [25], and polymorphisms in X-linked TLR pathway genes may contribute to the differences we observed. Indeed, higher IRAK1 gene and protein expression in leukocytes has been described by others authors in female neonates, supporting that expression of TLR4 signaling kinases encoded on the X chromosome might be modified in monocytes from female umbilical cord blood [30]. That increased basal expression of IRAK1 could contribute to the higher inflammatory response and better prognosis observed in female neonates. The placental response to pathogens is another possible hypothised mechanism that could explain sex differences in the neonatal inflammatory response, as the placenta carries the identical sex chromosomes as the foetus. Analysis of the transcriptome of late first-trimester placentas from Sun et al. [31], revealed enhanced levels of genes related to immunity and cytokine-mediated signaling in female placentas.
In the first 30 hours of antibiotics, we found no sex differences in CRP and CRPlog2 over time, likely due to the effect of the treatment initiated in likely EONS. On the other hand, we found a very different pattern between neonates treated at birth and those treated after birth, especially in the first 12 hours after antibiotics start. Two non-contradictory hypotheses might explain these differences. In the first one, we assume that neonates treated at birth are more likely to be symptomatic and thus more critically ill, with a faster rise in CRP in the first 12 hours and a slower response to antibiotics failing to show a decrease in CRP levels between 12 and 30 hours after antibiotics start. This hypothesis is corroborated by the fact that neonates treated at birth had higher CRP and CRPlog2 values at birth than those treated after birth. In the second hypothesis, we assume that CRP could exhibit an exponential growth pattern until reaching a steady state. We could also assume that antibiotics do not affect CRP levels in the first 12 hours of treatment. In this scenario of assumptions, the differences observed could be explained by the fact that antibiotics have been started after reaching the steady state for neonates treated after birth and before reaching the steady state for neonates treated at birth. The fact that the slope of the CRPlog2 in the first 12 hours of life before treatment is very similar to the slope of the first 12 hours of life of neonates treated at birth corroborates this hypothesis. It suggests that the logarithmic model is more adequate in describing the rising levels of CRP over time. We found no sex differences in the CRP decreasing phase. Our findings show how CRP clearly decreases following a logarithmic pattern with a considerably longer half-life (30–31 hours) compared to the 19 hours of adults [9].
Strengths and limitations
To our knowledge, this is the first study describing sex-specific differences in inflammation in a population with EONS. Moreover, previously described CRP values came from a primarily Caucasian healthy neonatal population [5]. Our study provides values from a multi-ethnic neonatal population with likely but unconfirmed EONS. Since prenatal infections are uncommon, we can reasonably assume that birth (time zero) marks the onset of the inflammatory process. This timing is uncertain in other studies conducted on children or neonates with late-onset infections. The monocentric, retrospective design of the study is a clear and major limitation. Another limitation is linked to the setting: this study has been conducted in a secondary centre where preterm and critically ill neonates are poorly represented. Moreover, none of the cases had a microbiological confirmation, we cannot therefore exclude the possibility that many neonates with aseptic inflammation were included in the study population. Nevertheless, we could assume that CRP’s ascending and descending pattern is likely to be the same regardless of the cause of inflammation. On the other hand, the aetiology of the inflammation certainly significantly influences the CRP evolution over time within the first 30 hours from the start of antibiotics. Accordingly, our results may primarily apply to a predominantly term neonatal population, with a small percentage of preterm neonates, in a secondary centre serving a multi-ethnic, high-income society. Moreover, the results can only be extended to neonates with likely but unconfirmed EONS (as defined in methods section).
Conclusion
In neonates with likely but unconfirmed EONS, (as previously defined), CRP probably increases following a logarithmic pattern. Before antibiotic treatment, female neonates in our population have a statistically significant earlier rise in CRP levels. On the other hand, we found no significant differences between sexes in CRP peak levels. After reaching its peak, CRP levels decreased following a logarithmic pattern with no differences between sexes. These findings cannot yet lead to a clinical, sex-specific recommendation of different CRP timing tests and thresholds, unless prospective validation comes from some more studies with larger sample size including more preterm neonates and confirmed sepsis cases.
Supplementary Material
Below is the link to the electronic supplementary material.
Supplementary Material 1
The reference list from the paper itself. Each links out to its DOI / PubMed record.
- 1Benitz WE HM, Madan A, Ramachandra P. Serial serum C-reactive protein levels in the diagnosis of neonatal infection. Pediatrics 1999; 102.10.1542/peds.102.4.e 419755278 · doi ↗ · pubmed ↗
- 2Woodward M. Cardiovascular disease and the female disadvantage. Int J Environ Res Public Health. 2019; 16(7).10.3390/ijerph 16071165 PMC 647953130939754 · doi ↗ · pubmed ↗