The more, the better? Stress response in related polyploid ferns
Steven Awad, Madeline Kenney, Jennifer Blake-Mahmud

TL;DR
This study examines how polyploid ferns respond to environmental stress compared to their diploid parents.
Contribution
The study reveals that polyploid ferns do not show greater resilience to heat and drought than diploid species.
Findings
Polyploid fern gametophytes did not show significant physiological advantages under stress.
Diploid and polyploid species had similar stress responses to heat and drought.
Results challenge the assumption that polyploidy enhances stress resilience in ferns.
Abstract
Polyploidy, or whole genome duplication, is common in land plants. Polyploidy causes new gene combinations and is thought to provide an advantage amid the rising temperature and unpredictable precipitation regimes expected under climate change. Using related woodfern species, we investigated the gametophyte physiology of two parent species, Dryopteris intermedia (2n) and Dryopteris expansa (2n) in comparison to their polyploid offspring, Dryopteris campyloptera (4n) . We subjected gametophytes from each species to environmentally stressful heat and drought conditions. Surprisingly, the polyploid did not exhibit a significant physiological advantage or greater resilience to stress compared to the diploid parents.
Genes, proteins, chemicals, diseases, species, mutations and cell lines named across the full text — each resolved to its canonical identifier and authoritative record.
Click any figure to enlarge with its caption.
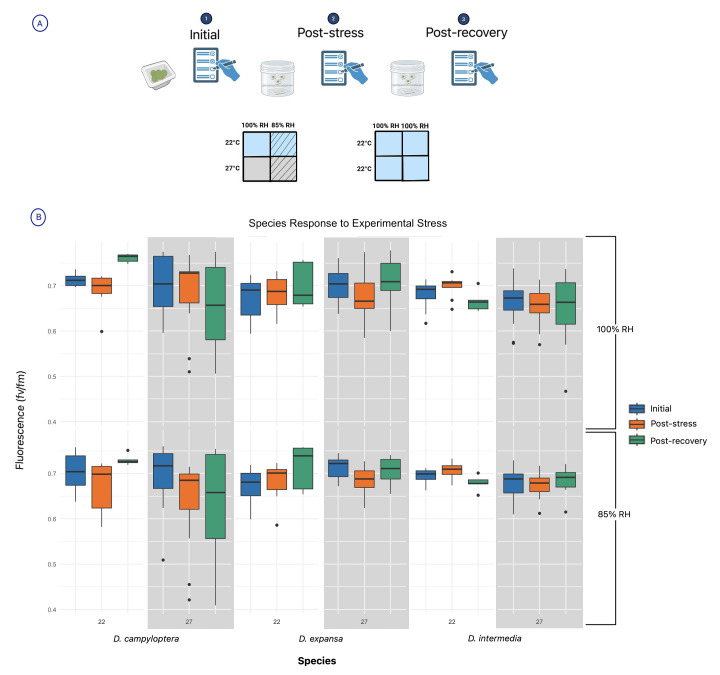 Figure 1
|
Variable |
DF |
F-value |
P-value |
|
Species |
2, 144.68 |
1.515 |
0.223 |
|
Temperature |
1, 144.68 |
4.648 |
0.0328 |
|
Time |
2, 222.98 |
3.950 |
1.958e-06 |
|
Species: temperature |
2, 144.68 |
2.268 |
0.107 |
|
Species: time |
4, 222.98 |
8.419 |
2.420e-06 |
|
Temperature: time |
2, 222.98 |
1.5381 |
1.705e-05 |
|
Species: temperature: time |
4, 222.98 |
6.2396 |
8.912e-05 |
|
22 |
27 | |||
|
Species |
p-value |
estimate |
p-value |
estimate |
|
Initial to Post-Stress | ||||
|
|
0.1899 |
0.027 |
|
|
|
|
0.9419 |
— |
1.00 |
— |
|
|
0.9994 |
— |
0.1064 |
0.0255 |
|
Post-recovery to Post-Stress | ||||
|
|
<0.0001 |
0.0699 |
0.9998 |
— |
|
|
0.9164 |
— |
0.9995 |
— |
|
|
0.1075 |
0.03795 |
0.7941 |
— |
|
Initial to Post-Recovery | ||||
|
|
0.03 |
-0.0428 |
|
|
|
|
1.00 |
— |
1.00 |
— |
|
|
0.0053 |
-0.0485 |
1.00 |
— |
Peer Reviews
No public reviews on file for this paper yet. If you reviewed it on a platform where reviews are public (OpenReview, ICLR, NeurIPS, ICML), you can paste yours below so the community can read it here.
Videos
No videos yet. Explain this paper in a talk, walkthrough, or lecture? Add one.
Taxonomy
TopicsFern and Epiphyte Biology · Chromosomal and Genetic Variations · Plant Taxonomy and Phylogenetics
Description
Polyploidy, or whole genome duplication, results in an individual possessing one or more extra sets of genetic material (Wood et al., 2009). Although polyploid species may incur difficulties associated with managing additional genetic material (Heslop-Harrison et al., 2022; Madlung, 2012), most studies herald the advantages brought about by polyploidy (Fox et al., 2020; Van de Peer et al., 2020), particularly under environmental stress conditions. Understanding the positive, negative, or neutral effect of polyploidy is critical, considering the essential role of allopolyploid woodfern species play within their mesic forest habitats (Wagner, 1971). Given the rising temperatures and extreme weather events associated with climate change (USGCRP, 2023), a more thorough understanding of the impact of stress on polyploids and related parent species is needed. As such, our study examines the effect of polyploidy on the physiological response to stress of the related parent ferns Dryopteris intermedia (2n) and Dryopteris expansa (2n), and their offspring Dryopteris campyloptera (4n).
Fern species are crucial to their habitats. They influence essential processes in their environments, including soil quality improvement (Lyu et al., 2019), and shading coverage for developing seedlings (Gould et al., 2013). Within the fern lifecycle, there are two distinct generations: the gametophyte and sporophyte (Krieg and Chambers, 2022). The haploid heart-shaped gametophyte is the fern’s sexual stage and is free-living (Krieg and Chambers, 2022). At this life-stage, the independent gametophyte is in equilibrium with its environment, lacking the homeostatic mechanisms of a mature sporophyte (Watkins et al., 2007b). It is largely dependent on its surrounding environment: if the environment is dry, the gametophyte is dry; if its surroundings are hot, the gametophyte is hot. After fertilization, the gametophyte produces a diploid zygote and enters its longest and dominant stage – the independent sporophyte generation in which the fern is self-sustaining and resistant to desiccation (Haufler et al., 2016).
We subjected the gametophytes of three related ferns, Dryopteris intermedia * (2n), Dryopteris expansa (2n), and Dryopteris campyloptera (4n) to 48 hours of stress via drought (i.e., decreased relative humidity) and heat (i.e., increased temperature) experimental conditions. A linear mixed model (LMM) was built to evaluate the impact of the following predictors on stress levels: two 3-way interactions, SpeciesTimeTemperature, SpeciesTemperatureRelative humidity, and all nested lower-order interactions, with the individual as a random effect. We selected the final best-fitting model based on BIC. That final model contained a 3-way interaction between SpeciesTime*Temperature, all lower-order nested terms, and maintained the random effect of the individual. Surprisingly, the experimental parameter of relative humidity was not significant and worsened the model fit. Therefore, relative humidity was not included in the final model, thus indicating that this aspect of the experimental design did not constitute stress for these gametophytes. Model details are available in Table 1.
There was a statistically significant 3-way interaction between species, time, and temperature. This indicates that the difference in stress response across measurement timepoints varied based on temperature (p = 1.705e-05). This relationship was further impacted by species (p = 8.912e-05). We used emmeans to further investigate the interaction and found that the model-predicted response to stress between the initial and the post-stress timepoints was stronger within the 27-degree temperature treatment, particularly in the case of the tetraploid, *D. campyloptera. * More specifically, the model predicted a higher stress in 27-degrees for *D. campyloptera * (p = 0.0003). This points to the negative short-term effect of increased temperature on D. campyloptera ( 4n). This evidence supports the idea that polyploidy does not always confer an immediate advantage in response to environmental stress.
These data are surprising, especially considering that an increase in genetic content might allow a synthesis of new genetically expressed characteristics that may help with combating stress (Leitch & Leitch, 2008; Ramsey, 2011). A study done on fern gametophytes in 2024 found that polyploidy enhanced the species’ ability to tolerate drought and heat stress conditions (Blake-Mahmud et al., 2024). Upon immediate comparison, these studies appear to contradict one another. However, it is crucial to acknowledge that the 2024 study saw the enhancing effects of polyploidy in more extreme conditions. The use of 75% relative humidity and 32℃ exposed the fern gametophytes to a greater amount of stress compared to the 85% relative humidity and 27℃ used in this study. The difference in response to varying severity of stress exposure led us to hypothesize that the polypoidal response to temperature and dryness may involve a threshold effect, beyond which gene activation occurs and mitigates the effects of the stress in the polyploid generation (Sade et al., 2012). As a result, the more moderate stress treatments in this experiment were insufficient to cross the threshold for subsequent increased response in gene activation.
Following the experimental stress, we placed the gametophytes in benign conditions (RH:100%, T: 22℃) to recover for 72 hours and measured their stress levels again. Despite D. campyloptera’s negative response to stress, a comparison between its initial and final fv/fm measurements indicates that there is no significant long-term effect of short-term temperature and drought stress (p = 0.2293). In fact, all three species were able to return to baseline following exposure to stress and subsequent time in cool, moist conditions (Table 1).
Much of the previous research done in this field has focused on stress response in autopolyploids, while our study assessed response in allopolyploids. The presence of a temperature-by-time-by-species interaction in our study suggests that while parent species might possess temperature-resistant genes of their own, those genes might not continue to have the same additive effect when introduced into a hybrid genome in a polyploid offspring. It has been suggested that long periods of consistent exposure to selective factors, particularly to stress, might be needed to hone expression select for resiliency in polyploid genomes (Maherali et al., 2009; Ramsey, 2011). While other research points to the physiological benefit that polyploids appear to hold in the face of environmental stress (Sessa 2018, Van de Peer et al., 2020; Heslop-Harrison et al., 2022), our study indicates no immediate benefit to polyploidy under stressful conditions when compared to their parent diploids. These results could indicate that whole genome duplication alone does not generate an advantageous response (Maherali et al., 2009) to all levels of stress, indicating that the physiological effect of polyploidy on stress may not be linear. This non-linear relationship would suggest that there is a threshold of stress at which the effect of polyploidy on stress response is further amplified and observed (Sade et al., 2012). While our study used mild stress conditions across a short period of time, higher stress levels and longer exposure might reveal more beneficial effects of polyploidy.
Table 1. This table presents the ANOVA results of the best-fit model and the corresponding statistical data.
**: **
<table><tbody><tr><td rowspan="1" colspan="1"> <p>Variable</p> </td><td rowspan="1" colspan="1"> <p>DF</p> </td><td rowspan="1" colspan="1"> <p>F-value</p> </td><td rowspan="1" colspan="1"> <p>P-value</p> </td></tr><tr><td rowspan="1" colspan="1"> <p>Species</p> </td><td rowspan="1" colspan="1"> <p>2, 144.68</p> </td><td rowspan="1" colspan="1"> <p>1.515</p> </td><td rowspan="1" colspan="1"> <p>0.223</p> </td></tr><tr><td rowspan="1" colspan="1"> <p>Temperature</p> </td><td rowspan="1" colspan="1"> <p>1, 144.68</p> </td><td rowspan="1" colspan="1"> <p>4.648</p> </td><td rowspan="1" colspan="1"> <p>0.0328</p> </td></tr><tr><td rowspan="1" colspan="1"> <p>Time</p> </td><td rowspan="1" colspan="1"> <p>2, 222.98</p> </td><td rowspan="1" colspan="1"> <p>3.950</p> </td><td rowspan="1" colspan="1"> <p>1.958e-06</p> </td></tr><tr><td rowspan="1" colspan="1"> <p>Species: temperature</p> </td><td rowspan="1" colspan="1"> <p>2, 144.68</p> </td><td rowspan="1" colspan="1"> <p>2.268</p> </td><td rowspan="1" colspan="1"> <p>0.107</p> </td></tr><tr><td rowspan="1" colspan="1"> <p>Species: time</p> </td><td rowspan="1" colspan="1"> <p>4, 222.98</p> </td><td rowspan="1" colspan="1"> <p>8.419</p> </td><td rowspan="1" colspan="1"> <p>2.420e-06</p> </td></tr><tr><td rowspan="1" colspan="1"> <p>Temperature: time</p> </td><td rowspan="1" colspan="1"> <p>2, 222.98</p> </td><td rowspan="1" colspan="1"> <p>1.5381</p> </td><td rowspan="1" colspan="1"> <p>1.705e-05</p> </td></tr><tr><td rowspan="1" colspan="1"> <p>Species: temperature: time</p> </td><td rowspan="1" colspan="1"> <p>4, 222.98</p> </td><td rowspan="1" colspan="1"> <p>6.2396</p> </td><td rowspan="1" colspan="1"> <p>8.912e-05</p> </td></tr></tbody></table>Table 2. This table depicts the estimated marginal means for the best-fit model. Pairwise comparisons are displayed between timepoints at a given temperature by Species. Statistically significant results are in bold.
**: **
<table><tbody><tr><td rowspan="1" colspan="1"/><td colspan="2" rowspan="1"> <p>22</p> </td><td colspan="2" rowspan="1"> <p>27</p> </td></tr><tr><td rowspan="1" colspan="1"> <p>Species</p> </td><td rowspan="1" colspan="1"> <p>p-value</p> </td><td rowspan="1" colspan="1"> <p>estimate</p> </td><td rowspan="1" colspan="1"> <p>p-value</p> </td><td rowspan="1" colspan="1"> <p>estimate</p> </td></tr><tr><td colspan="5" rowspan="1"> <p>Initial to Post-Stress</p> </td></tr><tr><td rowspan="1" colspan="1"> <p> <italic>D. campyloptera</italic> </p> </td><td rowspan="1" colspan="1"> <p>0.1899</p> </td><td rowspan="1" colspan="1"> <p>0.027</p> </td><td rowspan="1" colspan="1"> <p> <bold>0.0003</bold> </p> </td><td rowspan="1" colspan="1"> <p> <bold>0.037</bold> </p> </td></tr><tr><td rowspan="1" colspan="1"> <p> <italic>D. intermedia</italic> </p> </td><td rowspan="1" colspan="1"> <p>0.9419</p> </td><td rowspan="1" colspan="1"> <p>—</p> </td><td rowspan="1" colspan="1"> <p>1.00</p> </td><td rowspan="1" colspan="1"> <p>—</p> </td></tr><tr><td rowspan="1" colspan="1"> <p> <italic>D. expansa</italic> </p> </td><td rowspan="1" colspan="1"> <p>0.9994</p> </td><td rowspan="1" colspan="1"> <p>—</p> </td><td rowspan="1" colspan="1"> <p>0.1064</p> </td><td rowspan="1" colspan="1"> <p>0.0255</p> </td></tr><tr><td colspan="5" rowspan="1"> <p>Post-recovery to Post-Stress</p> </td></tr><tr><td rowspan="1" colspan="1"> <p> <italic>D. campyloptera</italic> </p> </td><td rowspan="1" colspan="1"> <p><0.0001</p> </td><td rowspan="1" colspan="1"> <p>0.0699</p> </td><td rowspan="1" colspan="1"> <p>0.9998</p> </td><td rowspan="1" colspan="1"> <p>—</p> </td></tr><tr><td rowspan="1" colspan="1"> <p> <italic>D. intermedia</italic> </p> </td><td rowspan="1" colspan="1"> <p>0.9164</p> </td><td rowspan="1" colspan="1"> <p>—</p> </td><td rowspan="1" colspan="1"> <p>0.9995</p> </td><td rowspan="1" colspan="1"> <p>—</p> </td></tr><tr><td rowspan="1" colspan="1"> <p> <italic>D. expansa</italic> </p> </td><td rowspan="1" colspan="1"> <p>0.1075</p> </td><td rowspan="1" colspan="1"> <p>0.03795</p> </td><td rowspan="1" colspan="1"> <p>0.7941</p> </td><td rowspan="1" colspan="1"> <p>—</p> </td></tr><tr><td colspan="5" rowspan="1"> <p>Initial to Post-Recovery</p> </td></tr><tr><td rowspan="1" colspan="1"> <p> <italic>D. campyloptera</italic> </p> </td><td rowspan="1" colspan="1"> <p>0.03</p> </td><td rowspan="1" colspan="1"> <p>-0.0428</p> </td><td rowspan="1" colspan="1"> <p> <bold>0.2293</bold> </p> </td><td rowspan="1" colspan="1"> <p> <bold>0.0277</bold> </p> </td></tr><tr><td rowspan="1" colspan="1"> <p> <italic>D. intermedia</italic> </p> </td><td rowspan="1" colspan="1"> <p>1.00</p> </td><td rowspan="1" colspan="1"> <p>—</p> </td><td rowspan="1" colspan="1"> <p>1.00</p> </td><td rowspan="1" colspan="1"> <p>—</p> </td></tr><tr><td rowspan="1" colspan="1"> <p> <italic>D. expansa</italic> </p> </td><td rowspan="1" colspan="1"> <p>0.0053</p> </td><td rowspan="1" colspan="1"> <p>-0.0485</p> </td><td rowspan="1" colspan="1"> <p>1.00</p> </td><td rowspan="1" colspan="1"> <p>—</p> </td></tr></tbody></table>Methods
Species
The Dryopteris genus includes many polyploids and is distributed throughout North America (Sessa et al., 2012). We collected frond tissue during sporulation from fern sporophytes growing in the understories of mesic forested regions in the following three locations:
- D. expansa* from Kincaid Park in Anchorage Alaska (61.154, -150.062), * D. campyloptera * from Smugglers Notch in Cambridge Vermont (44.543, -72.787), and *D. intermedia * from North Point Nature Preserve in Charlevoix Michigan (45.338, -85.248). Dryopteris expansa and Dryopteris campyloptera were found in monotypic stands, while Dryopteris intermedia grew with other fern genera.
Treatment
Spores from all three groups of species were sown on agar plates. Once they grew into mature gametophytes under low light levels (10-20 PAR), we took a clump of gametophytes 1 cm in diameter and placed them in weigh boats with moist soil. To understand initial fern physiological health, we measured the fv/fm using a PAM-2500 Chlorophyll Fluorometer (Walz Photosynthesis Instruments, Effeltrich, Germany). Used as a standard plant health indicator, fv/fm is a ratio of the minimum and maximum fluorescence emitted by the photosystem II (PSII) of plants, enabling the assessment of light absorption ability and efficiency by plants (Mohammed et al., 2003; Murchie and Lawson, 2013; Wu et al., 2023). This measurement reflects the plant’s photosynthetic health and resilience, with higher fv/fm scores indicating low stress and high efficiency, and lower fv/fm scores indicating high stress and low efficiency.
Weigh boats were then separated into different containers, each containing different relative humidity conditions simulated using the saturated salt method (Watkins et al., 2007a; Rockland, 1960): (1) 100% relative humidity (i.e., high relative humidity) or (2) 85% relative humidity (i.e., low relative humidity; Ψ = -22.2 MPa for 22 degrees; Ψ = -22.5 for 27 degrees). We then placed the species into the growth chamber (Conviron GEN1000) at either 22° C (i.e., cool temperature) or 27° C (i.e., warm temperature). The conditions reflected the four following tests: (1) 100% relative humidity at 22° C (n=30); (2) 100% relative humidity at 27° C (n=39); (3) 85% relative humidity at 22° C (n=30); (4) 85% relative humidity at 27° C (n=39). All of these were kept in their respective treatments in the dark for two days, with temperatures dropping 5° C for 12 hours each night. In situ , gametophytes often grow under dense leaf litter, which impedes light penetration. Light can be an additional stressor, so gametophytes were kept in the dark, following previously published experimental protocols (Chambers et al., 2017). After 48 hours, we removed the species from the growth chamber and took fluorescence measurements to obtain their post-treatment fv/fm value. Groups undergoing a recovery phase were placed into the growth chamber for an additional 72 hours in the control treatment condition – 100% relative humidity and 22° C. After 72 hours of recovery, we took their fv/fm values in order to compare health from before and after recovery (n= 69).
Data Analysis Software
The statistical analysis and visualization performed in this experiment were done using the R Project programming software (R version 4.4.0; RStudio version 2024.04.1+748; R Core Team, 2025). The packages used in R included: lme4 (Bates et al., 2015), emmeans (Lenth et al., 2025), dplyr (Wickham et al., 2025), and ggplot2 (Wickham, 2016).
We built a linear mixed model to evaluate the impact of the experimental treatment on stress levels (fv/fm). Predictors included two 3-way interactions, SpeciesTimeTemperature, SpeciesTemperatureRelative humidity, and all nested lower-order interactions, with a random effect for individual to account for repeated measures. Model selection was based on the lowest BIC, with non-significant terms removed until BIC worsened. Relative humidity was not significant and worsened the model fit, therefore it was removed from the model. The final model contained a 3-way interaction between Temperature, all lower-order nested terms, and maintained the random effect of the individual.
The graphs were created on R using the package ggplot2. Figure 1a was created through the online design tool Canva.com.
The reference list from the paper itself. Each links out to its DOI / PubMed record.
- 1Bates Douglas Mächler Martin Bolker Ben Walker Steve 2015 Fitting Linear Mixed-Effects Models Using lme 4 Journal of Statistical Software 6711548-766010.18637/jss.v 067.i 01 · doi ↗
- 2Blake‐Mahmud Jennifer Sessa Emily B. Visger Clayton J. Watkins James E. 2024724 Polyploidy and environmental stress response: a comparative study of fern gametophytes New Phytologist 24520028-646X 88589810.1111/nph.1996939044655 · doi ↗ · pubmed ↗
- 3Chambers Sally M. Watkins J. E. Sessa Emily B. 201741 Differences in dehydration tolerance among populations of a gametophyte‐only fern American Journal of Botany 10440002-912259860710.3732/ajb.160027928400414 · doi ↗ · pubmed ↗
- 4Fox Donald T. Soltis Douglas E. Soltis Pamela S. Ashman Tia-Lynn Van de Peer Yves 202091 Polyploidy: A Biological Force From Cells to Ecosystems Trends in Cell Biology 3090962-892468869410.1016/j.tcb.2020.06.00632646579 PMC 7484144 · doi ↗ · pubmed ↗
- 5Gould Rachelle Mooney Harold Nelson Laura Shallenberger Robert Daily Gretchen 2013320 Restoring Native Forest Understory: The Influence of Ferns and Light in a Hawaiian Experiment Sustainability 532071-10501317133910.3390/su 5031317 · doi ↗
- 6Haufler Christopher H. Pryer Kathleen M. Schuettpelz Eric Sessa Emily B. Farrar Donald R. Moran Robbin Schneller J. Jakob Watkins James E. Windham Michael D. 2016921 Sex and the Single Gametophyte: Revising the Homosporous Vascular Plant Life Cycle in Light of Contemporary Research Bio Science 66110006-356892893710.1093/biosci/biw 108 · doi ↗
- 7Heslop-Harrison J S (Pat) Schwarzacher Trude Liu Qing 20221025 Polyploidy: its consequences and enabling role in plant diversification and evolution Annals of Botany 13110305-736411010.1093/aob/mcac 132PMC 990434436282971 · doi ↗ · pubmed ↗
- 8Krieg Christopher P. Chambers Sally M. 202231 The ecology and physiology of fern gametophytes: A methodological synthesis Applications in Plant Sciences 1022168-045010.1002/aps 3.11464 PMC 903979735495196 · doi ↗ · pubmed ↗