Visual analytics framework for survival analysis and biomarker discovery from gene expression data
Jaka Kokošar, Cagatay Turkay, Luka Ausec, Miha Štajdohar, Blaž Zupan, Diego Forero, Diego Forero, Diego Forero

TL;DR
This paper introduces a user-friendly visual analytics framework for survival analysis and biomarker discovery from gene expression data, making it easier for biomedical researchers to explore and analyze patient survival rates.
Contribution
The paper presents a modular, visual analytics framework for survival analysis that supports exploratory and hypothesis-driven biomarker discovery without requiring programming expertise.
Findings
The framework defines a minimal set of reusable visualization and modeling components for common survival analysis tasks.
Interactive visualizations enable the discovery of survival cohorts and their characteristic features.
The methodology was implemented as an open-source add-on to Orange Data Mining and validated through cancer research case studies.
Abstract
We introduce a visual analytics methodology for survival analysis, and propose a framework that defines a reusable set of visualization and modeling components to support exploratory and hypothesis-driven biomarker discovery. Survival analysis—essential in biomedicine—evaluates patients‘ survival rates and the onset of medically relevant events, given their clinical and genetic profiles and genetic predispositions. Existing approaches often require programming expertise or rely on inflexible analysis pipelines, limiting their usability among biomedical researchers. The lack of advanced, user-friendly tools hinders problem solving, limits accessibility for biomedical researchers, and restricts interactive data exploration. Our methodology emphasizes functionality-driven design and modularity, akin to combining LEGO bricks to build tailored visual workflows. We (1) define a minimal set of…
Genes, proteins, chemicals, diseases, species, mutations and cell lines named across the full text — each resolved to its canonical identifier and authoritative record.
Click any figure to enlarge with its caption.
 Figure 1
 Figure 2
 Figure 3
 Figure 4
 Figure 5
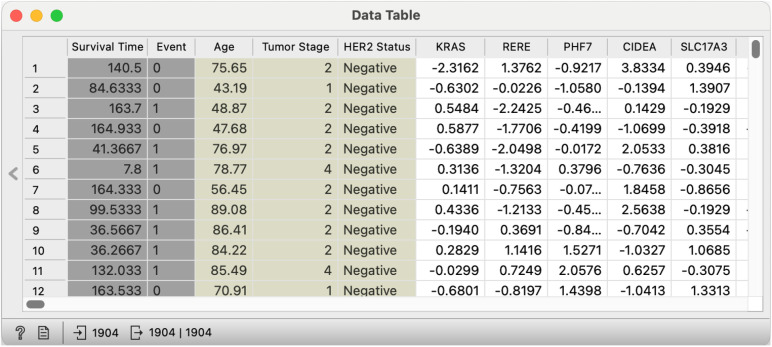 Figure 6
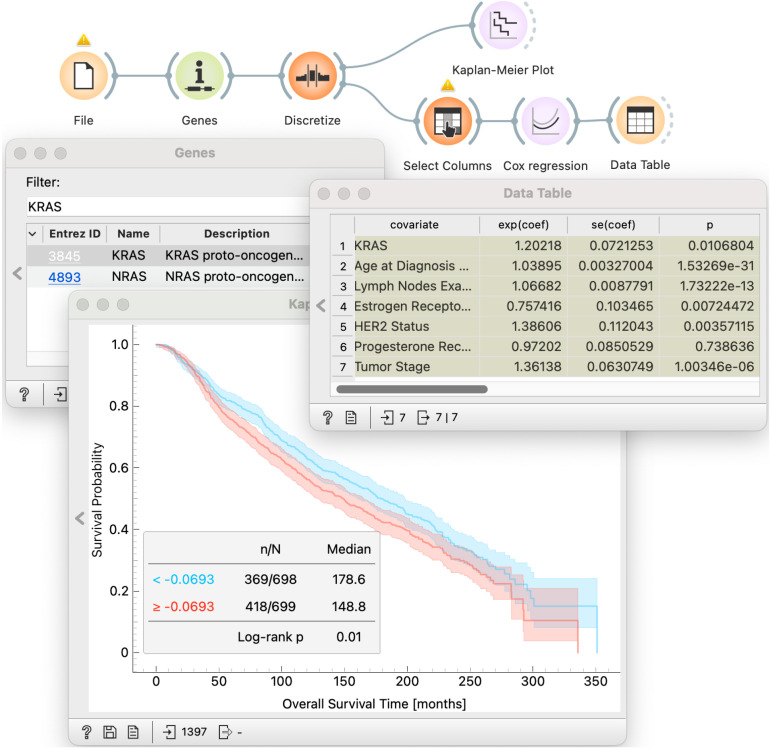 Figure 7
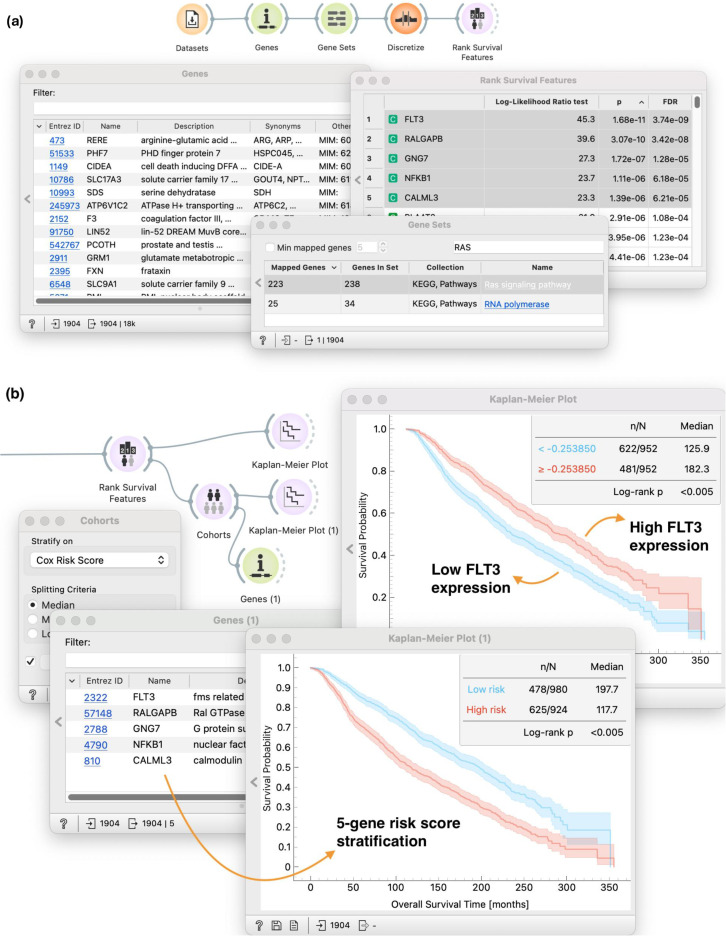 Figure 8
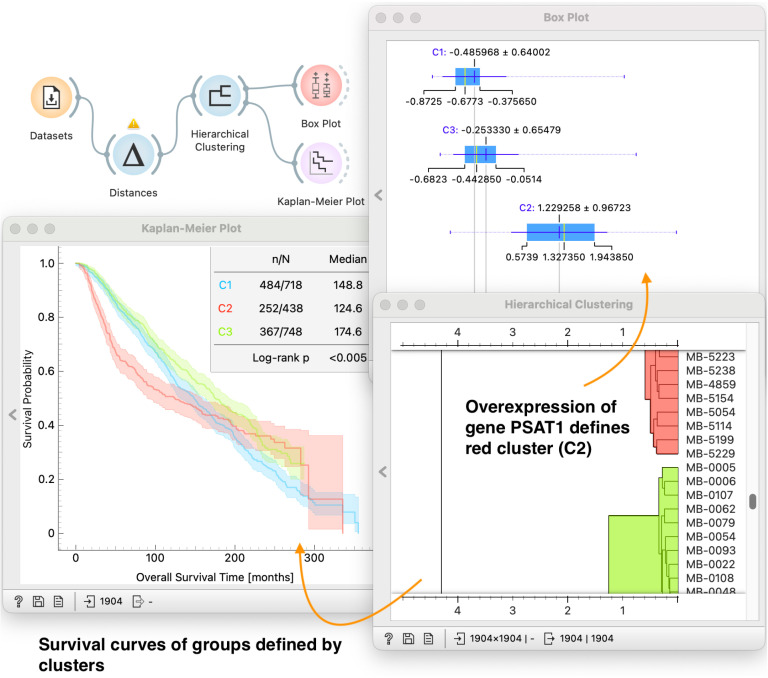 Figure 9
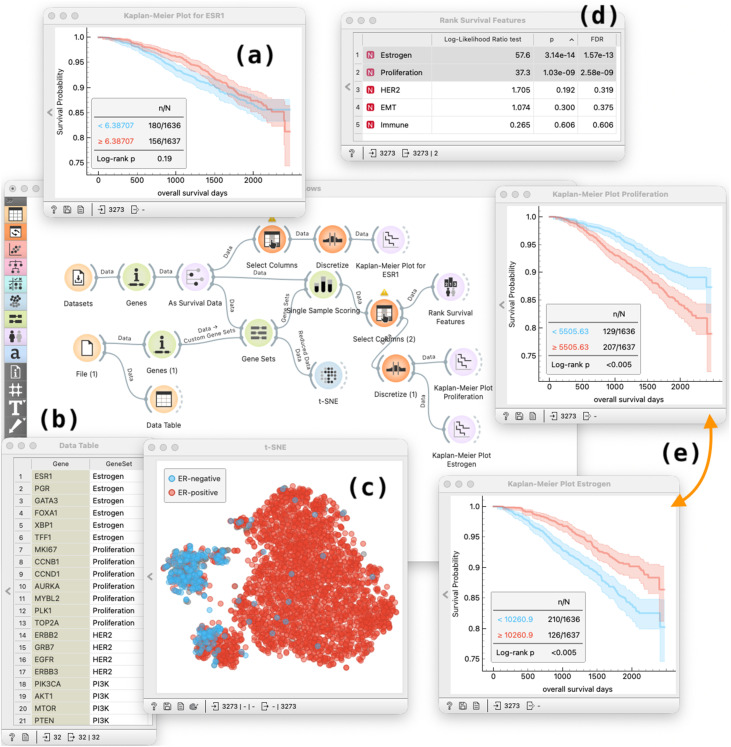 Figure 10
Peer Reviews
No public reviews on file for this paper yet. If you reviewed it on a platform where reviews are public (OpenReview, ICLR, NeurIPS, ICML), you can paste yours below so the community can read it here.
Videos
No videos yet. Explain this paper in a talk, walkthrough, or lecture? Add one.
Taxonomy
TopicsData Visualization and Analytics · Topological and Geometric Data Analysis · Data Analysis with R