Association between TyG-related indices and in-hospital acute heart failure in patients with acute myocardial infarction after emergency percutaneous coronary intervention
Rong Feng, Lingling Hu, Ying Zhu, Xun Liang, Tao Tao, Wenjie Li

TL;DR
This study finds that higher triglyceride-glucose (TyG) indices are linked to increased risk of acute heart failure in patients who had a heart attack and emergency heart procedure.
Contribution
The study identifies TyG-related indices, particularly TyG-WHtR, as novel predictors of acute heart failure risk after emergency PCI in AMI patients.
Findings
TyG-related indices like TyG-WHtR are significantly associated with increased risk of acute heart failure (AHF) in hospitalized AMI patients.
TyG-WHtR showed strong predictive performance with an AUC of 0.759 for in-hospital AHF.
Higher quartiles of TyG-related indices were consistently linked to increased AHF risk across all models.
Abstract
Acute heart failure (AHF) may still occur during hospitalization in some patients with acute myocardial infarction (AMI) after emergency percutaneous coronary intervention (PCI). Triglyceride-glucose (TyG)-related indices are useful markers for evaluating insulin resistance. However, the association between TyG-related indices and in-hospital AHF in AMI patients following emergency PCI remains incompletely understood. The present study aimed to investigate the relationship between TyG-related indices and in-hospital AHF in these patients, with the goal of providing potential clinical evidence for the early identification and management of high-risk individuals. This retrospective study enrolled patients with AMI who underwent emergency PCI at our hospital from January 2023 to December 2025. LASSO regression analysis was applied to screen relevant variables. Logistic regression,…
Genes, proteins, chemicals, diseases, species, mutations and cell lines named across the full text — each resolved to its canonical identifier and authoritative record.
Click any figure to enlarge with its caption.
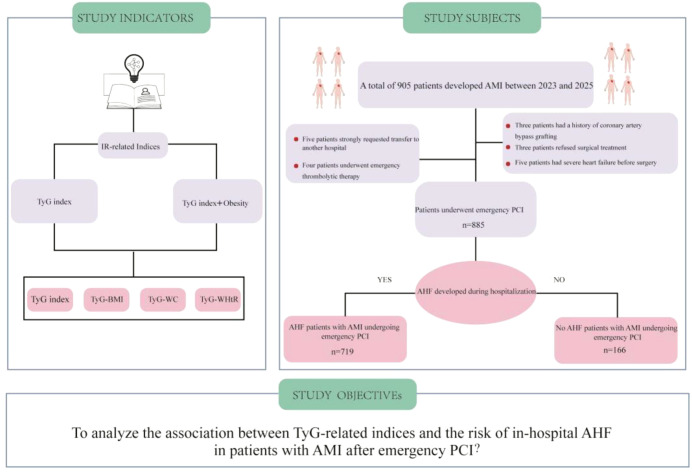 Figure 1
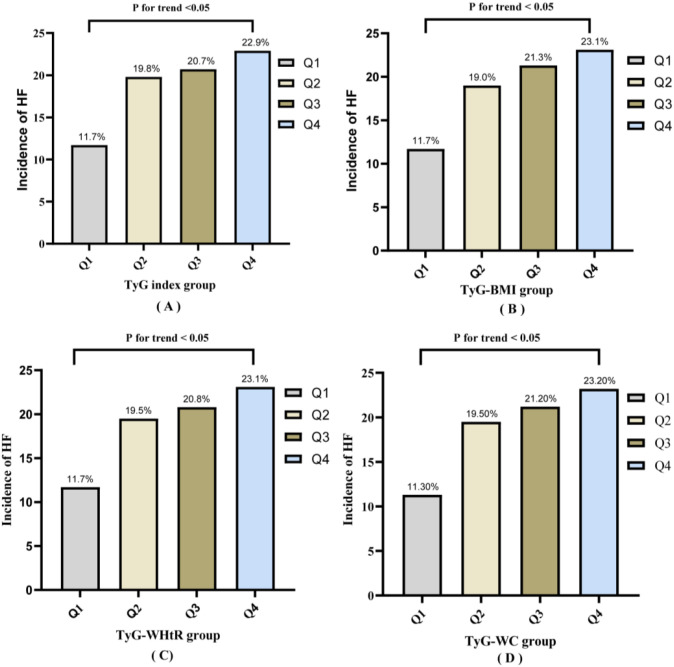 Figure 2
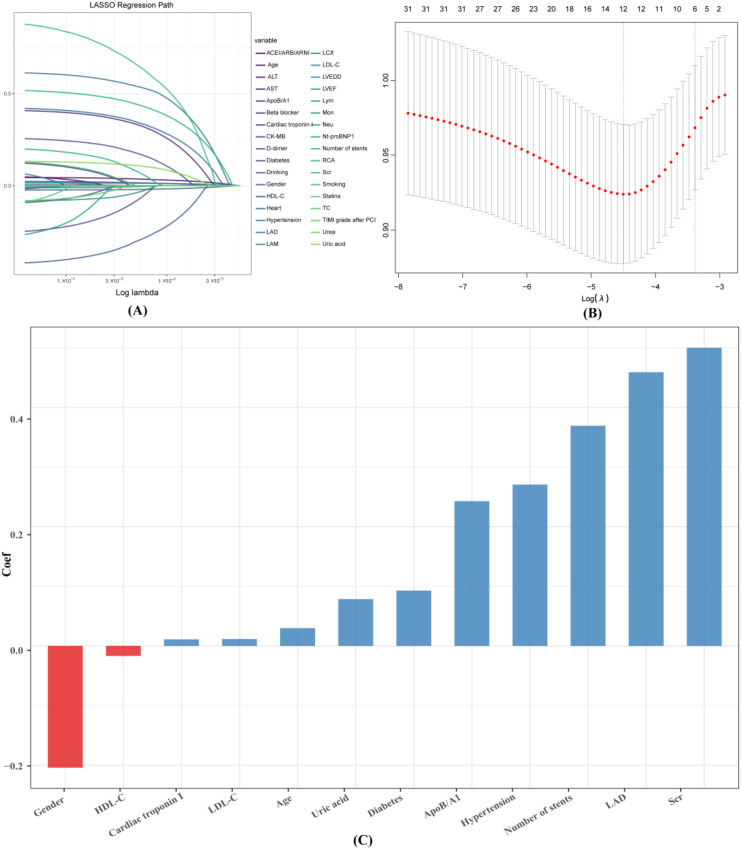 Figure 3
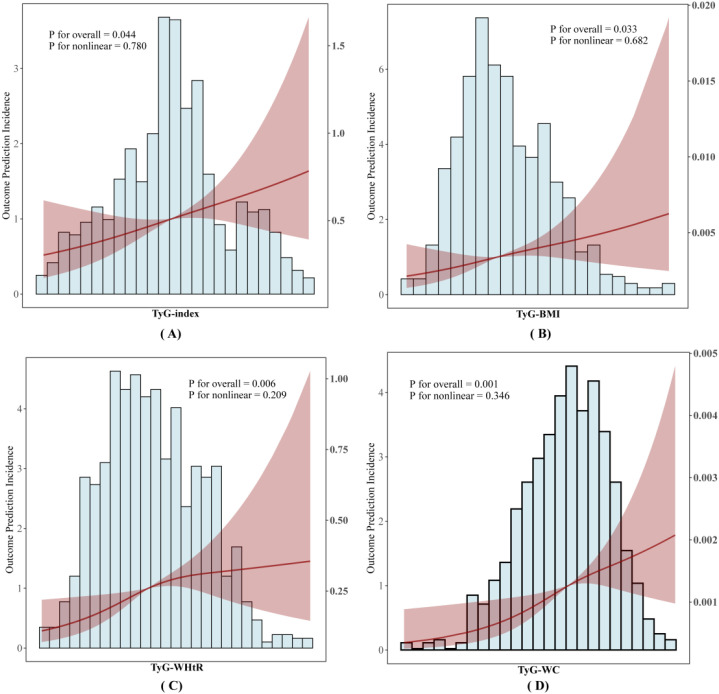 Figure 4
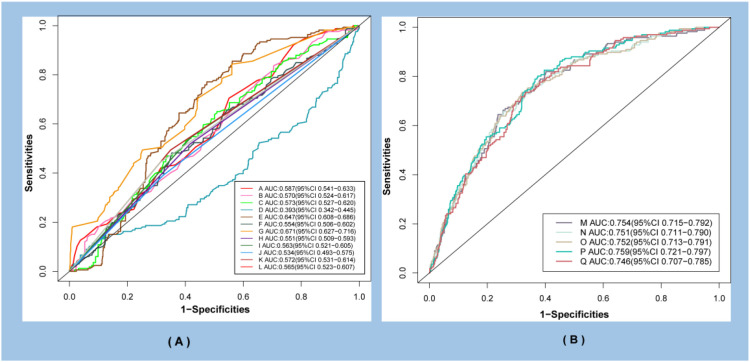 Figure 5
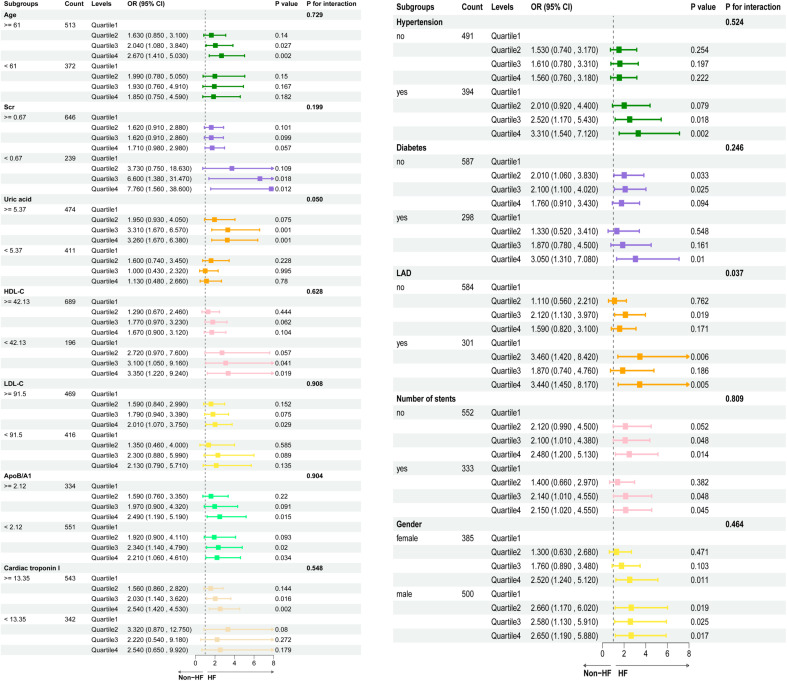 Figure 6
| Characteristic | Overall | Non-AHF | AHF | p-value |
|---|---|---|---|---|
| Age (years), Median (IQR) | 63.00 (57.00, 69.00) | 62.00 (56.00, 68.00) | 64.00 (59.00, 71.00) | <0.001 |
| BMI (kg/m2), Median (IQR) | 23.57 (22.30, 25.34) | 23.44 (22.15, 25.34) | 23.98 (22.66, 25.63) | 0.013 |
| Height(m), Median (IQR) | 1.67 (1.63, 1.72) | 1.67 (1.63, 1.72) | 1.68 (1.64, 1.73) | 0.27 |
| WHtR, Median (IQR) | 0.40 (0.37, 0.43) | 0.40 (0.37, 0.43) | 0.41 (0.38, 0.43) | 0.02 |
| Urea (mg/dL), Median (IQR) | 5.70 (4.70, 6.70) | 5.70 (4.70, 6.67) | 6.10 (4.80, 6.90) | 0.035 |
| Scr (mg/dL), Median (IQR) | 0.77 (0.66, 0.87) | 0.77 (0.66, 0.86) | 0.78 (0.71, 0.89) | 0.005 |
| UA(mg/dL), Median (IQR) | 5.49 (4.38, 6.38) | 5.43 (4.30, 6.30) | 5.78 (4.88, 6.62) | 0.003 |
| Neu, Median (IQR) | 4.04 (3.07, 5.17) | 4.04 (3.06, 5.17) | 4.07 (3.40, 5.11) | 0.21 |
| Lym, Median (IQR) | 1.73 (1.38, 2.16) | 1.73 (1.36, 2.16) | 1.75 (1.44, 2.15) | 0.75 |
| Mon, Median (IQR) | 0.48 (0.39,0.57) | 0.48 (0.38, 0.57) | 0.49 (0.42, 0.56) | 0.17 |
| WC (cm), Median (IQR) | 95.00 (90.00, 101.00) | 95.00 (89.00, 100.00) | 96.00 (91.00, 102.00) | 0.004 |
| FPG (mg/dl), Median (IQR) | 100.80 (88.20, 122.40) | 99.00 (87.20, 121.80) | 107.50 (91.80, 125.40) | 0.003 |
| TyG-BMI, Median (IQR) | 205.41 (193.85, 222.72) | 204.40 (193.15, 221.46) | 209.76 (198.49, 229.73) | 0.001 |
| TyG index, Median (IQR) | 8.74 (8.55, 8.90) | 8.74 (8.53, 8.89) | 8.78 (8.65, 8.98) | 0.006 |
| TyG-WHtR, Median (IQR) | 3.47 (3.23, 3.76) | 3.44 (3.22, 3.74) | 3.56 (3.32, 3.83) | 0.001 |
| TyG-WC, Median (IQR) | 834.20 (779.45, 886.00) | 831.29 (772.20, 882.74) | 848.06 (811.68, 901.25) | <0.001 |
| TC (mg/dl), Median (IQR) | 175.29 (155.28, 220.65) | 173.74 (153.52, 223.95) | 192.00 (167.77, 211.97) | 0.037 |
| TG (mg/dl), Median (IQR) | 124.40 (100.96, 145.99) | 123.43 (99.17, 145.96) | 127.41 (108.02, 148.18) | 0.029 |
| HDL-C (mg/dl), Median (IQR) | 50.55 (42.54, 62.48) | 51.82 (43.31, 63.03) | 45.57 (38.28, 55.32) | <0.001 |
| LDL-C (mg/dl), Median (IQR) | 93.42 (78.89, 105.57) | 90.87 (76.18, 104.41) | 98.92 (92.31, 108.01) | <0.001 |
| ApoB/A1, Median (IQR) | 1.88 (1.51, 2.43) | 1.86 (1.48, 2.39) | 2.03 (1.59, 2.53) | 0.031 |
| AST (U/L), Median (IQR) | 20.00 (18.00, 25.00) | 20.00 (18.00, 25.00) | 21.00 (17.00, 26.00) | 0.97 |
| ALT (U/L), Median (IQR) | 21.00 (15.00, 28.00) | 21.00 (16.00, 28.00) | 21.50 (15.00, 31.00) | 0.5 |
| LVEDD (cm), Median (IQR) | 47.00 (45.00, 50.00) | 47.00 (45.00, 50.00) | 47.50 (44.00, 49.00) | 0.67 |
| LVEF (%), Median (IQR) | 62.00 (58.00, 66.00) | 62.00 (58.00, 66.00) | 62.00 (58.00, 65.00) | 0.24 |
| Cardiac troponin I(ng/l), Median (IQR) | 14.40 (13.20, 16.60) | 14.40 (13.10, 16.00) | 15.80 (14.40, 20.70) | <0.001 |
| Heart, Median (IQR) | 77.00 (68.00, 85.00) | 77.00 (69.00, 85.00) | 78.00 (68.00, 85.00) | 0.89 |
| Gender, n (%) | 0.017 | |||
| Female | 385 (44) | 299 (42) | 86 (52) | |
| Male | 500 (56) | 420 (58) | 80 (48) | |
| ACEI/ARB/ARNI, n (%) | 745 (84) | 604 (84) | 141 (85) | 0.77 |
| Statins, n (%) | 880 (99) | 715 (99) | 165 (99) | 1.00 |
| Beta blocker, n (%) | 778 (88) | 632 (88) | 146 (88) | 0.99 |
| Antiplatelet agent, n (%) | 885 (100) | 719 (100) | 166 (100) | 1.00 |
| Hypertension, n (%) | 394 (45) | 303 (42) | 91 (55) | 0.003 |
| Smoking, n (%) | 386 (44) | 313 (44) | 73 (44) | 0.92 |
| Drinking, n (%) | 180 (20) | 149 (21) | 31 (19) | 0.55 |
| RCA, n (%) | 391 (44) | 326 (45) | 65 (39) | 0.15 |
| LAD, n (%) | 301 (34) | 227 (32) | 74 (45) | 0.001 |
| LCX, n (%) | 189 (21) | 162 (23) | 27 (16) | 0.076 |
| LAM, n (%) | 5 (0.6) | 4 (0.6) | 1 (0.6) | 1.00 |
| Nt-proBNP, n (%) | 558 (63) | 447 (62) | 111 (67) | 0.26 |
| D-dimer, n (%) | 405 (46) | 325 (45) | 80 (48) | 0.49 |
| Number of stents, n (%) | ||||
| ≤1 | 333 (38) | 251 (35) | 82 (49) | <0.001 |
| >1 | 552 (62) | 468 (65) | 84 (51) | |
| Characteristic | Model 1 | Model 2 | Model 3 | Model 4 | ||||
|---|---|---|---|---|---|---|---|---|
| OR (95%CI) | OR (95%CI) | OR (95%CI) | OR (95%CI) | |||||
| TyG index | 2.56(1.42,4.64) | <0.01 | 2.58(1.43,4.72) | <0.01 | 2.29(1.22,4.11) | <0.01 | 2.21(1.19,4.14) | <0.01 |
| Quartile | ||||||||
| Q1 | 1 (Reference) | 1 (Reference) | 1 (Reference) | 1 (Reference) | ||||
| Q2 | 1.87(1.11,3.17) | <0.05 | 2.10(1.24,3.62) | <0.05 | 2.14(1.24,3.75) | <0.05 | 2.00(1.15,3.53) | <0.05 |
| Q3 | 1.98(1.75,3.38) | <0.01 | 2.20(1.30,3.78) | <0.01 | 2.37(1.38,4.15) | <0.01 | 2.26(1.31,3.99) | <0.01 |
| Q4 | 2.26(1.35,3.78) | <0.01 | 2.32(1.38,3.96) | <0.01 | 2.06(1.20,3.58) | <0.01 | 2.04(1.18,3.58) | <0.01 |
| P for trend | <0.01 | <0.01 | <0.05 | <0.05 | ||||
| TyG-BMI | 1.01(1.00,1.02) | <0.01 | 1.02(1.01,1.02) | <0.01 | 1.01(1.00,1.02) | <0.01 | 1.01(1.00,1.02) | <0.01 |
| Quartile | ||||||||
| Q1 | 1 (Reference) | 1 (Reference) | 1 (Reference) | 1 (Reference) | ||||
| Q2 | 1.77(1.04,3.00) | <0.05 | 1.72(1.01,2.97) | <0.05 | 1.58(0.92,2.77) | <0.05 | 1.51(0.87,2.67) | <0.05 |
| Q3 | 2.04(1.21,3.43) | <0.01 | 2.05(1.22,3.53) | <0.01 | 2.04(1.19,3.55) | <0.01 | 2.10(1.22,3.69) | <0.01 |
| Q4 | 2.26(1.35,3.79) | <0.01 | 2.52(1.50,4.34) | <0.01 | 2.23(1.30,3.87) | <0.01 | 2.13(1.24,3.74) | <0.01 |
| P for trend | <0.01 | <0.01 | <0.01 | <0.01 | ||||
| TyG-WC | 1.01(1.00,1.01) | <0.01 | 1.01(1.00,1.01) | <0.01 | 1.01(1.00,1.01) | <0.01 | 1.01(1.00,1.01) | <0.01 |
| Quartile | ||||||||
| Q1 | 1 (Reference) | 1 (Reference) | 1 (Reference) | 1 (Reference) | ||||
| Q2 | 1.90(1.12,3.24) | <0.05 | 2.00(1.17,3.49) | <0.05 | 1.54(0.88,2.76) | <0.05 | 1.42(0.80,2.56) | <0.05 |
| Q3 | 2.12(1.25,3.58) | <0.01 | 2.31(1.36,4.01) | <0.01 | 1.92(1.10,3.39) | <0.01 | 1.82(1.04,3.24) | <0.01 |
| Q4 | 2.38(1.41,4.00) | <0.01 | 2.52(1.49,4.36) | <0.01 | 2.21(1.27,3.92) | <0.01 | 1.99(1.14,3.54) | <0.01 |
| P for trend | <0.01 | <0.01 | <0.01 | <0.01 | ||||
| TyG-WHtR | 2.18(1.35,3.54) | <0.01 | 2.79(1.67,4.68) | <0.01 | 2.40(1.43,4.08) | <0.01 | 2.29(1.35,3.91) | <0.01 |
| Quartile | ||||||||
| Q1 | 1 (Reference) | 1 (Reference) | 1 (Reference) | 1 (Reference) | ||||
| Q2 | 1.82(1.08,3.12) | <0.05 | 1.69(0.99,2.91) | <0.05 | 1.64(0.95,2.86) | <0.05 | 1.59(0.92,2.80) | <0.05 |
| Q3 | 1.98(1.18,3.37) | <0.01 | 2.04(1.21,3.50) | <0.01 | 2.02(1.18,3.52) | <0.01 | 1.96(1.14,3.44) | <0.01 |
| Q4 | 2.26(1.36,3.83) | <0.01 | 2.67(1.59,4.65) | <0.01 | 2.37(1.39,4.16) | <0.01 | 2.29(1.32,4.04) | <0.01 |
| P for trend | <0.01 | <0.01 | <0.01 | <0.01 | ||||
| Variables | Age | Scr | Uric acid | HDL-C | LDL-C | ApoB/A1 | Cardiac troponin I |
|---|---|---|---|---|---|---|---|
| Area under the curve | 0.587 | 0.570 | 0.573 | 0.393 | 0.647 | 0.554 | 0.691 |
| Youden indices | 0.170 | 0.165 | 0.183 | 0.127 | 0.179 | 0.191 | 0.169 |
| Optimal cut-off values | 60.5 | 0.665 | 5.37 | 55.82 | 91.5 | 2.12 | 13.35 |
Peer Reviews
No public reviews on file for this paper yet. If you reviewed it on a platform where reviews are public (OpenReview, ICLR, NeurIPS, ICML), you can paste yours below so the community can read it here.
Videos
No videos yet. Explain this paper in a talk, walkthrough, or lecture? Add one.
Taxonomy
TopicsHyperglycemia and glycemic control in critically ill and hospitalized patients · Cardiovascular Function and Risk Factors · Diabetes Treatment and Management
Introduction
Acute myocardial infarction (AMI) is a common and leading cause of heart failure (HF) (1). Percutaneous coronary intervention (PCI) represents the first-line therapeutic strategy for patients with AMI (2). However, clinical practice has demonstrated that acute heart failure (AHF) still develops in a proportion of AMI patients following emergency PCI. Without timely intervention and appropriate management, this complication significantly prolongs hospital stay and increases the risk of mortality in affected patients (3). Therefore, identifying predictive biomarkers for AHF risk in this population is critical for the early prevention and optimized management of this condition.
Insulin resistance (IR) is characterized by diminished tissue sensitivity to insulin, resulting in impaired glucose uptake into cells (4). Accumulating evidence has indicated that IR contributes to the development of heart failure (HF) by disrupting cardiomyocyte structure and function (5, 6). The hyperinsulinemic-euglycemic clamp is currently recognized as the gold standard for the diagnosis of IR (7). Nevertheless, its clinical utility is restricted by complicated procedures and high costs. In contrast, the TyG index and its related composite indices have been proposed as reliable surrogate markers of IR, owing to their simplicity in calculation and ready availability in routine clinical practice (8).
Obesity has now become a major public health concern and is closely associated with IR and metabolic disorders in the human body (9, 10). Recent studies have indicated that the TyG index is closely associated with adverse outcomes in patients with HF and can serve as a predictive marker for 30-day and 1-year all-cause mortality risk in this patient population (11). Furthermore, a prospective study involving 7335 participants demonstrated that TyG-Body Mass Index (TyG-BMI), TyG-Waist-to-Height Ratio (TyG-WHtR) and TyG-waist circumference indices (TyG-WC) were significantly associated with the risk of HF during a median follow-up period of 2.97 years (12).
However, no studies have yet investigated the association between the TyG index and its related indices and the risk of in-hospital AHF in patients with AMI who have undergone emergency PCI. This study aimed to characterize and analyze the correlations of the TyG index, TyG-BMI, TyG-WC and TyG-WHtR with the risk of AHF in patients with AMI following emergency PCI.
Materials and methods
Data source and study population
This study retrospectively analyzed patients with AMI who underwent emergency PCI at Shehong People’s Hospital from January 2023 to December 2025. Inclusion criteria were: (1) Patients aged ≥18 years; (2) Patients diagnosed with AMI in accordance with the 2025 American Guidelines for Percutaneous Coronary Intervention and willing to undergo emergency PCI (13); Exclusion criteria included: (1) Patients with a history of coronary artery bypass grafting; (2) Patients with severe HF unable to lie flat; (3) Patients who refused coronary angiography or primary PCI; (4) Patients who had received emergency thrombolytic therapy before surgery; (5) Patients who strongly requested transfer to another hospital. Ultimately, 885 patients who met the inclusion and exclusion criteria were enrolled in the study (Figure 1). This study was approved by the Ethics Committee of Shehong People’s Hospital (2025-Shen 51). Given that this was a retrospective study involving identifiable patient identity data and intervention measures, the requirement for informed consent was waived upon application to the hospital.
The patient flow chart.
Definitions and calculation of related variables
Acute heart failure (AHF) was defined as the rapid onset or acute exacerbation of signs and symptoms of heart failure, accompanied by elevated plasma natriuretic peptide concentrations, a condition that is often life-threatening. Its clinical manifestations comprise a spectrum of signs and symptoms dominated by pulmonary congestion, systemic congestion, and hypoperfusion of tissues and organs. The diagnostic threshold for N-terminal pro-B-type natriuretic peptide (NT-proBNP) was set at ≥300 pg/mL. Diagnosis of AHF was guided by age-stratified thresholds, combined with clinical features including chest tightness, shortness of breath, and signs of pulmonary and systemic congestion: <55 years: NT-proBNP >450 pg/mL; 55–75 years: NT-proBNP >900 pg/mL; >75 years: NT-proBNP >1800 pg/mL (14). NT-proBNP was measured before PCI to exclude patients with pre-existing AHF. Following PCI, NT-proBNP was assayed immediately in patients who developed the aforementioned symptoms during hospitalization to establish a diagnosis of AHF.
Diabetes mellitus was defined as a history of previous diabetes mellitus, or fasting plasma glucose (FPG) ≥7.0 mmol/L after admission, or random plasma glucose ≥11.1 mmol/L, or 2-hour plasma glucose level ≥11.1 mmol/L in a 75-gram oral glucose tolerance test, or glycated hemoglobin ≥6.5% (15).
Smoking history was defined as smoking at least one cigarette per day for a continuous or cumulative period of 6 months or more (16).
Drinking was defined as drinking at least once a week for a continuous or cumulative period of 6 months or more (17).
Fasting blood glucose, blood lipids and other laboratory results were collected from patients immediately upon hospital admission, along with anthropometric parameters including height, body weight and waist circumference. The TyG index, TyG-BMI, TyG-WC and TyG-WHtR were then calculated using the corresponding formulas (18).
Data collection
All laboratory tests were completed within 30 minutes of emergency admission, using peripheral venous blood specimens, and were performed by the Department of Laboratory Medicine of our hospital. Echocardiography was conducted within 24 hours during hospitalization after PCI and was performed by the Echocardiography Department of our hospital.Clinical information of patients was retrieved from the hospital electronic medical record system, including demographic data, clinical characteristics, laboratory parameters, echocardiographic indices, surgery-related metrics and anthropometric measurements. Demographic data comprised age, gender, heart rate, smoking history and drinking history. Clinical characteristics included a history of hypertension and diabetes mellitus. Oral medications taken by patients involved antiplatelet, antihypertensive and lipid-lowering agents. Laboratory parameters consisted of neutrophil count (Neu), lymphocyte count (Lym), monocyte count (Mon), alanine aminotransferase (ALT), aspartate aminotransferase (AST), total cholesterol (TC), triglyceride (TG), low-density lipoprotein cholesterol (LDL-C), high-density lipoprotein cholesterol (HDL-C), apolipoprotein B to apolipoprotein A1 ratio (ApoB/A1), serum creatinine (Scr), serum uric acid(UA), serum urea, fasting blood glucose (FBG), cardiac troponin I, and NT⁃proBNP. Echocardiographic indices included left ventricular ejection fraction (LVEF) and left ventricular end-diastolic diameter (LVEDD). Anthropometric measurements included height, body weight and WC. Surgery-related metrics involved the type of culprit vessel (right coronary artery [RCA], left anterior descending artery [LAD], left circumflex artery [LCX], left marginal artery [LAM]) and the number of stents implanted.
Statistical analysis
Statistical analyses were performed on the data using SPSS version 27.0 (IBM Corporation, Chicago, Illinois, USA) and R software version 4.6.7 (R Foundation for Statistical Computing, Vienna, Austria). Continuous variables were expressed as mean ± standard deviation (SD) or median (interquartile range, IQR). Intergroup differences in normally distributed data were analyzed using the t-test or one-way analysis of variance (ANOVA), while those in non-normally distributed data were examined via the Mann-Whitney U test. Categorical variables were presented as counts and percentages, with intergroup comparisons conducted using the chi-square test or Fisher’s exact test. Relevant variables were screened by least absolute shrinkage and selection operator (LASSO) regression for subsequent inclusion in logistic regression analyses. Logistic regression models were applied to estimate the odds ratios (ORs) and 95% confidence intervals (CIs) for the association between changes in TyG-related indices and the incidence of AHF, and four multivariable models were constructed accordingly. Restricted cubic spline (RCS) regression was used to assess the relationship between TyG-related indices and AHF. Receiver operating characteristic (ROC) curves were generated to calculate the corresponding area under the curve (AUC) and the optimal cut-off values for each variable. Continuous variables were converted into categorical variables based on these optimal cut-off values for subgroup analyses, which were conducted to further evaluate the association between TyG-related indices and AHF; forest plots were plotted for visualization of the results. A two-tailed P value < 0.05 was considered statistically significant.
Results
Baseline characteristics
A total of 885 patients were enrolled in the study, with a mean age of 62.5 years; 18.8% of them were diagnosed with AHF, and 52% of the total study population were female. The results showed that the TyG index, TyG-BMI, TyG-WHtR, and TyG-WC in patients with AHF were significantly higher than those in subjects without AHF (P < 0.01). AHF was more likely to occur in female patients, older individuals, and those with lower HDL-C levels, higher levels of urea, Scr, UA, BMI, WC, WHtR, FBG, TC, TG, LDL-C, and ApoB/A1, as well as higher cardiac troponin I levels. Additionally, AHF was more prevalent in patients whose culprit vessel was the LAD and those with a larger number of implanted stents (Table 1).
Clinical outcome
As shown in Figure 2, patients were stratified by quartiles of the TyG index, TyG-BMI, TyG-WHtR and TyG-WC, with a significant increase in the risk of AHF observed as quartile categories rose (all P for rend < 0.05). To explore the potential effects of the TyG index and its related indicators at different levels, patients were stratified into four groups according to the quartile values of the TyG index, TyG-WC, TyG-WHtR and TyG-BMI, respectively. For descriptive convenience, these groups were designated as the first (Q1), second (Q2), third (Q3) and fourth (Q4) quartiles, with the Q1 group serving as the reference category. Among the four indicators, the TyG index was associated with the mildest elevation in AHF risk: the incidence of AHF was 11.7% in the Q1, 19.8% in the Q2, 20.70% in the Q3, and 22.90% in the Q4. In contrast, TyG-WC exhibited the most pronounced increase in AHF risk, with the incidence of AHF being 11.3% in the Q1 group, 19.5% in the Q2 group, 21.20% in the Q3 group, and 23.20% in the Q4 group.
Incidence of AHF stratified by quartiles of the TyG index, TyG-WC, TyG-WHtR, and TyG-BMI. (A) Incidence of AHF by quartiles of the TyG index; (B) Incidence of AHF by quartiles of the TyG-BMI index; (C) Incidence of AHF by quartiles of the TyG-WHtR index; (D) Incidence of AHF by quartiles of the TyG-WC index.
Screening of relevant variables
To address and mitigate multicollinearity among metabolic and lipid-related variables, this study employed LASSO regression for variable selection. A key advantage of LASSO regression is its ability to automatically identify predictive variables from high-dimensional datasets with multicollinearity, thereby reducing overfitting. Variables with non-zero coefficients identified by LASSO were subsequently included in conventional multivariate logistic regression. This step was designed to derive interpretable regression coefficients (odds ratios, ORs) and corresponding 95% confidence intervals (CIs), facilitating clinical interpretation and practical application. The LASSO method combined with ten-fold cross-validation was applied to screen the key variables associated with the risk of AHF. The optimal λ (lambda) value, corresponding to the distance of the minimum standard error, was identified as 0.01109. At this threshold, the model selected 12 feature variables: age, gender, hypertension, diabetes mellitus, LDL-C, HDL-C, ApoB/A1, Scr, UA, cardiac troponin I, LAD, and the number of stents. The importance ranking of these 12 feature variables is presented in Figure 3.
Variable selection via the LASSO logistic regression model. (A) Distribution of LASSO coefficients for the 34 features. (B) Selection of the optimal λ (lambda) parameter in the LASSO model using ten-fold cross-validation based on the minimum standard error. (C) Ranking of the 12 screened feature variables by their coefficient values.
Stratification between the TyG index, TyG-BMI, TyG-WHtR, TyG-WC and AHF
12 feature variables identified by LASSO regression were incorporated into four logistic proportional hazard models to investigate the associations between the TyG index, its derived composite indices, and AHF (Table 2). Statistically significant positive associations were observed between the TyG index, TyG-BMI, TyG-WC, TyG-WHtR and AHF across all models (P < 0.05). After adjustment for confounding factors in Model 4, comparison of the Q4 with the Q1 yielded the following adjusted OR: 2.04 (95% CI, 1.18-3.58) for the TyG index, 2.13 (95% CI, 1.24-3.74) for TyG-BMI,1.99 (95% CI, 1.14-3.54) for TyG-WC, and 2.29 (95% CI, 1.32-4.04) for TyG-WHtR. Tests for trend yielded statistically significant results in all models (P < 0.05).
The regression model for investigating the associations between the lated indices and AHF
In Figure 4, RCS analysis was used to model and visualize the associations of TyG index, TyG-BMI, TyG-WC, and TyG-WHtR with the risk of AHF occurrence. After adjustment for covariates including age, gender, hypertension, diabetes, LDL-C, HDL-C, ApoB/A1, Scr, UA, cardiac troponin I, LAD, and the number of stents, linear associations were observed between each of the TyG index, TyG-BMI, TyG-WC, and TyG-WHtR indices and AHF (P-overall < 0.001, P-nonlinear > 0.05).
RCS analysis of the association between TyG-related indices and outcome incidence of AHF. (A) Association between TyG-index and AHF outcome incidence; (B) Association between TyG-BMI and AHF outcome prediction incidence; (C) Association between TyG-WHtR and AHF outcome prediction incidence; (D) Association between TyG-WC and AHF outcome prediction incidence.
ROC curves for patients with AHF
We further analyzed the predictive value of seven continuous variables (age, Scr, UA, HDL-C, LDL-C, Apo B/A1, and cardiac troponin I) screened by LASSO regression and five categorical variables (gender, hypertension, diabetes, LAD, and number of stents) for the occurrence of AHF. The predictive performance of TyG−related indices combined with these 12 variables was also evaluated. As shown by the ROC curves in Figure 5, TyG-WHtR exhibited the highest predictive capacity for AHF onset compared with other variables (AUC: 0.759, 95% CI: 0.721–0.797). In addition, the Youden index and optimal cutoff value were calculated for the seven continuous variables (Table 3). These continuous variables were subsequently converted into categorical variables based on their respective optimal cutoffs. For ease of documentation, variables were labeled sequentially with letters from A to Q.
Analysis of the predictive value of ROC curves for AHF after PCI. (A) presents the ROC curves for the 12 risk variables selected by LASSO regression. (B) presents the ROC curves for TyG-related indices combined with the 12 aforementioned risk variables. A, Age; B, Scr; C, Uric acid; D, HDL-C; E, HDL-C; F, HDL-C; G, Cardiac troponin I; H, Gender; I, Hypertension; J, Diabetes; K, Number of stents; L, LAD; Q, Age, Scr, Uric acid, HDL-C, HDL-C, HDL-C, Cardiac troponin I, Gender, Hypertension, Diabetes, Number of stents; L, LAD; M, TyG index+Q; N, TyG-BMI+Q; O, TyG-WC +Q; P, TyG-WHtR+Q.
Risk stratification of TyG index, TyG-BMI, TyG-WHtR and TyG-WC in association with AHF
Continuous variables were converted into categorical variables according to these optimal cut-off values; combined with five categorical variables (gender, hypertension, diabetes mellitus, LAD, and the number of stents), we further investigated the associations of TyG index, TyG-BMI, TyG-WHtR, and TyG-WC with the risk of AHF across different subgroups. Figure 6 presents the results of subgroup analyses for the association between the TyG-BMI and AHF. Our findings revealed a significantly stronger association between the TyG-BMI index and AHF only in the subgroup with the LAD artery as the culprit vessel (P < 0.05, P for interaction < 0.05). However, the relationship between TyG-BMI and AHF was not affected by age, Scr, UA, HDL-C, LDL-C, ApoB/A1, cardiac troponin I, gender, hypertension, diabetes mellitus, or the number of stents, with no statistically significant interaction observed between TyG-BMI and these variables (P for interaction > 0.05). Supplementary Figures 7–9 detail the results of subgroup analyses for the associations of the TyG index, TyG-WC, and TyG-WHtR indices with AHF. No significant effects of subgroup variables on the associations between TyG-WC, TyG-WHtR, TyG-BMI and AHF were observed in any of these analyses (all P for interaction > 0.05). In conclusion, these findings indicate that the effects of TyG-related indices on AHF remain relatively stable across different levels of the aforementioned variables. This highlights their potential value in identifying and managing individuals at an increased risk of AHF within specific subgroups.
The results of subgroup analyses for the association between the TyG-BMI and AHF.
Discussion
In this study, we analyzed in-hospital patients who had suffered AMI within the preceding 3 years, and comprehensively evaluated the associations of the TyG index and its related measures (TyG-WHtR, TyG-WC, TyG-BMI) with the occurrence of in-hospital AHF following emergency PCI in this population. The results showed that the levels of TyG, TyG-BMI, TyG-WHtR, and TyG-WC were significantly higher in patients with AHF than in those without AHF. In the multivariable Logistic regression model, each one-unit increase in the TyG index was associated with a 2.21-fold increased risk of AHF (OR: 2.21, 95% CI: 1.19–4.14, P < 0.01), while each one-unit increase in the TyG-WHtR index was linked to a 2.29-fold elevated risk (OR: 2.29, 95% CI: 1.35–3.91, P < 0.01). Further stratification of these indices by quartiles revealed that, across all four models, the higher quartiles of the TyG-WHtR exhibited the strongest association with an increased risk of AHF (OR: 2.29, 95% CI: 1.32–4.04, P < 0.01). ROC curve analysis demonstrated that, after adjustment for relevant confounding risk variables, the TyG-WHtR exhibited a significantly higher predictive value for the incidence of AHFA compared with other variables (AUC: 0.759, 95% CI: 0.721–0.797). Analyses using the RCS model demonstrated that the TyG index, TyG-BMI, TyG-WHtR, and TyG-WC remained linearly associated with AHF after adjustment for covariates (P-overall < 0.05, P-nonlinear > 0.05). Subgroup analyses identified a stronger association between TyG-BMI and AHF in individuals with the left anterior descending artery as the culprit vessel. Collectively, these findings highlight the important role of the TyG index and its derivatives that should be considered in assessing the risk of in-hospital AHF, particularly in AMI patients with left anterior descending artery occlusion.
The underlying mechanisms are primarily derived from previously published literature and remain speculative. The TyG index, as well as its combined indicators including the TyG-WHtR, TyG-WC, and TyG-BMI, are associated with the incidence of in-hospital AHF following PCI in patients with AMI. This correlation may be related to the synergistic pathogenic mechanisms underlying IR, metabolic disturbances, and obesity-associated injuries (19). The potential mechanisms are described as follows: (1) Following AMI, the body enters a stress state characterized by sympathetic activation, elevated inflammatory factor release, and increased glucocorticoid levels, all of which are linked to reduced insulin sensitivity in peripheral tissues. This reduction in insulin sensitivity may be accompanied by a shift in systemic energy supply toward lipid metabolism-a relatively inefficient process that may increase oxygen consumption. Such alterations can further exacerbate the imbalance between energy supply and demand in the ischemic myocardium, which may contribute to the pathogenesis of heart failure (20, 21); (2) IR is associated with inhibited nitric oxide (NO) synthesis and enhanced endothelin release, which may represent one cause of coronary microvascular endothelial dysfunction. Microcirculatory vessels already compromised by AMI may undergo vasospasm, leading to further hypoperfusion. This process can aggravate myocardial injury in ischemic regions and promote myocardial remodeling in viable myocardium (22, 23); (3) Inflammation and oxidative stress stimulate fibroblast proliferation and accelerate myocardial fibrosis, resulting in increased ventricular wall stiffness and impaired diastolic function. Concurrently, the coexistence of cardiomyocyte apoptosis and hypertrophy leads to thinning of the left ventricular wall, ventricular dilatation, and reduced ejection fraction, ultimately triggering the onset and progression of AHF (24–26).
Previous studies have demonstrated a J-shaped association between higher TyG-related indices and the risk of heart failure development (27), whereby the incidence of HF exhibits two phases of slow and rapid increase with the elevation of TyG-related indices. Additionally, these findings revealed no association between the TyG index and the risk of heart failure in the elderly population. In contrast to their findings, a study by Zhang F et al. confirmed a positive correlation between the TyG index and the risk of heart failure in the healthy population (28). Our study further confirmed a linear increase in the incidence of AHF with elevations in the TyG index and its combined indices (TyG-WHtR, TyG-WC, TyG-BMI) among patients with AMI. The discrepancies in study conclusions may be attributed to the coexistence of multiple comorbidities and physiological changes in the elderly population, as well as the fact that the study cohort in the present research comprised AMI patients with elevated blood glucose and lipid levels. This association may be attributed to “differences in obesity phenotypes.” Previous studies have shown that abdominal obesity (android fat distribution) is closely associated with adverse cardiometabolic risk and poorer prognosis of heart failure. In contrast, the gluteal obesity (gynoid fat distribution) may exert a protective effect, and its mechanism may be related to a more favorable adipokine profile and reduced visceral fat accumulation. These findings emphasize that fat distribution has an important impact on cardiovascular prognosis (29, 30). Notably, we observed a stronger association between TyG-BMI and AHF in patients with LAD coronary artery as the culprit vessel. This may be attributed to the fact that the LAD is one of the most critical vessels in coronary artery disease, and LAD lesions are frequently associated with a higher risk of myocardial ischemia and adverse prognosis. Furthermore, elevated BMI may contribute to increased volume overload. However, these subgroup findings should be regarded as exploratory observations and require further validation in independent cohorts or prospective studies (31, 32). Furthermore, a study by Nan Chen et al. demonstrated that among patients with ST-segment elevation myocardial infarction undergoing primary PCI, the incidence of early-onset HF was significantly higher in women than in men (29% vs. 14.8%) (33). Our study further validated this finding, with results showing a significantly higher incidence of AHF in women compared to men (22.3% vs. 16.0%). At the same time, our findings also indicated that TyG-WHtR had a stronger association with the risk of post-PCI AHF in AMI patients (OR: 2.29, 95% CI: 1.32–4.04, P < 0.01). This conclusion was consistent with the findings of a study by Xinyang Dui et al. (OR: 1.33, 95% CI: 1.01–1.75, P < 0.01), and the results revealed that TyG-WHtR, regardless of its high or low levels, was associated with an increased risk of HF (12). The discrepancy in OR may be attributed to the distinct study populations: our study included patients with AMI, whereas the comparator study focused on healthy elderly individuals. The AMI cohort in our research presented with a relatively higher degree of metabolic stress and potentially greater visceral fat accumulation, which may underpin the observed differences in OR values.
The findings of this study hold important implications for clinical practice and patient self-management. First, the TyG index and its combined indices (TyG-WHtR, TyG-WC, TyG-BMI) may serve as potential predictors of AHF following PCI in patients with AMI. Elevated TyG-WHtR levels are associated with an increased risk of AHF, suggesting that closer monitoring and early intervention may be warranted for these patients. Second, based on measurements of TyG-related indices, targeted health education can be provided to high-risk patients in clinical practice. Patients may be guided to reduce these indices through weight control, appropriate waist-to-height ratio management, and improved glucose and lipid metabolism. Such strategies may enhance patients’ awareness of postoperative health management and adherence to interventions, supporting the development of a patient-centered, comprehensive care model. Finally, measurement of TyG-related indices is convenient, cost-effective, and easy to perform without complex equipment. These indices may therefore be applicable in various medical institutions, especially primary care settings. Wider implementation could improve the accessibility of AHF risk stratification after PCI in AMI patients and facilitate early identification and intervention of postoperative cardiovascular complications. However, this study has several limitations. First, its retrospective design limits the ability to establish definitive causal relationships. Although multivariate adjustment and subgroup analyses were used to minimize confounding, several unmeasured factors may still have influenced clinical outcomes. These included infarct size, total ischemic time, and admission Killip class in patients with AMI, as well as specific phenotypic classification in patients with HF (e.g., acute left-sided versus right-sided HF) and the completeness of revascularization therapy. All of these factors are strongly associated with prognosis after PCI. Their exclusion from analytical models may have introduced bias into the observed associations, further restricting causal inference. Future studies with similar designs should collect more comprehensive baseline clinical data and systematically incorporate core metrics such as infarct size, ischemic duration, cardiac functional class, heart failure phenotype, and revascularization completeness. Such approaches would support more precise investigation of causal relationships between TyG-related indices and AHF following PCI. Second, this study primarily evaluated the baseline TyG index and its composite indices (TyG-WHtR, TyG-WC, TyG-BMI), but did not dynamically assess changes in insulin resistance during the clinical course. Third, categorization of some continuous variables into quartiles and use of ROC-derived cut-off values may have reduced statistical power and increased the risk of model overfitting. Moreover, multiple comparisons in subgroup and multivariable analyses could inflate Type I error rates and produce spurious positive associations. Subsequent studies should employ formal multiple testing corrections to improve statistical robustness. Finally, this study did not conduct internal or external validation, leading to uncertainties regarding the robustness and reproducibility of the observed associations. Future studies should implement internal validation strategies such as bootstrapping and cross-validation, or perform multi-center external validation, to improve the reliability of the conclusions.
Conclusion
In conclusion, the findings of this retrospective study indicate that higher TyG index and its combined indices (TyG-WHtR, TyG-WC, TyG-BMI) are closely associated with the risk of AHF in patients with AMI following emergency PCI, among which TyG-WHtR exhibits the strongest correlation. These results suggest that TyG-related indices can serve as a valuable prognostic tool for AMI patients after emergency PCI, helping clinicians conduct early risk assessment and timely intervention to improve patients’ prognosis.
The reference list from the paper itself. Each links out to its DOI / PubMed record.
- 1Akhtar KH Khan MS Baron SJ Zieroth S Estep J Burkhoff D . The spectrum of post-myocardial infarction care: From acute ischemia to heart failure. Prog Cardiovasc Dis. (2024) 82:15–25. doi: 10.1016/j.pcad.2024.01.017, PMID: 38242191 · doi ↗ · pubmed ↗
- 2Yu J Mehran R Grinfeld L Xu K Nikolsky E Brodie BR . Sex-based differences in bleeding and long term adverse events after percutaneous coronary intervention for acute myocardial infarction: three year results from the HORIZONS-AMI trial. Catheter Cardiovasc Interv. (2015) 85:359–68. doi: 10.1002/ccd.25630, PMID: 25115966 · doi ↗ · pubmed ↗
- 3Arnautu DA Andor M Buz BF Tomescu MC Vacarescu C Crisan S . Left ventricular remodeling and heart failure predictors in acute myocardial infarction patients with preserved left ventricular ejection fraction after successful percutaneous intervention in western Romania. Life (Basel). (2022) 12(10):1636. doi: 10.3390/life 12101636, PMID: 36295071 PMC 9604641 · doi ↗ · pubmed ↗
- 4Aedh AI Alshahrani MS Huneif MA Pryme IF Oruch R . A glimpse into milestones of insulin resistance and an updated review of its management. Nutrients. (2023) 15(4):921. doi: 10.3390/nu 15040921, PMID: 36839279 PMC 9960458 · doi ↗ · pubmed ↗
- 5Li X Wang J Niu L Tan Z Ma J He L . Prevalence estimates of the insulin resistance and associated prevalence of heart failure among United Status adults. BMC Cardiovasc Disord. (2023) 23:294. doi: 10.1186/s 12872-023-03294-9, PMID: 37301866 PMC 10257843 · doi ↗ · pubmed ↗
- 6Elendu C Amaechi DC Elendu TC Ashna M Ross-Comptis J Ansong SO . Heart failure and diabetes: Understanding the bidirectional relationship. Med (Baltimore). (2023) 102:e 34906. doi: 10.1097/MD.0000000000034906, PMID: 37713837 PMC 10508577 · doi ↗ · pubmed ↗
- 7Otowa-Suematsu N Sakaguchi K Kaneko A Ito J Morita Y Miura H . Relation of cardiac function to insulin resistance as evaluated by hyperinsulinemic-euglycemic clamp analysis in individuals with type 2 diabetes. J Diabetes Investig. (2021) 12:2197–202. doi: 10.1111/jdi.13608, PMID: 34081831 PMC 8668073 · doi ↗ · pubmed ↗
- 8Tahapary DL Pratisthita LB Fitri NA Marcella C Wafa S Kurniawan F . Challenges in the diagnosis of insulin resistance: Focusing on the role of HOMA-IR and Tryglyceride/glucose index. Diabetes Metab Syndr. (2022) 16:102581. doi: 10.1016/j.dsx.2022.102581, PMID: 35939943 · doi ↗ · pubmed ↗