Alk‐Fam150b (augmentor α) expression in the paraventricular nucleus of the mouse hypothalamus at molecular resolution, and its sensitivity to acute stress
Laurent Gueissaz, Spyridon Sideromenos, Evgenii O. Tretiakov, Robert Schnell, Tibor Harkany

TL;DR
This study explores how the augmentor α-ALK signaling pathway in the mouse hypothalamus responds to stress and its potential role in regulating food intake.
Contribution
The study reveals the cellular expression patterns and stress sensitivity of augmentor α-ALK signaling in the paraventricular nucleus.
Findings
Fam150b and Alk are expressed in the PVN, including CRH-containing neurons.
Fam150b and Alk are mutually exclusive with Scgn in CRH neurons and are not co-expressed.
Fam150b mRNA increases under inflammation-related stress in a mifepristone-sensitive manner.
Abstract
Augmentor α (Fam150b)‐induced activation of the ALK receptor (Alk) has gained significance as a hypothalamic signaling pathway with relevance to the control of food intake and energy homeostasis. In contrast, much less is known about the sensitivity of Fam150b‐Alk expression and signaling upon noxious challenges. In this regard, acute stress is of particular interest because augmentor α, released from afferents of the food intake circuit of the arcuate nucleus within the paraventricular hypothalamus (PVN), could link stress‐induced changes in food consumption. Nevertheless, conflicting data exist on whether Fam150b mRNA is expressed in the PVN. Here, we combined single‐cell RNA‐seq and multiplexed in situ hybridization to demonstrate that both Fam150b and Alk are expressed in the PVN of adult mice, including corticotropin‐releasing hormone (CRH)‐containing neurons. As such, a dichotomy…
Genes, proteins, chemicals, diseases, species, mutations and cell lines named across the full text — each resolved to its canonical identifier and authoritative record.
Click any figure to enlarge with its caption.
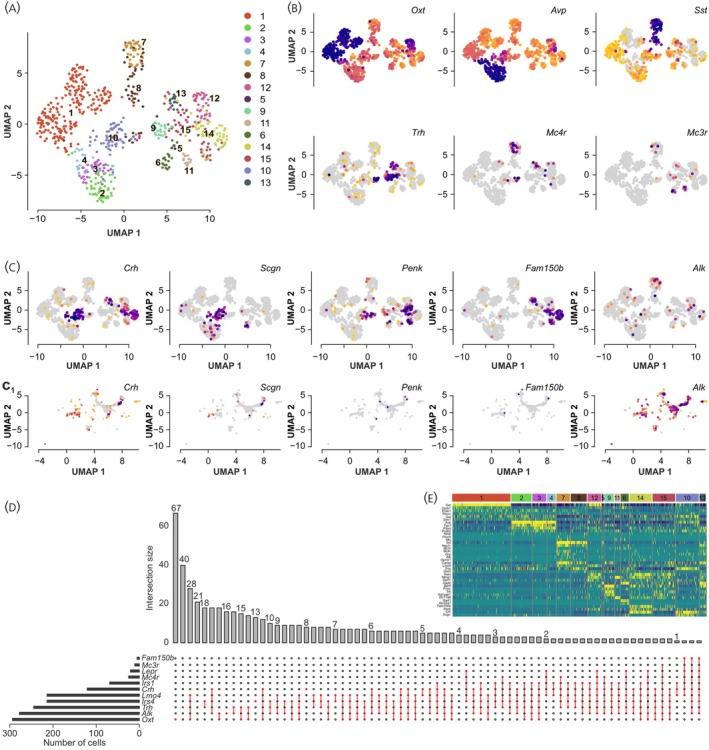 FIGURE 1
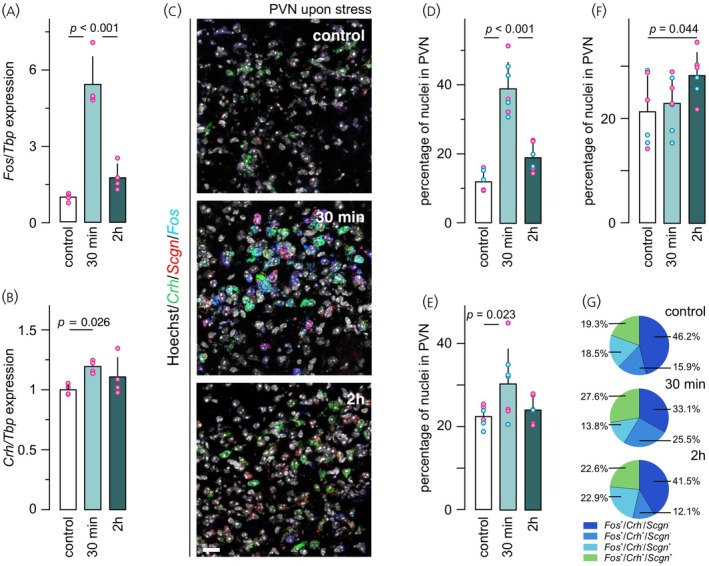 FIGURE 2
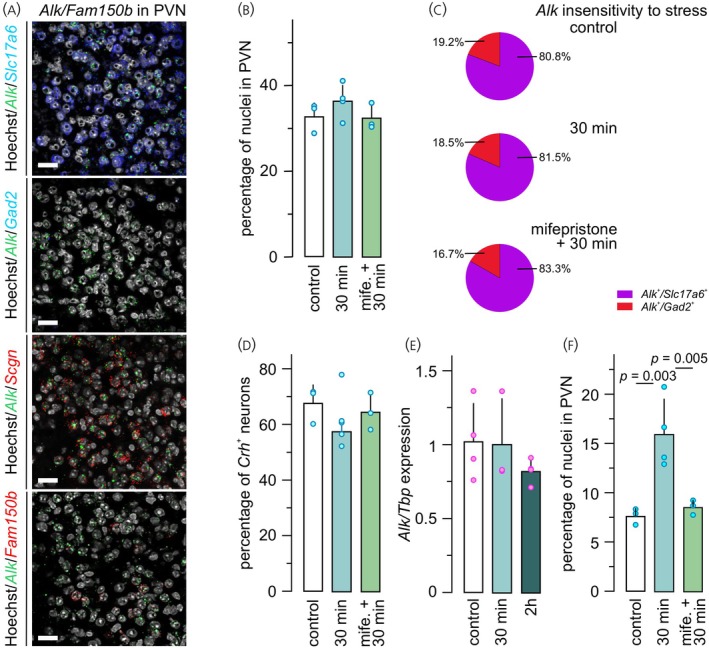 FIGURE 3
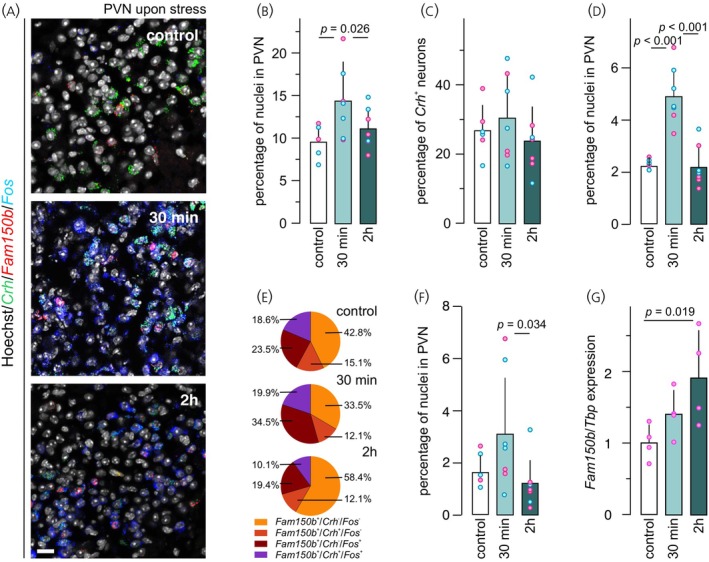 FIGURE 4
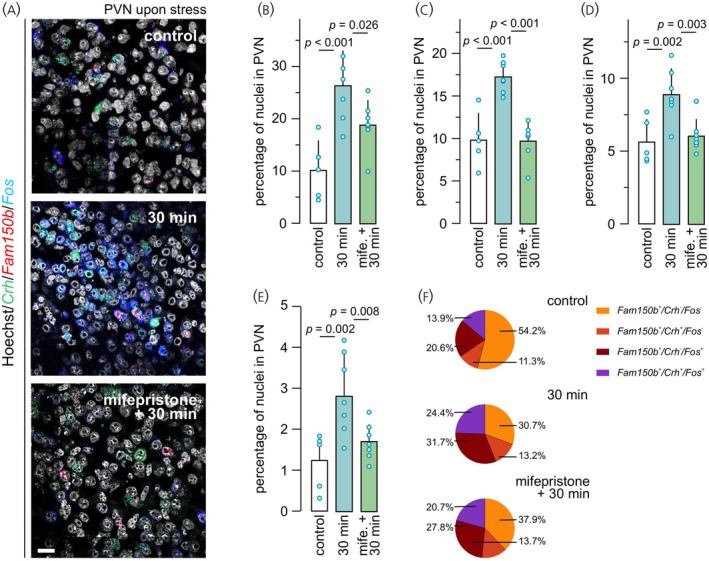 FIGURE 5
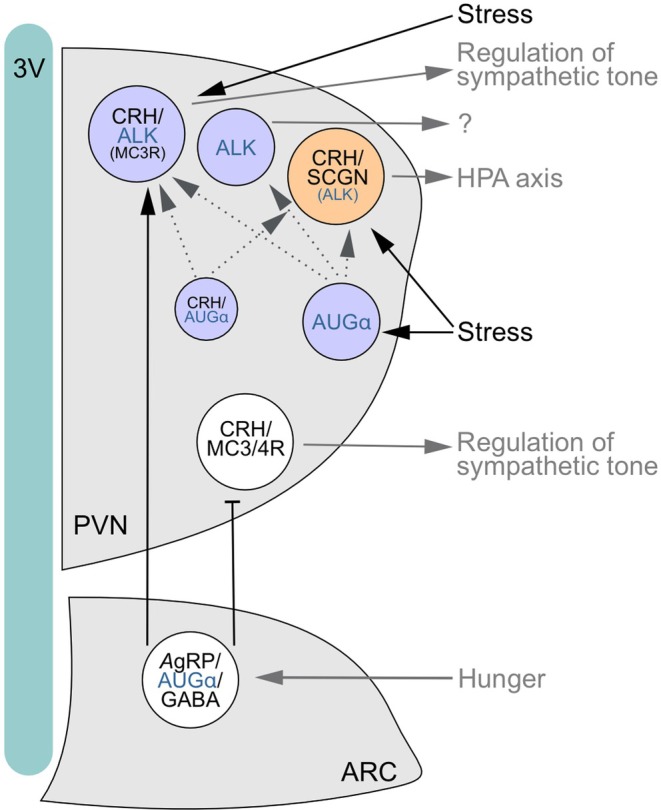 FIGURE 6
- —European Research Council
- —Vetenskapsrådet10.13039/501100004359
- —Hjärnfonden10.13039/501100003792
- —Novo Nordisk Fonden10.13039/501100009708
- —Austrian Science Fund10.13039/501100002428
Peer Reviews
No public reviews on file for this paper yet. If you reviewed it on a platform where reviews are public (OpenReview, ICLR, NeurIPS, ICML), you can paste yours below so the community can read it here.
Videos
No videos yet. Explain this paper in a talk, walkthrough, or lecture? Add one.
Taxonomy
TopicsStress Responses and Cortisol · Regulation of Appetite and Obesity · Neuroendocrine regulation and behavior
INTRODUCTION
1
According to both experimental and human studies,1 stress has profound effects on eating behaviors. While acute stress restricts food intake, particularly through changing the sympathetic tone innervating the adrenal medullary system, chronic stressors can increase food intake and lead to obesity through the sustained elevation of circulating cortisol levels.1 The neurobiological basis of this interaction rests in the hypothalamus, where the territories enriched in stress‐responsive and appetite‐regulating neurons are positioned proximally in the paraventricular (PVN) and arcuate nuclei (ARC),2, 3, 4, 5 respectively. It is classically accepted that the stress‐induced activation of corticotropin‐releasing hormone (Crh)^+^ neurons in the PVN, and the downstream activation of the hypothalamus–pituitary–adrenal (HPA) axis,6 mobilize energy stores to release adipocyte‐derived (e.g., leptin, ghrelin) and pancreatic (insulin, glucagon) hormones to feed‐back regulate the activity of agouti‐related peptide (Agrp)^+^ and proopiomelanocortin (Pomc)^+^ neurons of the ARC.7, 8, 9 Agrp ^+^ and Pomc ^+^ neurons produce antagonistic output with the former stimulating (orexigenic) and the latter inhibiting (anorexigenic) food intake.10, 11, 12 This feedback loop then closes with ARC neurons providing abundant afferents to the PVN either directly13, 14, 15 or indirectly through GABA relay neurons of the bed nucleus of the stria terminals.16 Thus, the refined and hierarchical neurocircuit organization of the hypothalamus allows for the dynamic, precisely timed transduction of sensory signals to a metabolic code through peripheral, long‐range modulators.
Whereas the neurocircuit layout linking the ARC and PVN is well established, the molecular mediators affecting the interplay of stress‐activated Crh ^+^ and Agrp ^+^/Pomc ^+^ neurons are still increasing in number and significance in physiological vs. pathobiological states. Firstly, Agrp ^+^ neurons are GABAergic and can directly inhibit Pomc ^+^ neurons through local axon collaterals in the ARC. When releasing AgRP in the PVN, the physiological sign of action is similarly inhibitory because AgRP is an antagonist at melanocortin 3/4 receptors (MC3/4Rs).17 Alternatively, Agrp ^+^ neurons can release neuropeptide Y (Npy) in the PVN, which binds Y118 and Y5 receptors19 to increase appetite,20, 21 and to also modulate sympathetic output to lessen brown adipose tissue thermogenesis.22 Secondly, Pomc ^+^ neurons are in large part glutamatergic (Vglut2 ^+^) with α‐melanocyte stimulating hormone (αMSH) being a critical determinant of reduced appetite23 when binding to stimulatory Gα_s_‐coupled MC3/4Rs24 in the PVN. Although the antagonism of αMSH vs. NPY/AgRP is considered the prototypic signaling mechanism to tune PVN neurons, the cellular identity of the postsynaptic cell populations remained ambiguous until single‐cell RNA‐seq data revealed their receptor repertoires and inferred the synaptic wiring of PVN neurons.25, 26, 27
More recently, the anaplastic lymphoma kinase (ALK/Alk) emerged as an additional receptor whose expression and function in hypothalamic neurocircuits could have implications for energy expenditure. ALK is a receptor tyrosine kinase (RTK) and belongs to the same subfamily as the leukocyte receptor tyrosine kinase (LTK).28, 29 The first association of ALK and synaptic neurotransmission was obtained when using Alk null mice.30 Soon after, a genome‐wide association study linked a variant of ALK to thinness and showed that ALK loss‐of‐function reduces triglyceride levels in Drosophila.31 Notably, Alk ^−/−^ mice had lean body mass due to elevated sympathetic activity and reduced adipose depots. Subsequent conditional and cell‐type‐specific Alk deletion,31 particularly in the PVN, reinforced its relevance for leanness. However, neither the identity nor potential heterogeneity of neurons that express Alk in the PVN, if any, is unequivocally clarified. Likewise, if Alk expression is sensitive to acute stress, thus potentially modulating stress‐induced body weight changes, remains unexplored.
Augmentor α (AUGα/Fam150b) and β (AUGβ/Fam150a)32 are secreted high‐affinity ligands for LTK, with AUGα being particularly efficacious to also induce the phosphorylation of ALK.33, 34 Augα ^−/−^ and/or Augβ ^−/−^ mice are resistant to age‐related weight gain induced by a high‐fat diet.35 This is because Augα knock‐out raises norepinephrine levels for a heightened sympathetic tone, reduces the weight of white adipose tissue, and drives thermogenesis, fat oxidation, and energy expenditure.4 Within the hypothalamus, AUGα^+^ neurons could include non‐overlapping Agrp ^+^ and Crh ^+^ cell cohorts,35 as suggested by single‐cell RNA‐seq, with Fam150b expression increased upon fasting in Agrp ^+^ neurons of the ARC.35 A single‐cell RNA‐seq study even subdivided Crh ^+^ neurons into Scgn ^+^ and Fam150b ^+^ subclusters.25 While the subdivision of Crh ^+^ neurons into stress‐responsive Scgn ^+^ neurons that project to the median eminence (Crh ^Scgn,stress‐on^)26 and Crh ^ Fam150b ^ neurons that might adjust the sympathetic tone carries significant conceptual value, a series of single‐cell RNA‐seq studies failed to detect Fam105b in the PVN.36, 37, 38 This ambiguity curtails how an ALK‐AUGα signaling axis could link stress and food intake.
Here, we addressed the identity of neurons that expressed Alk and/or Fam150b mRNAs in the PVN under physiological conditions, as well as upon acute stress induced by inflammatory pain.26 When combining single‐cell RNA‐seq, qPCR in microdissected tissues, and high‐resolution multiplexed fluorescence in situ hybridization in both female and male mice, we found both Alk and Fam150b mRNAs in glutamatergic/Crh ^+^ neurons of the PVN. Stress increased Fam150b but not Alk expression in a mifepristone‐sensitive fashion in Crh ^+^ 39/Fos ^+^ 40 neurons, suggesting increased signaling due to ligand excess and sensitivity to peripheral glucocorticoid feedback. We used MC3/4Rs and opioid receptors (because of their binding of αMSH/adrenocorticotropic hormone (ACTH), and β‐endorphin derived from POMC,41 as well as AgRP itself) as ‘landmarking tools’ to test if Fam150b and/or Alk‐containing neurons in the PVN could serve as post‐synaptic partners to either Pomc ^+^ or Agrp ^+^/Npy ^+^ neurons of the ARC. Our results suggest that ALK‐AUGα interactions can follow intercellular signaling principles in the PVN, with many Fam150b ^+^ neurons being likely targets of intrahypothalamic afferents.
MATERIALS AND METHODS
2
Single‐cell RNA‐seq analysis
2.1
We obtained single‐cell RNA sequencing data from three studies on the PVN of adult mice37, 42, 43 (https://harkany-lab.github.io/Gueissaz_2025/03-upset.html#pvn-neurons-from-both-datasets-joined). Initial quality control included filtering the cells based on unique feature counts, unique molecular identifier (UMI) counts, and mitochondrial gene percentage. Data were normalized using SCTransform. Variable features were identified using the ‘vst’ method selecting 3000 variable genes.
Data integration
2.2
For the dataset in Kim et al.,37 we performed reference‐based annotation by anchor‐based integration with reference data from Romanov et al.43 Cell‐type labels were transferred using FindTransferAnchors and TransferData functions with 30 dimensions. UMAP embeddings were generated using RunUMAP with optimized parameters (n_neighbors = 15–35, min.dist = 0.05–0.8) determined through systematic parameter search by scDEED.44
Subset analysis
2.3
PVN neurons were clustered based on hormone and neuropeptide signatures for oxytocin (Oxt), vasopressin (Avp), somatostatin (Sst), Crh, and thyrotropin‐releasing hormone (Trh) across pubertal and adult stages in Seurat v5.1.0 using the ‘FindNeighbors’ and ‘FindClusters’ functions (Figure 1A,B). Co‐expression patterns of metabolic (Alk, Fam150b, Mc3r/4r, Lepr, Insr, Lmo4, Irs1/4), and opioid system‐related genes (e.g., Oprd1, Oprk1, Oprl1, Oprm1, Pcsk1/2, Pdyn, Penk, Pnoc; Figures S1–S4) were systematically assessed, including their combination with neuropeptide markers in developmentally distinct neuronal clusters. Intersection analysis for co‐expression was performed using the UpSetR package (Figure 1E). Expression thresholds were determined using the 0.5th percentile of non‐zero expression values for each gene.
*Cell‐resolved gene expression patterns in the PVN. (A) Uniform Manifold Approximation and Projection (UMAP) plot for the unsupervised clustering of PVN neurons based on Smart‐seq2 single‐cell RNA‐seq data from Xu et al. 25 used as reference for integration and annotation for 10×‐based studies. 42 , 43 (B) UMAP plots for neuropeptides (Oxt, Avp, Sst, Trh) and melanocortin receptors (Mc3r, Mc4r) across cell clusters. Note the distinct localization of these canonical marker genes to specific cell clusters. (C) UMAP plots for the expression of key genes for Crh neurons, particularly Scgn, Penk, Fam150b/Augα, and Alk from two reference datasets: (C) representing reference dataset used for clustering in (A); (C1) showing expression in postnatal data integrated from single‐cell RNA‐seq on postnatal days 10 and 23. 37 , 43 Note the variability in detecting marker genes in Crh
- neurons, with Fam150b only specific for Smart‐seq2 data. 25
Alk expression was evident in 10× studies. 42 , 43 (D) Co‐expression of metabolic genes and cell identity markers in PVN neurons. Upset plot visualized the intersections for select gene combinations based on integrated 10× single‐cell RNA‐seq data as above. Horizontal bars to the left show the total number of cells expressing each gene above the 10th percentile threshold. Vertical bars indicate the number of cells expressing specific gene combinations, as per the inter‐connected markers below. (E) Heat‐map for the expression levels of selected neuropeptides, receptors, and signalling molecules across the 15 identified cell clusters in the PVN. Rows represent genes, whereas columns identify clusters. Expression levels were scaled from blue/purple (low) to yellow (high) to aid the visualization of cluster‐specific gene signatures. Expression values in (B, C, E) were normalized by total UMI counts scaled to 10,000 molecules and log‐transformed with pseudocount 1.*
Data visualization
2.4
Visualization was performed using custom ggplot2‐based functions (v3.5.1), with gene expression features plotted on coordinates in Uniform Manifold Approximation and Projection (UMAP45) and t‐distributed Stochastic Neighbor Embedding (t‐SNE),46 also allowing the reduction of dimensionality. Statistical summaries of gene expression patterns were generated using the skimr package. The analysis pipeline was implemented in R (v4.4.1) with key packages including Seurat (v5.1.0), SeuratWrappers, and Python 3.8.8 with scanpy for data preprocessing. Computational analyses were performed using parallel processing with 8 cores to optimize performance. Code reproducibility was ensured through consistent random seed setting (seed = 42) and the explicit version control of all dependencies.
Statistics
2.5
Estimation included quantile‐based thresholding for gene expression and the systematic evaluation of co‐expression patterns. The analysis incorporated quality control metrics including filtering for minimum gene counts, maximum mitochondrial content, and doublet score thresholds.47
Animals and ethical considerations
2.6
All experiments were conducted in C57BL/6JRj mice of both sexes at 8–12 weeks of age (Janvier). The sizes of animal groups were specified for each experiment separately. In brief, qPCR was performed on microdissected tissues from n = 12 female mice in total, while n = 10 female and n = 41 male mice were used for molecular neuroanatomy. Animals were randomized, when necessary, yet without blinding. Initially, the animals were group‐housed conventionally (12 h/12 h light/dark cycle, 22–24°C ambient temperature, and 55% humidity) and allowed ≥7‐days of recovery upon arrival to reduce the impact of transport‐ and environmental change‐related stress. Food and water were available ad libitum. Experiments on live animals conformed to the 2010/63/EU European Communities Council Directive and were approved by the Austrian Ministry of Women, Science and Research (66.009/0277‐WF/V/3b/2017). Effort was directed towards minimizing the number of animals used and their suffering during the experiments. Group sizes conformed to those in the literature.26, 43, 47
Stress induction and mifepristone treatment
2.7
To evaluate the impact of inflammation‐associated stress on Alk and Fam150b mRNA expression acutely, mice were randomly assigned to one of three groups (in equal number), that is, control, 30 min (‘30 min’), and 2 h survival after stress induction (‘2 h’). Stress was induced by 4% paraformaldehyde (PFA) injected subcutaneously in the left hind paw (in a volume of 50 μL),26 and confirmed in each case by increased grooming/licking and reduced mobility. Control mice received physiological saline (50 μL) instead. To reduce batch effects, we opted to perform this experiment throughout the light phase in one day (that is, n = 20 mice processed from 09.00 h [lights on] to 21.00 h [lights off]) with the animals randomized across the three experimental groups. Neither Fos nor Crh mRNA expression varied significantly across the day, as measured by both qPCR and in situ hybridization (data not shown).
To assess if changes in Fam150b expression in the PVN were induced by glucocorticoid receptor (GR) activation, mifepristone, a partial GR agonist,48, 49 was used prior to stress induction. Briefly, male mice were randomly assigned to control (n = 6), stress ‘30 min’ (n = 7), or mifepristone + stress ‘30 min’ (n = 7) groups. Control and stress‐only animals received an intraperitoneal injection of vehicle (80% saline, 10% dimethyl‐sulfoxide, 10% Cremophor) only, at a volume of 10 μL/g bodyweight. Mifepristone was administered at 50 mg/kg bodyweight.50 Experiments were performed between 09.00 h [lights on] and 13.00 h in the light phase. To allow for drug action, mice rested for 60 min before receiving a subcutaneous injection of 4% PFA or vehicle as above. Animals were processed 30 min after stress induction.
Tissue collection
2.8
At the specified time‐points (‘30 min’ vs. ‘2 h’), animals were deeply anesthetized (5% isoflurane in 1 L airflow/min), their brains rapidly removed, immersed in optimal cutting medium (OCT; Sakura) in plastic molds, and flash‐frozen by placing them on a rack pre‐chilled in liquid N_2_, thus avoiding direct contact between the samples and N_2_. Brains were stored at −80°C until use.
qPCR
2.9
Fresh‐frozen brains were coronally sectioned at 400 μm thickness on a cryostat microtome (CryoStar NX70, Thermo Fisher). The PVN at both sides was collected from two consecutive sections (from bregma −0.46 mm to −1.26 mm) using a pre‐chilled scalpel. Tissues were lysed, RNA isolated using the Aurum Total RNA kit (Bio‐Rad), with concentrations determined on a NanoDrop 2000 (Thermo Fisher), and their quality assessed by using the ratio of absorbance at 260 and 280 nm (NanoDrop 2000), which yielded 2.10 ± 0.04 [control], 2.09 ± 0.01 [30 min], and 2.09 ± 0.01[2 h], suggesting no‐to‐minimal contamination by proteins and/or free nucleotides. Subsequently, 150 ng/μl RNA were transcribed into cDNA by using a high‐capacity cDNA reverse transcription kit (Applied Biosystems). cDNA was amplified using SYBR green (BioRad) on a CFX Connect Real Time System (Bio‐Rad) with mouse‐specific primers (Eurofins) as follows: Crh (forward: ATC TCT CTG GAT CTC ACC TTC C, reverse: CCC GAT AAT CTC CAT CAG TTT CC), Alk (forward: ACT GAC ATC CTC GCT TCT GAA, reverse: ATA CGT TTC CTC TCA AAA CCC C), Fam150b (forward: AGG TTG CTA GTT GAG CTG GTC, reverse: CTC CTC TTG GTC TGC CCC ATA) and Fos (forward: TGG TGA AGA CCG TGT CAG GA, reverse: CCT TCG GAT TCT CCG TTT CTC T). TATA‐binding protein (Tbp) served as internal control (forward: CCT TGT ACC CTT CAC CAA TGAC, reverse: ACA GCC AAG ATT CAC GGT AGA).
In situ hybridization
2.10
In situ hybridization procedures were optimized and benchmarked using n = 6 adult male mice prior to batch‐processing all experimental tissues. Briefly, fresh‐frozen brains were coronally sectioned at 16‐μm thickness on a cryostat and stored at −20°C until use. Sectioning started at bregma −0.22 mm and ended at −1.34 mm with a 1‐in‐6 design to ensure systematic sampling of the entire PVN. The HCR RNA‐FISH protocol for ‘fresh frozen tissue sections’ (Molecular Instruments) was followed. Sections were air‐dried for 10 min prior to fixation (ice‐cold 4% PFA for 25 min), dehydrated in an ascending ethanol gradient (30%, 50%, 70% and 100%, 5 min each), and dried for 3 min. Probes (Crh, Slc17a6, Gad2, Fam150b, Alk, Fos, Scgn, Mc4r and Npy1r) were obtained from Molecular Instruments. Probe combinations included Crh/Fam150b/Fos, Crh/Fam150b/Scgn, Crh/Alk/Fos, Crh/Scgn/Fos, Crh/Alk/Scgn, Alk/Mc4r, Alk/Npy1r, Alk/Slc17a6, Alk/Gad2, and Crh/Alk/Fam150b. Probes and hairpins were used at a concentration of 0.5 μL/100 μL and 2 μL/100 μL, respectively. Nuclei were counterstained with Hoechst 33,342 (1:5000; Sigma).
Confocal microscopy and quantification
2.11
Imaging was performed on a Zeiss LSM800 laser‐scanning microscope equipped with a 40× oil objective and line lasers for maximal signal separation. Images were acquired in the Zeiss ZEN software (v.2.3) from sections that had high‐quality and specific in situ hybridization signals to minimize potential bias during quantification. Only images in which the PVN could be unambiguously identified were used, with both hemispheres sampled for each marker combination. We included rostral (bregma: −0.58 mm), median (bregma: −0.82 mm), and caudal (bregma: −1.06 mm) subdivisions of the PVN in our analysis (n ≥ 3 sections/PVN/hemisphere), with data pooled for statistics afterwards. The PVN was manually encircled. Clustering of the cell populations was performed in ImageJ51 using a semi‐automatic toolbox for object‐based co‐localization.52 This approach allowed the allocation of mRNA signals of interest per cell with Hoechst 33,342 (Sigma) serving as nuclear marker. Subsequently, all images were inspected by an experimenter blinded to the case conditions to remove any false positive signal (<1 punctum/cell).
Statistics
2.12
Histochemical data were normalized to the total number of neurons per PVN in each section. Unless stated otherwise, data were expressed as means ± s.d. and analyzed using GraphPad Prism (v.10.2.3 for Windows). Data were statistically evaluated using one‐way ANOVA with Fisher's least significant difference (LSD) test, where appropriate. A p value of <0.05 was considered significant. Data in each figure were plotted as bar graphs overlain with individual data points, which were disaggregated to show eventual sex differences.
RESULTS
3
Molecular identity of Alk
- and/or Fam150b
- neurons in the PVN
3.1
Single‐cell RNA‐seq data were analysed for neurotransmitters (Figure 1A,B) and the co‐expression of Alk, Fam150b, Scgn (secretagogin; Figures 1C and S1), Mc3r/Mc4r, Lepr, and Isr3/4 (Figure 1D). The expression profile of Lmo4, a transcriptional regulator expressed in both Crh ^+^ and thyrotropin‐releasing hormone (Trh)^+^ neurons, was also determined and used for metabolic predictions in juvenile/adult wild‐type mice (both C57Bl6/N/J and CD1 strains; Figure S1). Oxt ^+^, Avp ^+^, Sst ^+^, Crh ^+^ (~16% of PVN cells), and Trh ^+^ neurons were subclustered (Figures 1A,B and S2–S4). Oxt ^+^ and Avp ^+^ neurons did not express appreciable levels of marker genes for fast synaptic neurotransmission (Figure 1E). Sst ^+^ neurons were exclusively GABAergic (contained both Gad1 and Slc32a1). In contrast, Crh ^+^ and Trh ^+^ neurons were glutamatergic (Slc17a6 ^+^) (Figure 1E).
Alk was co‐expressed in subsets of Oxt ^+^ > Trh ^+^ > Crh ^+^ neurons under physiological conditions (Figure 1C,C 1) in ~37% of all PVN neurons. Alk and Fam150b were particularly enriched in those Crh ^+^ neurons that did not co‐express Scgn but Oprl1 (nociceptin receptor 1; ~35% of all cells) and Oprm1 (μ‐opioid receptor; ~19% of all cells; Figure 1C,C 1). Another Fam150b ^+^ neuronal cluster had lower levels of Crh together with Penk mRNA transcripts. It is noteworthy that Fam150b expression varied in the reference datasets: Xu et al.25 who used Agrp‐IRES‐Cre mice for sequencing (see also Ref. 35) detected shallow gene expression (Figure 1C). In contrast, Kim et al.37 found both populations of neurosecretory Crh ^+^ neurons to barely contain, if any, Fam150b transcripts (Figure 1C 1). The integration of multiple datasets supported the presence of Alk and Fam150b in the PVN, suggesting a conserved molecular architecture for metabolic signalling. Alk and Fam150b were rarely, if at all, co‐expressed (Figure 1D). Mc3/4r expression marked Oxt ^+^, and Trh ^+^ neurons, but not Crh ^+^ neurons (Figure 1B,C), and co‐existed with neither Fam150b nor Alk. Cumulatively, these data suggest that Alk and Fam150b expression are cellular features for some PVN neurons, including Crh ^+^ cells, and allow for intercellular, rather than cell‐autonomous, signalling within the PVN and/or in projection areas. These observations, together with the lack of reliable commercial antibodies available to date, prompted us to localize mRNAs to molecularly characterize either Alk ^+^ or Fam150b ^+^ neurons in the PVN itself.
Methodological considerations for stress‐induced neuronal activation
3.2
Quantitative real‐time PCR was first used to reproduce earlier studies26 on stress‐induced neuronal sensitization in the PVN. We have empirically selected 30 min and 2 h time‐points based on our own and others' findings.26, 53, 54 At 30 min, Fos mRNA levels in female mice increased by ~5.4‐fold upon stress induction (p < 0.001; Figure 2A). Similarly, Crh mRNA expression was elevated relative to controls (p = 0.026; Figure 2B). At 2 h, Fos expression approximated the control value (<2‐fold; p < 0.001; Figure 2A) alike the Crh mRNA content (p > 0.2; Figure 2B).
*The effect of inflammatory pain on Fos, Crh, and Scgn mRNA expression in the PVN. Quantitative PCR (qPCR) results comparing the impact of acute PFA‐induced stress on Fos (A), and Crh (B) mRNA expression in the PVN. Equivalent group sizes (n = 4) of female adult C57Bl6/N mice were used throughout. Data were normalized to TATA‐binding protein (Tbp) that had served as a housekeeping standard. Single‐molecule fluorescence in situ hybridization (C) and quantification of Fos
- (D), Crh
- (E), and Scgn
- (F) neurons in the PVN under physiological conditions (‘control’) and in animals that had experienced acute stress (30 min vs. 2 h). Data were normalized to the number of nuclei within manually delineated PVNs per section. (G) Colocalization coefficient from triple‐label experiments within the Fos
- neuronal population. Magenta and light blue circles disaggregated data from females and males, respectively. Statistical differences were considered at p <0.05. Scale bar = 25 μm.*
Next, we validated the qPCR data by multiplexed in situ hybridization (Figure 2C) and semi‐automated cell counting. The proportion of Fos ^+^ cells (expressing >2 fluorescent puncta/cell) increased after 30 min from 12.0 ± 3.0% to 39.0 ± 7.6% of all cells in the PVN (p < 0.001 vs. [control]), with a reduction to 19.0 ± 4.1% after 2 h (p < 0.001 vs. [30 min]; Figure 2D). The proportion of Crh ^+^ neurons also increased significantly after 30 min (22.5 ± 2.5% [control] vs. 30.4 ± 8.3% [30 min]; p = 0.023; Figure 2E) but returned to baseline‐like levels after 2 h (24.1 ± 3.2%). The proportion of Scgn ^+^ cells, a stable marker of Crh ^Scgn,stress‐on^ neurons,26 did not change at 30 min, and was only moderately increased 2 h after stress induction (21.4 ± 6.8% [control] vs. 28.3 ± 5.1% [2 h]; p = 0.044; Figure 2F). This finding is compatible with a slow response in the regulation of secretagogin expression as seen earlier in, e.g., β‐cells of the endocrine pancreas.55
We did not find sex as a significant variable with regard to the numbers of cells positive for Fos, Crh or Scgn in these experiments. When normalised to the total cell number in the PVN, Fos ^+^ neurons represented 11.61 ± 3.81% vs. 12.42 ± 2.81% (p = 0.781, [control]); 39.73 ± 10.13% vs. 38.39 ± 6.8% (p = 0.84, [30 min]), and 19.41 ± 5.08% vs. 18.13 ± 2.45% (p = 0.781, [2 h]) for females and males, respectively (Figures 2D and S5A). Similarly, Crh ^+^ neurons accounted for 23.88 ± 2.01% vs. 21.15 ± 2.51% (p = 0.215, [control]), 30.92 ± 12.1% vs. 29.96 ± 6.41% (p = 0.895, [30 min]), and 24.14 ± 4.16% vs. 24.00 ± 0.09% (p = 0.975, [2 h]) in females and males, respectively (Figures 2E and S5B). Lastly, Scgn ^+^ neurons constituted 22.27 ± 7.52% vs. 20.45 ± 7.59% (p = 0.783, [control]), 25.78 ± 3.15% vs. 20.84 ± 5.52% (p = 0.228, [30 min]), and 29.08 ± 5.36% vs. 29.74 ± 1.5% (p = 0.598, [2 h]) in female and male subjects, respectively (Figures 2F and S5C).
Next, we asked if the pool size of neurons co‐expressing Crh and Fos had been affected by inflammatory pain‐associated stress. At 30 min, we saw a significant increase in dual‐labelled neurons (15.9 ± 8.8% [control] vs. 25.5 ± 8.5 [30 min]; p = 0.048), which returned to baseline by 2 h (12.1 ± 6.4; Figure 2G). The number of neurons co‐labelled for Crh, Fos, and Scgn also increased after 30 min (19.3 ± 7.4% [control] vs. 27.6 ± 4.2% [30 min]; p = 0.047), yet tailed off by 2 h (22.6 ± 8.6%). Cumulatively, both molecular and histochemical data using Fos expression as a surrogate of neuronal activity suggested the fast and transient responsiveness of Crh ^+^ neurons that otherwise stably express Scgn to PFA‐induced inflammatory pain‐associated acute stress.
Alk
mRNA expression in the PVN
3.3
Under physiological conditions, 33.0 ± 3.7% of PVN cells expressed Alk (Figure 3A,B). Alk expression dominated in glutamatergic (Slc17a6 ^+^) neurons (80.8 ± 6.3% of Alk ^+^ population; Figure 3A,C). Other Alk ^+^ neurons were GABAergic as judged by the co‐existence of Gad2 (19.2 ± 6.3% within the Alk ^+^ population; Figure 3A,C).
*Alk mRNA expression in the PVN and its insensitivity to acute inflammation‐associated stress. (A) Fluorescence multiple‐label in situ hybridization of the PVN (coronal sections) co‐labelled for Alk with either Slc17a6, Gad2, Scgn or Fam150b. Scgn served as a surrogate molecular marker for a subset of Crh
- neurons. 26 No co‐localization of Alk and Fam150b was observed in the PVN (bottom). Experiments were conducted in control (vehicle, n = 6; all male), PFA‐treated (30 min, n = 7), and mifepristone (10 μL/g body weight volume i.p.) + PFA‐treated (n = 7) mice. (B) Neither stress (30 min) nor mifepristone affected the proportion of Alk
- cells in the PVN. (C) The majority of Alk mRNA expression was seen in glutamatergic (Slc17a6 +) neurons, with lesser contribution of GABAergic neurons. (D) Crh
- neurons were then sub‐grouped and tested for Alk mRNA expression. The total population size of Crh +/Alk
- PVN neurons did not change (control [n = 3] vs. PFA [n = 4] vs. mifepristone + PFA [n = 3]). (E) Quantitative PCR confirmed the lack of change in Alk mRNA expression in microdissected PVN samples (all females). Data were normalized to TATA‐binding protein (Tbp), used as housekeeping standard. (F) The proportion of Fos +/Crh +/Alk
- PVN neurons increased in PFA‐injected mice (30 min). This effect was offset by mifepristone pre‐treatment. Data were normalized to the number of nuclei within manually delineated PVN/section. Magenta and blue circles disaggregated data from females and males, respectively. Statistical differences were considered at p <0.05. Scale bars = 25 μm.*
Histochemical analysis of Crh/Alk co‐expression found that 67.8 ± 6.6% of Crh ^+^ PVN neurons contained Alk mRNA (Figure 3D). These data were qualitatively supported by showing Alk mRNA in some Scgn ^+^, but not Fam150b ^+^, neurons (Figure 3A). In addition, Alk co‐localized with neither Npy1r nor Mc4r (Figure S6A‐B1). Overall, we did not only corroborate the single‐cell RNA‐seq‐based molecular subclassification of Crh ^+^ neurons but also suggest the prevalence of intercellular AUGα‐ALK signaling.25 In addition, the segregation of Alk and Mc4r expression suggests that POMC‐derived αMSH and AUGα released from ARC efferents could target spatially non‐overlapping Crh ^+^ cell cohorts in the PVN.25, 35
Alk
mRNA expression upon acute inflammatory pain
3.4
Inflammation‐associated stress did not alter the population size of Alk ^+^ neurons in the PVN (36.3 ± 3.9%; Figure 3B). Additionally, it did not influence the molecular identity of Alk ^+^ neurons (for Slc17a6: 81.5 ± 8.1% and for Gad2: 18.5 ± 8.1% of Alk ^+^ population; Figure 3C); nor did it affect the proportion of Crh ^+^ neurons that harbored Alk mRNA (57.6 ± 4.1%; Figure 3D). These data were confirmed by qPCR from microdissected PVN samples, which revealed unchanged Alk expression at both 30 min and 2 h after PFA injection (Figure 3E). In contrast, the proportion of neurons co‐labelled for Fos/Crh/Alk significantly increased 30 min after PFA injection (7.6 ± 0.1% [control] vs. 16.0 ± 3.5% [30 min]; p = 0.003; Figure 3F). These data suggest the insensitivity of Alk mRNA expression to pain‐associated stress.
Next, we used mifepristone to block the cellular effects of systemic glucocorticoid feedback.48, 56, 57 Treatment of mice with mifepristone did not alter the size of the Alk ^+^ neuronal population in the PVN (32.5 ± 2.9%; p = 0.27; Figure 3B). Alk mRNA expression was not affected in Slc17a6 ^+^ (83.3 ± 5.4%; p = 0.48; Figure 3C), Gad2 ^+^ (16.7 ± 5.4%; p = 0.48; Figure 3C), and Crh ^+^ neurons (64.5 ± 6.7; p = 0.15; Figure 3D) relative to control subjects. The action of mifepristone was quality‐controlled through the reduced density of PVN cells triple‐labelled for Fos/Crh/Alk (8.5 ± 0.1%), as compared to PFA‐exposed subjects (16.0 ± 3.5%; p = 0.005; Figure 3F). In sum, these data suggest that Alk is chiefly present in Slc17a6 ^+^/Crh ^+^ neurons of the PVN,31 and its expression is insensitive to inflammation‐induced stress acutely.
Fam150b expression in the PVN
3.5
Under physiological conditions, 9.6 ± 2.0% of all cells in the PVN contained Fam150b mRNA (Figure 4A,B). Among the Crh ^+^ neurons, ~27% harbored Fam150b hybridization signal (Figure 4C). Fam150b co‐localized with neither Alk (Figure 3A) nor Scgn (Figure S6C,C1). These data demonstrate that Fam150b is expressed in a subset of glutamatergic/Crh ^+^ neurons in the PVN that segregate from their Scgn ^+^ counterparts.25
*Fam150b expression in the PVN upon inflammation‐induced acute stress. (A) Multiple‐label in situ hybridization for Fam150b, Crh, and Fos mRNAs in the PVN under control conditions (n = 6), and 30 min (n = 7) or 2 h (n = 7) after PFA injection. Note the induced expression of Fos mRNA in response to stress induction. (B) Next, the total number of Fam150b
- neurons in the PVN was determined, revealing a transient increase at 30 min after stress induction. (C) Amongst Crh
- PVN neurons, Fam150b mRNA expression did not change upon stress induction. (D) The proportion of the Fos +/Crh −/Fam150b +population increased instead. (E) Co‐localization coefficient from triple‐label experiments within the Fam150b
- neuronal population. (F) The proportion of Fos +/Crh +/Fam150b
- neurons increased 30 min and decreased 2 h after stress induction, albeit non‐significantly relative to controls. Data were normalized to the number of nuclei within manually delineated PVNs/section. Magenta and blue circles identify female and male subjects, respectively. (G) Quantitative PCR from microdissected mouse PVN (all females) showed a gradual increase in total Fam150b mRNA. Data were normalized to TATA‐binding protein (Tbp), used as a housekeeping standard. Statistical differences were considered at p <0.05. Scale bar = 30 μm.*
Fam150b expression upon acute inflammatory pain
3.6
The population size of Fam150b ^+^ neurons increased to 14.4 ± 4.6% 30 min after PFA injection (p = 0.026; Figure 4A,B). Additionally, the likelihood of finding Fos ^+^/Fam150b ^+^ neurons increased at 30 min (2.2 ± 0.2% [control] vs. 4.8 ± 1.1% [30 min]; Figure 4D), representing, respectively, 23.5 ± 4.3% and 34.5 ± 5.3% (p = 0.003; Figure 4E) of the Fam150b ^+^ population. This change returned to baseline after 2 h to 2.1 ± 0.8% (vs. [30 min]; p < 0.001; Figure 4D) of total PVN cells, representing 19.4 ± 7.0% (vs. [30 min]; p < 0.001; Figure 4E) of Fam150b ^+^ cells. Additionally, the proportion of Crh/Fos/Fam150b triple‐labelled neurons in the PVN remained unchanged between control and 30 min, yet slightly decreased 2 h after PFA exposure (1.8 ± 0.7% [control] vs. 3.1 ± 2.3% [30 min] (p = 0.15) and 1.2 ± 1.0% [2 h] (p = 0.034); Figure 4F). These results, respectively, represented 18.6 ± 3.5%, 19.9 ± 9.2% (p > 0.7), and 10.1 ± 6.2% (p = 0.034; Figure 4E) within the Fam150b ^+^ population.
We then queried if any of these histochemical changes was sex dependent. When normalized to the total PVN, Fam150b ^+^ neurons represented 10.83 ± 1.31% vs. 8.80 ± 2.24% (p = 0.354, [control]), 15.65 ± 6.58% vs. 13.48 ± 3.24% (p = 0.584, [30 min]), and 10.06 ± 1.76% vs. 12.67 ± 2.71% (p = 0.19, [2 h]) in female and male subjects, respectively (Figures 4B and S5D). Similarly, within the Crh ^+^ neuronal cohort, Fam150b ^+^ neurons accounted for 30.77 ± 7.52% vs. 22.93 ± 5.44% (p = 0.218, [control]), 27.92 ± 13.28% vs. 32.44 ± 13.43% (p = 0.677 [30 min]), and 22.13 ± 5.08% vs. 26.19 ± 15.36% (p = 0.633, [2 h]) in females and males, respectively (Figures 4C and S5E). Moreover, neurons co‐expressing Fos and Fam150b were 2.21 ± 0.26% vs. 2.13 ± 0.17% (p = 0.698, [control]), 4.68 ± 1.59% vs. 4.94 ± 0.72% (p = 0.779 [30 min]), and 1.9 ± 0.73% vs. 2.46 ± 0.99% (p = 0.425, [2 h]) in females and males, respectively (Figures 4D and S5F). Neurons that co‐expressed Crh/Fos/Fam150b amassed to 1.96 ± 0.91% vs. 1.63 ± 0.61% (p = 0.65, [control]), 3.38 ± 2.91% vs. 2.95 ± 2.16% (p = 0.83 [30 min]), and 0.86 ± 0.41% vs. 1.65 ± 1.45% (p = 0.332, [2 h]) of all cells in the PVN of female and male mice, respectively (Figures 4F and S5G).
Next, qPCR was performed on microdissected tissues to corroborate the dynamics of Fam105b expression in the PVN. Fam150b mRNA content progressively increased, reaching significance only at 2 h (n = 4/group; p = 0.019; Figure 4G). These data suggest that Fam150b expression increased transiently, primarily in non‐Crh neurons, upon inflammation‐associated acute stress.
Lastly, we sought to determine if Fos/Fam150b co‐existence was sensitive to the manipulation of systemic glucocorticoid action (alike CRH58) by applying mifepristone prior to PFA treatment. PFA injection coincidently increased Fos, Crh, and Fam150b expression (Figure 5A). In this particular experiment, PFA increased the portion of Fos ^+^ neurons from 10.2 ± 5.7% [control] to 26.4 ± 6.6% [30 min] (p < 0.001; Figure 5B); Crh ^+^ neurons from 9.9 ± 3.1% [control] to 17.3 ± 1.8% [30 min] (p < 0.001; Figure 5C); and Fam150b ^+^ neurons from 5.7 ± 1.6% [control] to 8.9 ± 1.8% [30 min] (p = 0.002; Figure 5D). Mifepristone prevented the pain‐induced increases in any of the mRNAs sampled (Fos: 18.9 ± 4.7%; p = 0.026; Figure 5B; Crh: 9.7 ± 2.2%; p < 0.001; Figure 5C; Fam150b: 6.1 ± 1.1%; p = 0.003; Figure 5D). Additionally, we observed that PFA increased the portion of Fos/Fam150b double‐positive neurons in the PVN from 1.2 ± 0.7% to 2.9 ± 1.0% (control vs. [30 min]; p = 0.002; Figure 5E), which was prevented by mifepristone i (1.7 ± 0.4%; p = 0.008; Figure 5E). In sum, these data suggest that Fam150b expression is sensitive to pain‐associated stress in the PVN (Figure 5F), wherein Fam150b ^+^(/Crh ^+^) neurons are inferred as a non‐overlapping subpopulation with Alk ^+^/Crh ^+^ neurons. Thus, our data after mifepristone treatment are consistent with the hypothesis that Fam150b ^−^/Scgn ^+^ neurons might be seen as ‘first responders’, while Fam150b ^+^/Scgn ^−^ neurons could control sympathetic output instead (Figure 6).
*Mifepristone modulates Fam150b mRNA expression in the PVN. (A) Multiple‐label in situ hybridization for Fam150b, Crh, and Fos mRNAs in the PVN (adult male mice; n = 6 [control], n = 7 [PFA], and n = 7 [mifepristone + PFA]). Acute stress up‐regulated Fos (B), Crh (C), and Fam150b (D) mRNAs in a mifepristone‐sensitive manner. (E) The proportion of the Fos +/Crh −/Fam150b +population increased in response to stress induction in a mifepristone‐sensitive manner. (F) Co‐localization coefficient from triple‐label experiments within the Fam150b
- neuronal population. Statistical differences were considered at p < 0.05. Scale bar = 30 μm.*
*Schema outlining how (acute) stress might affect augmentor α‐ALK signalling in some neurons of the paraventricular nucleus of the hypothalamus (PVN). Corticotropin releasing‐hormone (CRH)+ neurons form two subpopulations, one being secretagogin (SCGN)+ while another Fam150b +, producing augmentor α (AUGα). CRH+/SCGN+ neurons could act as fast‐responders to acute stress and initiate the hypothalamus‐pituitary‐adrenal (HPA) axis. Alternatively, stress could primarily stimulate AUGα production in a subset of CRH− neurons in a glucocorticoid‐dependent manner, even if a relatively small subset of CRH+/AUGα+ neurons co‐exist in the PVN. Local AUGα action is likely paracrine, and could engage predominantly glutamatergic ALK+ neurons, subsets of which could co‐express either CRH or SCGN, or both, and even melanocortin receptors 3 and 4 (MC3/4R). Based on single‐cell RNA‐seq data, the above circuit seems largely independent of the melanocortin axis, including Mc3/4r
- neurons in the PVN, that controls bodyweight. Dashed arrows represent proposed interaction deduced from anatomical data. 3V, third ventricle; ARC, arcuate nucleus.*
DISCUSSION
4
The impact of stress on eating behaviour and weight change is a topic of intense scientific discourse. Particularly, the organizational complexity of the neural networks underpinning the regulation and integration of the origin (modality), severity, and duration of the stress response with the resetting of metabolic set‐points remains a major conceptual challenge. As such, experimental designs themselves can be biasing and even limiting outcomes through emphasizing some while also negating other variables. Nevertheless, the duration of stress has invariably emerged as a primary factor to affect weight change, with acute and chronic stress reducing and increasing it, respectively.1 This duality could be, at least in part, due to the participation of either the sympathetic medullary adrenal system to increase catecholamine release (both adrenaline and noradrenaline), with consequential reduction in food intake. In turn, activation of the HPA axis increases circulating glucocorticoid levels and provokes weight gain.1 Besides the brain‐periphery axes that become engaged and provoked, the molecular identity of synaptic mediators within the hypothalamus can also diversify body‐wide responses to stress.
Therefore, we have examined the cellular architecture of the ALK‐AUGα (Fam150b) signaling cassette (Figure 6), which was recently associated with the control of eating behaviour and energy metabolism through modulating PVN activity and output.31, 35 While AUGα was described as a ligand co‐released from ARC efferents in the PVN, neither the cell‐type specificity nor stress sensitivity of either ligand (AUGα) or receptor (ALK) expression is known. When merging single‐cell RNA‐seq and in situ hybridization data, we concluded that ~35% of all cells contained anatomical indices of AUGα‐ALK signaling, with the majority of Alk ^+^ cells being glutamatergic (Slc17a6 ^+^),35 rather than GABAergic (Gad2 ^+^; 20% only). This finding is compatible with the predominantly glutamatergic neurochemical signature of PVN neurons.
Single‐cell RNA‐seq is a formidable tool to gain insights in the molecular make‐up of any cell type by quantifying RNA copy numbers in isolated somata, nuclei, or subcellular compartments (e.g., synapses).59, 60 For neurons, the combination of single‐cell RNA‐seq with morphological and electrophysiological parameters in one workflow (often termed Patch‐seq 61, 62) can inform about network embedding, modes of intercellular signalling, and functional flexibility. Single‐cell RNA‐seq data exist for both the developing and adult hypothalamus globally, as well as many hypothalamic nuclei in isolation.37, 42, 43, 63, 64, 65 These studies helped, e.g., to subcluster Crh ^+^ neurons, and to consider CRH as a cell‐state rather than cell type‐specific marker. For the former, bona fide Crh ^+^ neurons activated by acute stress (Crh ^Scgn,stress‐on^) are glutamatergic and co‐express secretagogin (Scgn). For the latter, transient Crh mRNA expression in respective GABAergic and dopaminergic neurons within and outside the PVN are compelling examples.66 Besides their descriptive value at molecular resolution, single‐cell RNA‐seq studies can inform about cellular response patterns (modifications of gene regulatory networks; Figure 1D), including metabolic set‐points, which allow for inferences be made on if and how specific cell types respond to environmental challenges.
However, single‐cell RNA‐seq is sensitive to uncontrolled dropouts among input cells, as well as false negative reads for genes with low abundance (e.g., many G protein‐coupled receptors). Therefore, single‐cell RNA‐seq is best be combined with either spatial transcriptomics or single‐cell‐resolved in situ hybridization or histochemistry, as was the case here. As such, our neuroanatomy data support the notion that (at least) two subsets of Crh ^+^ neurons exist in the PVN, for which conflicting single‐cell RNA‐seq data have been reported. Even though Scgn expression has not been contested, Fam150b was often not reported by single‐cell transcriptomics. A likely reason for this discrepancy is the low copy number of Fam150b mRNAs per cell, regardless of the sequencing method applied (10× Genomics vs. Smart‐seq; Figure 1C,C 1). Furthermore, many Crh ^+^ neurons expressed Alk, which we considered as a sub‐class marker for this group of neurons. The reason for this is that Alk identifies a subset of Crh ^+^ neurons that (mostly) do not express Scgn.25 Considering that Scgn has been causally associated with the initiation of the HPA axis,26 the subset of Alk ^+^/Crh ^+^ neurons could instead modulate sympathetic output independently31 (Figure 6).
Besides, Alk and Fam150b were found expressed in non‐overlapping populations of neurons in the PVN, thus implying an intercellular ligand‐receptor relationship between them. In the ‘classical’ view of the ARC → PVN circuit controlling eating behaviour, AgRP^+^/NPY^+^ neurons in the ARC are upstream to MC4R^+^/NPY1R^+^ neurons in the PVN.17, 18, 19 Genetic studies demonstrate that AUGα produced by AgRP^+^/NPY^+^ neurons is critical to increase weight gain, as much as ALK in the PVN.31, 35 Nevertheless, our neuroanatomy data uncovered a number of peculiarities, including that Alk expression decorated PVN neurons distinct from those with either Mc4r or Npy1r in the PVN. These data are in accord with those of Ahmed et al.35 Moreover, Fam150b itself was expressed in the PVN, including glutamatergic neurons that co‐expressed Crh mRNA.25 Thus, we resolved conflicting single‐cell RNA‐seq predating our present work,25, 37 and support bona fide Fam150b expression in the PVN. We also entertain the possibility that the few local circuits that exist within the PVN could use AUGα to cross‐modulate neuronal activity. Alternatively, extrahypothalamic efferents originating in the PVN could use AUGα to tune the activity of far‐placed target neurons. Taken together, we suggest that the AUGα‐ALK ligand/receptor pair could influence weight gain via neurocircuits parallel to MC4R^+^ or NPY1R^+^ neurons.
We also determined how PFA injected into an extremity, and producing inflammatory pain acutely, could impact the expression of either Alk or Fam150b, or both. We have shown that Alk expression in the PVN was insensitive to stress, even if a higher proportion of Fos ^+^/Crh ^+^/Alk ^+^ neurons existed due to Fos activation. In contrast, Fam150b mRNA levels increased upon PFA‐induced stress, including within the Fos ^+^/Fam150b ^+^ neuronal population. These data are congruent with the generally accepted notion on ligand rather than receptor‐level regulation of intercellular signaling upon environmental challenges or diseases (sensory modalities, injury models). Notably, Fam150b expression was regulated by peripheral glucocorticoids because the inhibition of glucocorticoid receptors by mifepristone occluded changes in any constellation of (i) the total number of Fam150b^+^, (ii) Fos ^+^/Fam150b ^+^, (iii) Fos ^+^/Crh ^+^/Fam150b ^+^, and (iv) Fos ^+^/Crh ^+^/Alk ^+^ cell populations. Thus, Fam150b in the PVN is likely sensitive to stress in a glucocorticoid‐dependent manner.
Overall, our anatomy data could become conceptually appealing when considering the antagonistic action of CRH and glucocorticoids on eating and metabolism: overexpression of CRH reduces nutrition in fasting mice,67 whereas corticosterone increases appetite by stimulating AgRP^+^ and inhibiting POMC^+^ neurons in the ARC.68 A second subset of Crh ^+^ neurons expressing Fam150b, but not Scgn, could explain the long‐term effect of stress on eating behavior (Figure 6). Scgn ^+^/Crh ^+^ neurons can increase CRH release at the median eminence upon stress, with a subsequent elevation in circulating corticosteroid levels. In contrast, Crh ^+^/Fam150b ^+^ neurons could alter sympathetic outflow upon stress, with their increased activity inferred from the increased presence of Fos. Even though we do not yet know the precise site(s) of AUGα release, we hypothesize that it either provides feed‐forward stimulation to Alk ^+^ neurons locally in the PVN, or as postsynaptic targets of long‐range afferents. Another intriguing observation is the presence of Fam150b in non‐Crh neurons, which suggests broader roles for AUGα‐ALK signaling than previously thought. Overall, we suggest that the sensitivity of AUGα‐ALK signaling in non‐overlapping neuronal subsets in the PVN to stress could be significant to diversify the cellular control of metabolic readiness in fight/flight situations.
AUTHOR CONTRIBUTIONS
Tibor Harkany conceived the project; Spyridon Sideromenos, Robert Schnell, and Tibor Harkany designed experiments; Tibor Harkany procured funding; Laurent Gueissaz and Spyridon Sideromenos performed experiments and analyzed data; Evgenii O. Tretiakov performed data integration and the analysis of single‐cell RNA‐seq data; Laurent Gueissaz and Tibor Harkany drafted the manuscript. All authors have proofread and updated earlier versions of this report.
CONFLICT OF INTEREST STATEMENT
The authors declare that they have no conflict of interest.
CODE AVAILABILITY
The code developed and used in this report has been published at https://harkany-lab.github.io/Gueissaz_2025/03-upset.html#pvn-neurons-from-both-datasets-joined.
Supporting information
FIGURE S1. Expression landscape of common neuropeptides and receptors in the mouse PVN. UMAP plots depict normalized expression levels for selected genes in all neurons retrieved from a reference single‐cell RNA‐seq dataset (Smart‐seq2).25
FIGURE S2. Focused expression of marker and regulatory genes. UMAP plots for the expression of Mc4r, Mc3r, Oxt, Sst, Trh, Grp, Crh, Scgn, Alk, and Penk from 10× data42 mapped onto a reference UMAP from Xu et al.25
FIGURE S3. Expression landscape of neuropeptides and neuropeptide receptors mapped onto an integrated Smart‐seq2 reference. UMAP plots show the expression of genes selected from 10× data42 and mapped onto an integrated reference UMAP from Xu et al.25
FIGURE S4. Quantification of gene expression across neuronal clusters in the PVN. Violin plots illustrate the distribution of normalized expression levels (logcounts) for selected genes across cell clusters (not sorted) identified in the PVN by Smart‐seq2.25 Each violin plot shows the density distribution of expression for a specific gene within a given cluster, providing a quantitative comparison of gene expression profiles across neuronal subpopulations.
FIGURE S5. Effects of sex on mRNA expression in the PVN. Comparison of the number of cells expressing Fos (a), Crh (b), Scgn (c) or Fam150b (d) in the PVN between female and male mice in three experimental conditions (control, ‘30 min’, and ‘2 h’ after stress induction). Results were normalised for the entire PVN. (e) Sex effects of the number of Crh ^+^ neurons expressing Fam150b in the PVN under experimental conditions. (f) Comparison of cell numbers co‐expressing Fos/Fam150b within the PVN in females vs. males. (g) Cell numbers for Fos ^+^/Crh ^+^/Fam150b ^+^ neurons in the PVN of female and male experimental subjects. A p value of <0.05 was considered statistically significant.
FIGURE S6. Colocalization of Alk and Fam150b with other cellular markers in the PVN. Multiple labelling in situ hybridization for Alk and either Npy1r (a) or Mc4r (b) in the PVN. Alk did not seem to co‐localize with either Npy1r or Mc4r, two receptors implicated in the control of metabolism and feeding behaviors.20, 21, 22, 23, 24 (c) Multiple labelling in situ hybridization for Fam150b and Scgn in the PVN. Fam150b and Scgn did not co‐localize in the PVN, confirming earlier data by single‐cell RNA‐seq.25 Open rectangles show the positions of high‐resolution insets (a_1_, b_1_, c_1_), which illustrate mRNA distribution at cellular resolution. Scale bars = 300 μm (overviews) and 30 μm (insets).
The reference list from the paper itself. Each links out to its DOI / PubMed record.
- 1Torres SJ , Nowson CA . Relationship between stress, eating behavior, and obesity. Nutrition. 2007;23:887‐894.17869482 10.1016/j.nut.2007.08.008 · doi ↗ · pubmed ↗
- 2Myers MG , Olson DP . Central nervous system control of metabolism. Nature. 2012;491:357‐363.23151578 10.1038/nature 11705 · doi ↗ · pubmed ↗
- 3Timper K , Brüning JC . Hypothalamic circuits regulating appetite and energy homeostasis: pathways to obesity. Dis Model Mech. 2017;10:679‐689.28592656 10.1242/dmm.026609 PMC 5483000 · doi ↗ · pubmed ↗
- 4Roh E , Song DK , Kim M‐S . Emerging role of the brain in the homeostatic regulation of energy and glucose metabolism. Exp Mol Med. 2016;48:e 216.26964832 10.1038/emm.2016.4PMC 4892882 · doi ↗ · pubmed ↗
- 5Brüning JC , Fenselau H . Integrative neurocircuits that control metabolism and food intake. Science. 2023;381:eabl 7398.37769095 10.1126/science.abl 7398 · doi ↗ · pubmed ↗
- 6Sheng JA , Bales NJ , Myers SA , et al. The hypothalamic‐pituitary‐adrenal Axis: development, programming actions of hormones, and maternal‐fetal interactions. Front Behav Neurosci. 2021;14:601939.33519393 10.3389/fnbeh.2020.601939 PMC 7838595 · doi ↗ · pubmed ↗
- 7Gropp E , Shanabrough M , Borok E , et al. Agouti‐related peptide–expressing neurons are mandatory for feeding. Nat Neurosci. 2005;8:1289‐1291.16158063 10.1038/nn 1548 · doi ↗ · pubmed ↗
- 8Balthasar N , Dalgaard LT , Lee CE , et al. Divergence of melanocortin pathways in the control of food intake and energy expenditure. Cell. 2005;123:493‐505.16269339 10.1016/j.cell.2005.08.035 · doi ↗ · pubmed ↗