Two lysosomal genes ATP13A2 and GBA1 interact to drive neurodegeneration
Mingxue Gu, Jinghan Zhao, Mingxi Deng, Guang Lin, Xueyang Pan, Wenwen Lin, Mengqi Ma, Jinyong Kim, Seul Kee Byeon, Akhilesh Pandey, Lara M. Lange, Chad A. Shaw, Jonggeol Kim, Joanne Trinh, Christine Klein, Oguz Kanca, Joshua M. Shulman, Hugo J. Bellen

TL;DR
This study shows that partial loss of two lysosomal genes, ATP13A2 and GBA1, together cause neurodegeneration in Parkinson's disease.
Contribution
The study identifies a digenic mechanism involving ATP13A2 and GBA1 in Parkinson's disease and reveals how their partial loss synergistically causes neurodegeneration.
Findings
Partial loss of anne (ATP13A2) and Gba1b (GBA1) in flies causes progressive neurodegeneration.
Neurodegeneration is associated with lysosomal dysfunction and elevated glucosylceramide.
Pharmacological interventions can rescue the neurodegenerative phenotypes in flies.
Abstract
Parkinson’s disease (PD) is a genetically complex disorder in which combinations of heterozygous risk variants may contribute to pathogenesis. Many PD risk loci encode lysosomal genes, such as GBA1, a common and potent risk factor, conferring at least a 5-fold increase. However, the mechanisms of GBA1 penetrance remain poorly understood. Using Drosophila melanogaster, we performed a genetic interaction screen of lysosomal storage disorder (LSD) genes to identify dominant modifiers of Gba1b (fly homolog of GBA1). Age-dependent locomotor assessments, electroretinograms (ERG), transmission electron microscopy (TEM) analyses and quantification of dopaminergic (DA) neurons were used to assess the neurodegenerative phenotypes of double heterozygous animals. By combining immunostaining, lipidomics, metabolomics and pharmacological approaches we showed how partial loss of anne (fly homolog of…
Genes, proteins, chemicals, diseases, species, mutations and cell lines named across the full text — each resolved to its canonical identifier and authoritative record.
Click any figure to enlarge with its caption.
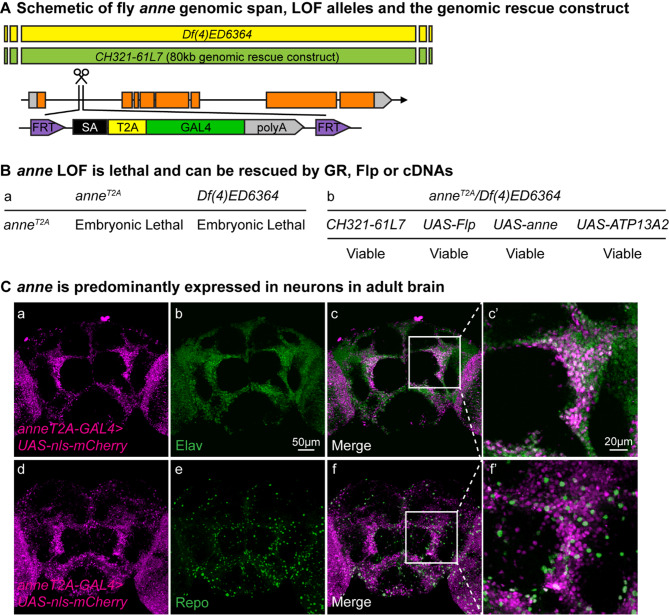 Figure 1
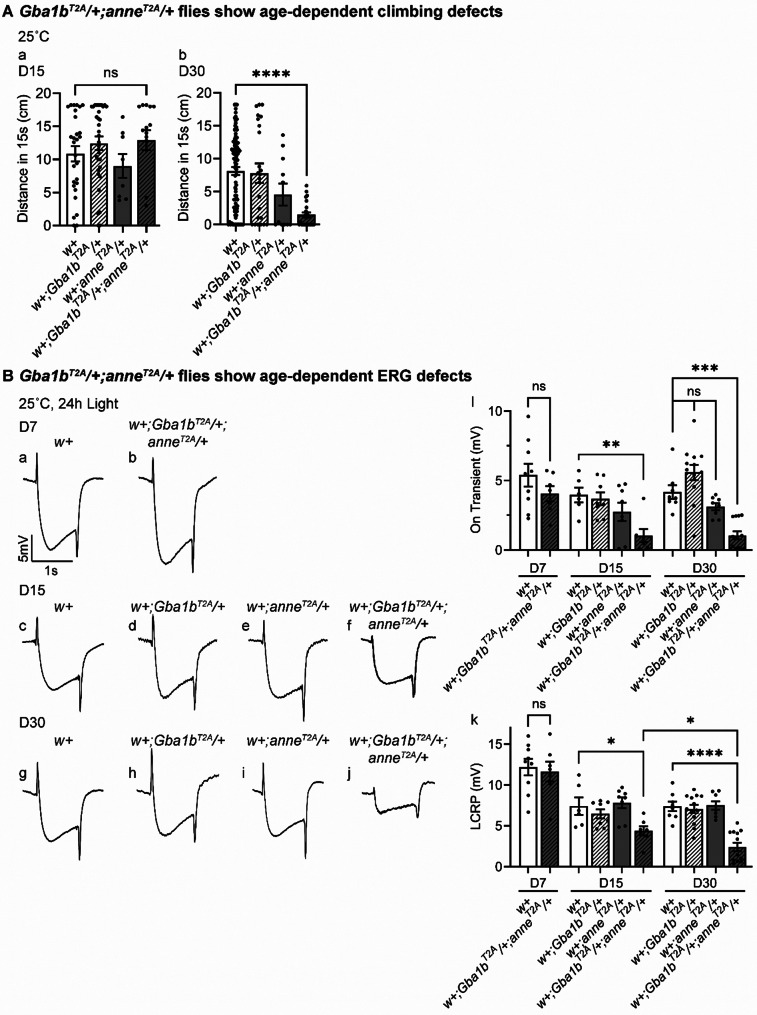 Figure 2
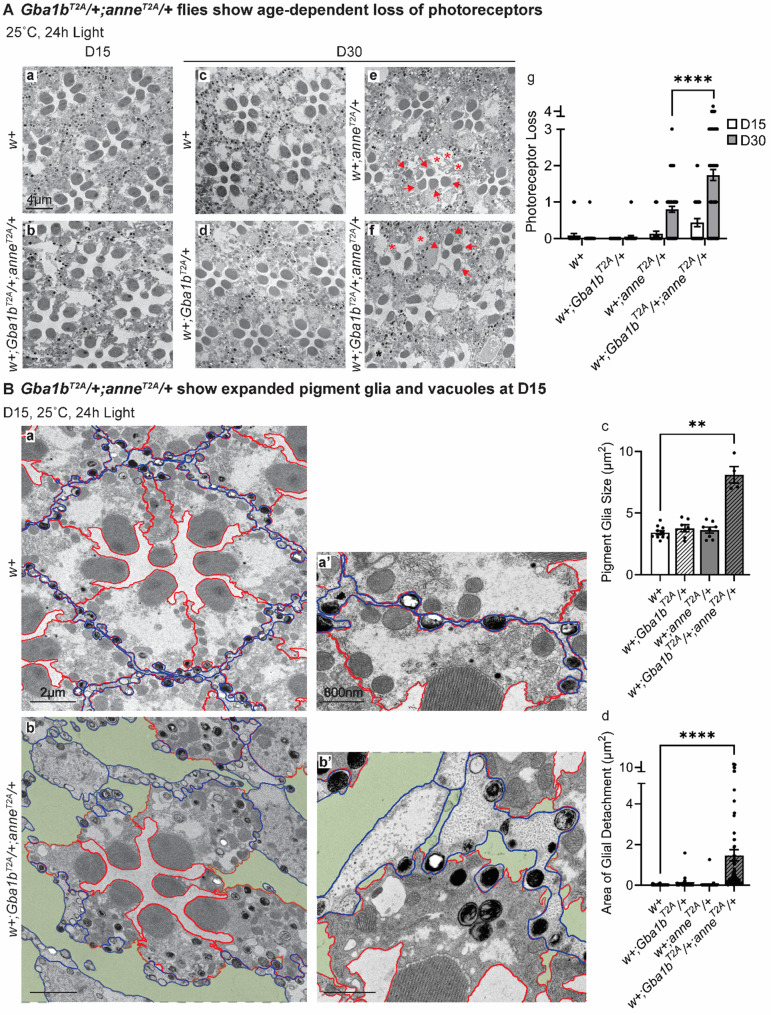 Figure 3
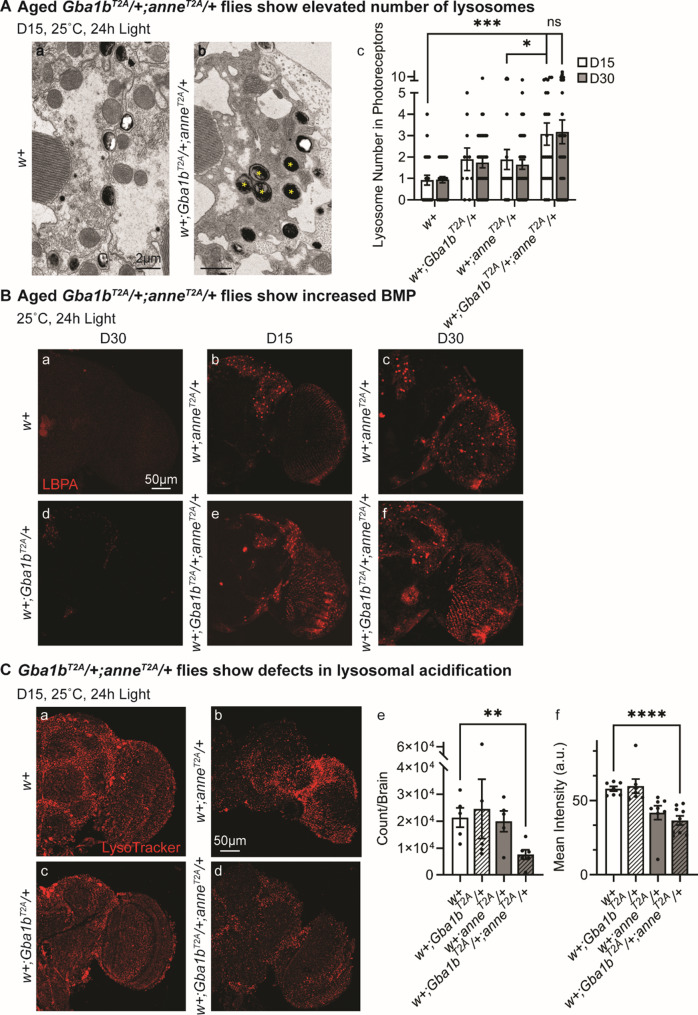 Figure 4
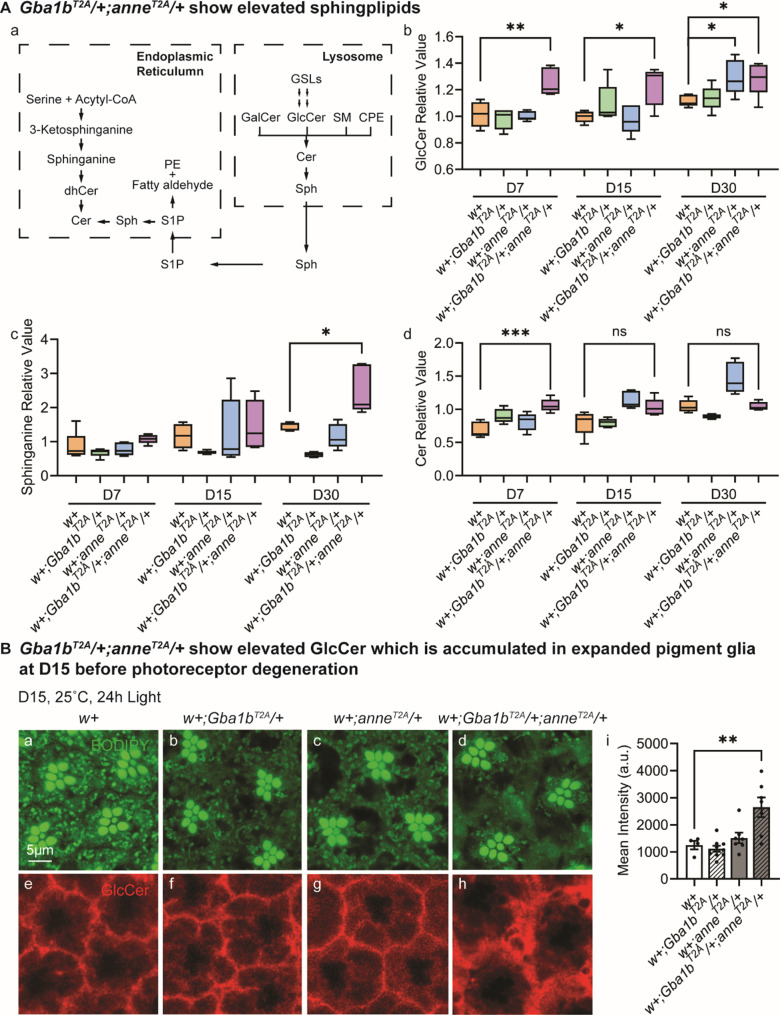 Figure 5
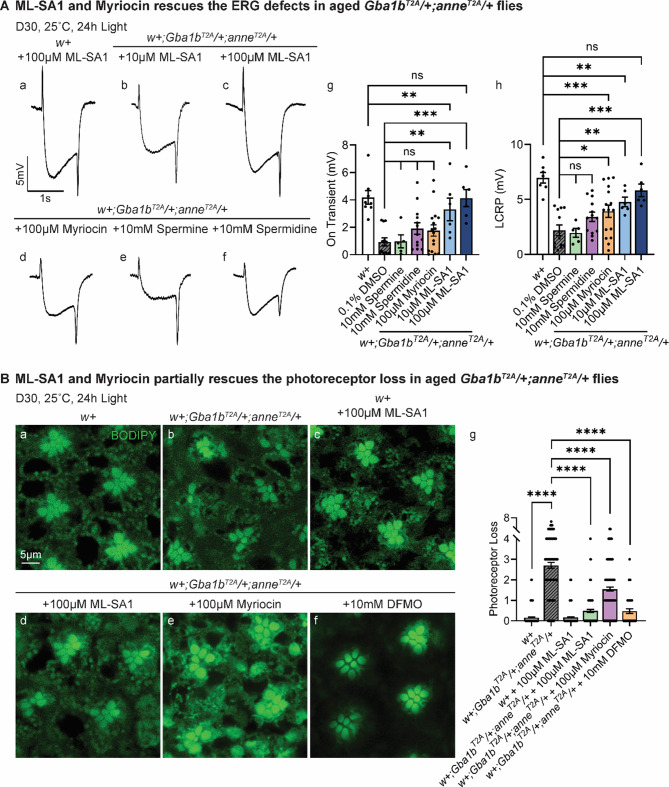 Figure 6
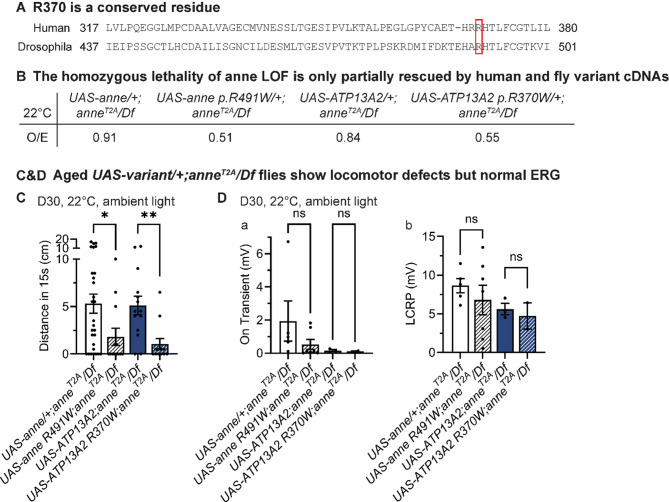 Figure 7
Peer Reviews
No public reviews on file for this paper yet. If you reviewed it on a platform where reviews are public (OpenReview, ICLR, NeurIPS, ICML), you can paste yours below so the community can read it here.
Videos
No videos yet. Explain this paper in a talk, walkthrough, or lecture? Add one.
Taxonomy
TopicsLysosomal Storage Disorders Research · Parkinson's Disease Mechanisms and Treatments · Neurological diseases and metabolism
Background
Parkinson’s disease (PD), the second most common neurodegenerative disorder, is characterized by a progressive loss of dopaminergic neurons in the substantia nigra and the accumulation of α-synuclein-rich Lewy bodies [1–3]. While environmental factors contribute to its etiology, genetic studies increasingly suggest that PD is also a polygenic disorder and that interactions among multiple genetic risk variants drive neurodegeneration [4]. A growing body of evidence also implicates endo-lysosomal dysfunction in PD susceptibility and pathogenesis, linking rare monogenic LSDs with PD [5–10]. The lysosome is a key degradative and signaling organelle that maintains cellular homeostasis [11, 12]. Its dysfunction disrupts proteostasis and lipid metabolism, creating a permissive environment for α-synuclein aggregation, a hallmark of PD [13, 14]. Genome-wide association studies (GWAS) have consistently identified lysosomal genes as significant PD risk loci, and variants in GBA1 have emerged as the strongest genetic risk factor that predisposes to PD [15–18].
Biallelic pathogenic GBA1 variants cause Gaucher disease (GD), an LSD characterized by GlcCer accumulation. In individuals with neuronopathic forms of GD, the variants cause a severe neurodegenerative disease leading to early death [19]. In contrast, heterozygous GBA1 variants do not cause GD, yet they are the most common genetic risk factors for PD, present in 7–15% of individuals with PD and conferring a fivefold increased risk on average [16, 20, 21]. Over 300 pathogenic GBA1 variants have been identified, and severe loss-of-function alleles (e.g., p.L444P, p.N370S) are disproportionately associated with earlier PD onset and rapid progression [16, 22–27]. The link between GBA1 deficiency and PD revolves around sphingolipid dysregulation: GBA1 encodes glucocerebrosidase (GCase), a lysosomal enzyme that hydrolyzes GlcCer into glucose and ceramide [28]. Reduced GCase activity leads to the elevation of GlcCer and its deacylated form, glucosylsphingosine, which stabilize toxic α-synuclein oligomers, inhibit chaperone-mediated autophagy, and decrease α-synuclein degradation [13, 14].
In the Drosophila brain, Gba1b is exclusively expressed in glial cells [29]. We have shown that GlcCer is produced in neurons upon neuronal activity. When the neurons are inactive, GlcCer is internalized through the endo-lysosomal pathway. Fusion of the multivesicular body releases exosomes that contain GlcCer. Upon their uptake in glia, the GlcCer is degraded by the lysosomal Gba1b. Loss of Gba1b results in a progressive lysosomal dysfunction, glial GlcCer accumulation, followed by a neuronal GlcCer accumulation and progressive neurodegeneration, leading to cell death [29]. In contrast, flies heterozygous for Gba1b loss-of-function do not exhibit overt neurological defects.
An exome sequencing study of individuals with PD discovered that 56% of the individuals have at least one putative damaging variant in a lysosomal storage disorder gene and that 21% carry multiple pathogenic alleles [30]. This polygenic risk architecture suggests that cumulative lysosomal dysfunction, rather than isolated gene defects, may drive neurodegeneration in PD [30]. While biallelic mutations in these genes cause severe LSDs, heterozygous variants may act as “risk modifiers”. However, which combinations of such variants interact to breach lysosomal thresholds and how remains poorly understood.
Here, we performed a locomotor screen to identify LSD genes that dominantly interact with GBA1 and discovered that Gba1b and anne, a conserved homolog of the lysosomal transporter, ATP13A2, synergistically drive neurodegeneration. Single heterozygous pathogenic variants in these genes cause no or only minor overt phenotypes, mirroring human heterozygous carriers. However, combined heterozygous loss of anne and Gba1b results in progressive age-dependent locomotor deficits, functional abnormalities, and cell loss. We show that subtle lysosomal dysfunction in glia and neurons induces progressive neurodegeneration. The accumulation of glucosylceramide (GlcCer) in glia emerges as a pathological driver. Notably, enhancing lysosomal trafficking or blocking GlcCer production mitigates these neurodegenerative phenotypes, providing potential therapeutic insights.
Methods
Antibodies, chemicals, and reagents
All reagents and drugs were sourced from EMS, Sigma-Aldrich or Fisher Scientific, unless otherwise specified. A complete list of commercial antibodies, chemicals and assay kits, including vendors and catalog numbers, is provided in Table S5.
Drosophila stocks and husbandry
Mixed sex of flies (approximately 50% male and 50% female) were used for all experiments. Flies were raised on molasses-based food at 25 °C with constant light unless otherwise noted. The full list of genotypes of the flies used can be found in Table S5.
Generation of CRISPR mutants
T2A-GAL4 and Kozak-GAL4 mutant flies were generated as previously described [31, 32]. In brief, for the T2A-GAL4 lines, single guide RNAs (sgRNAs) targeting coding introns of LSD genes were designed, along with a homology donor construct containing 200 bp left and right homology arms. The donor construct, which included sgRNA sites for linearization, was synthesized in the pUC57_Kan_gw_OK vector by Genewiz. sgRNAs targeting LSD genes were cloned into the pCFD3 vector. The sgRNAs, homology arms, and a cassette containing the attP-FRT-splice acceptor-T2A-GAL4-poly(A)-3×P3GFP-poly(A)-FRT-attP sequence were subcloned into a homology intermediate vector derived from pM37, generating the final homology donor vector. For Kozak-GAL4 lines, a homology donor intermediate vector encoding sgRNAs targeting regions upstream and downstream of the coding sequence, as well as an sgRNA for linearization, along with 200 bp homology arms, was synthesized in the pUC57_Kan_gw_OK2 vector by Genewiz/Azenta. The Kozak-GAL4-poly(A)-FRT-3×P3GFP-poly(A)-FRT cassette was subcloned into this vector. Homology donor vectors were injected into nosCas9-expressing embryos. Adult flies were crossed to yw flies, and GFP-positive progeny were selected based on 3×P3-GFP expression in the eyes.
Cloning and transgenics
Human ATP13A2 (NM_022089) cDNA was cloned into the destination vector pGW-attB-HA as previously described. Briefly, cDNA in the pDONR221 entry vector was shuttled into the pGW-attB-HA destination vector using Gateway cloning (LR Clonase II, Invitrogen). The ATP13A2 variant p.R370W was generated via Q5 site-directed mutagenesis (New England Biolabs) in the pDONR221 vector using the following primers:
**Forward: **5′-cccgcagaagagtgtgtgccaccggtgtgtctctgcacagt-3
**Reverse: **5′-actgtgcagagacacaccggtggcacacactcttctgcggg-3
The variant sequence was confirmed by Sanger sequencing following LR recombination. Sequencing primers included gene-specific primers (forward: 5′-aagttgtccatgcgggtgtg-3′; reverse: 5′-atgctgtagatggtgccgag-3′) and standard M13 primers.
For the fly UAS-anne line, the clone in the pDONR223 vector was obtained from the Drosophila Genomics Resource Center (Clone ID: 1650874) and transferred to the pGW-attB-HA destination vector using the same Gateway cloning approach. The anne p.R491W variant was generated using the following primers:
**Forward: **5′-ttgataaaacagagcatgcctggcatacacttttttgtggcac-3
**Reverse: **5′-gtgccacaaaaaagtgtatgccaggcatgctctgttttatcaa-3
The sequence was verified using gene-specific (5′-ctgtctaaagagcttccaacgcga-3′) and M13 primers.
A genomic rescue construct for anne, P{acman;CH321-61L7}, was obtained from BacPac Resources [33]. Transgenic constructs (UAS and genomic rescue) were injected into y w ΦC31 integrase; VK33 (PBac{y[+]-attP}VK00033) embryos. Final transgenic genotypes included: y^1^w^^; PBac{UAS-ATP13A2}VK33/TM3*, y^1^w^^; PBac{UAS-ATP13A2 p.R370W}VK33/TM3*, y^1^w^^; PBac{UAS-anne}VK33/TM3*, y^1^w^^; PBac{UAS-anne p.R491W}VK33/TM3*, and y^1^w^^; PBac{CH321-61L7}VK00033*.
Genetic screen
We used the Drosophila Integrated Ortholog Prediction Tool (DIOPT) [34] to identify all conserved fly orthologs of 48 human lysosomal storage disorder (LSD) genes [35]. Eight genes (ASAH1, GM2A, GALC, HYAL1, NEU1, TPP1, CLN5, CLN6) lack Drosophila homologs and were excluded. For each remaining human gene, we selected high-confidence fly orthologs based on DIOPT rank; when no “high” ortholog existed, we accepted the best forward or reverse match with a DIOPT score ≥10. Nine additional genes (ARSA, GALNS, GAA, CTSA, GNPTG, CLN8, GRN, KCTD7, LAMP2) failed to meet these criteria and were likewise excluded. We also incorporated six fly modifiers of neuronal α-synuclein (αSyn) toxicity identified previously [36]. Null allele stocks for each selected fly ortholog were obtained from the Bloomington Drosophila Stock Center (BDSC); the T2A-GAL4 and Kozak-GAL4 mutant alleles were previously generated in our lab. Nine orthologs were excluded due to the unavailability of null allele stocks. Ultimately, we screened 34 Drosophila genes representing 30 human LSD loci.
A total of 34 T2A-GAL4 or Kozak-GAL4 strains were generated. LSD^T2A^ or LSD^Kozak-GAL4^ strains were crossed with w^1118^;Gba1b^KO^ (Gba1b^STOP^), and F1 LSD^T2A^ or LSD^Kozak-GAL4^/+;Gba1b^STOP^/+ flies were obtained. Locomotor behavior (see below) was assessed in female adult flies at up to 12 time points between 1 and 30 days post-eclosion. To verify hits, we repeated the screen using an independent Gba1b^T2A-GAL4^ null allele and confirmed that all phenotypic interactions were allele-independent.
Robot-assisted locomotor assay
The negative geotaxis climbing assay was conducted using a custom robotic system (SRI International, available at the Automated Behavioral Core of the Duncan Neurological Research Institute), as previously described [37]. Negative geotaxis was induced by tapping custom vials to displace flies to the bottom. Following three taps, high-speed video cameras recorded fly movements at 30 frames per second for 7.5 seconds. For each genotype, 6–8 biological replicates, each consisting of 10–15 female flies, were tested in parallel (biological replicates). Each trial was repeated five times (technical replicates). Replicates were randomly distributed across a 96-vial plate, and all experiments were conducted in a blinded manner. Locomotor performance was quantified based on the average climbing speed in each biological replicate, with individual fly speeds computationally deconvoluted from the video recordings. Robotic assay configuration, video acquisition, and data analysis were performed using the following software packages: Adept Desktop, Video Savant, MATLAB with Image Processing and Statistics Toolkits, RSLogix (Rockwell Automation), and Ultraware (Rockwell Automation). Additionally, custom software was developed for assay control (SRI graphical user interface), analysis [FastPhenoTrack (Vision Processing Software), TrackingServer (Data Management Software), ScoringServer (Behavior Scoring Software)], and visualization [Trackviewer (Visual Tracking Software)].
Locomotor assay data from the robotic Drosophila platform were processed by calculating the mean and standard deviation of climbing speed for each genotype across biological replicates, using the mean() and sd() functions in R. Each experimental genotype was statistically compared to all concurrently tested control genotypes to account for potential temporal and environmental variability. To minimize batch effects, all comparisons were restricted to within-tray analyses. To model age-dependent changes in locomotor performance and assess potential genotype-dependent effects, we employed longitudinal mixed-effects models using the lme4 package in R [38]. These models included a random intercept to account for genotype-level baseline variation and incorporated cubic B-splines to flexibly capture non-linear time-dependent trends [39]. We tested the differences between all possible pairs of genotypes within each tray by testing the interactions between genotypes and their B-splines using one-way ANOVA (aov function in R) with two nested statistical models: (i) a genotype-only model, which tested for mean shifts in climbing speed between genotypes without accounting for changes over time, and (ii) a genotype + time model, which additionally accounted for non-linear time trends. The reported p-values (see Fig. S1) reflect results from both models, with plotted data corresponding to p-values from the genotype + time model. The significance threshold was set at α = 5x10^−4^.
Climbing assay
Flies were collected at eclosion from a 25 °C constant-dark incubator and aged under either constant-dark or constant-light conditions at 25 °C, with transfers to fresh vials every three days. On the day of behavioral assessment, flies were transferred to an empty vial, tapped to the bottom, and their climbing ability (negative geotaxis) was evaluated. The maximum climbing distance was set at 18 cm, and flies were given 30 seconds to climb. Climbing speeds were subsequently calculated based on the distance climbed within this time frame.
Electroretinogram (ERG) recording
ERG recordings followed a previously established protocol [40]. Flies were immobilized on glass slides, and two electrodes filled with 0.1 M NaCl were used: one inserted into the thorax and the other placed on the eye. A 1-second pulse of light was applied, and ERG traces were recorded and analyzed using LabChart 8 Reader.
Transmission electron microscopy (TEM)
Adult fly retinas were prepared for TEM. Fly heads were dissected at 25 °C in fixation buffer containing 2% paraformaldehyde, 2.5% glutaraldehyde, and 0.1 M sodium cacodylate (pH 7.2). Samples were fixed in the same buffer for 48 hours at 4 °C. Following primary fixation, tissues were post-fixed in 1% osmium tetroxide for 40 minutes, then dehydrated through a graded ethanol and propylene oxide series using a Leica EM TP Automated Tissue Processor. Samples were embedded in Embed-812 resin (a mixture of Embed 812, NMA, DDSA, and DMP-30; Electron Microscopy Sciences, Hatfield, PA). Ultrathin sections (50 nm) were cut using a Leica UC7 ultramicrotome and mounted on Formvar-coated copper grids (Ted Pella). Sections were stained with UranyLess and 3% lead citrate (Electron Microscopy Sciences). Images were acquired using a JEOL JEM-1010 transmission electron microscope equipped with an AMT XR-16 mid-mount 16-megapixel CCD camera.
Immunostaining
For immunostaining of fly retina, heads were dissected in cold 1× phosphate-buffered saline (PBS) and fixed in 3.7% formaldehyde (diluted in PBS) overnight at 4 °C. The following day, the retinas were further dissected in cold PBS and refixed in 3.7% formaldehyde for 30 minutes. Samples were washed in 0.1% Triton X-100 in PBS (PBST), then blocked in 5% natural goat serum (NGS) diluted in 0.1% PBST (5% NGST afterward) for 1 hour at room temperature (RT). After blocking, the samples were incubated for 3 overnights at 4 °C with rabbit anti-GlcCer (1:250; RAS_0010, Glycobiotech). After primary antibody incubation, the samples were washed with 0.1% PBST, followed by incubation with Cy5-conjugated secondary antibody (111–175-144, Jackson ImmunoResearch Labs Inc.) for 1 hour at RT. After incubation with secondary antibodies, the samples were stained by BODIPY 494/504 (D3922, Invitrogen) for 30 minutes at RT. After final washes, samples were mounted in VECTASHIELD (H-1000, Vector Laboratories) and stored at −20 °C before imaging with a Leica SP8 confocal microscope. Retinal confocal images were captured 5 μm below the surface. Fluorescent signals were quantified separately for neuronal and glial regions using ImageJ (Fiji) and Adobe Illustrator.
For immunostaining of fly brains, larval and adult brains were dissected in cold PBS and fixed overnight at 4 °C in 4% paraformaldehyde (diluted in PBS). The following day, brains were permeabilized in 0.2% Triton X-100 in PBS overnight at 4 °C, then blocked in 5% NGST under vacuum at RT for 2 hours. Samples were incubated overnight at 4 °C with primary antibodies: mouse anti-CTSL (1:250; MAB22591, R&D Systems), mouse anti-LBPA (1:100; Z-PLBPA, Echelon Biosciences), rabbit anti-TH (1:200; SAB2701683, Sigma-Aldrich), rat anti-Elav (1:250, Rat-elav-7E8A10, DSHB) and mouse anti-Repo (1:50, Mouse-Repo-8D12, DSHB). After washing in PBST, samples were incubated with Cy3-, or Cy5-conjugated secondary antibodies (Jackson ImmunoResearch Labs Inc.) for 1 hour at RT. Finally, samples were mounted in RapiClear (SunJin Lab Co.) and stored at −20 °C before imaging with a Leica SP8 confocal microscope (Leica) or a Zeiss LSM880 confocal microscope (Carl Zeiss). Images were processed using ImageJ (Fiji) and Adobe Illustrator.
Western blotting
Fly heads were homogenized in Modified RIPA buffer (50 mM Tris-Cl, 150 mM NaCl, 1% NP-40, 1% sodium deoxycholate, 0.1% SDS, 50 mM NaF, 1 mM Na_3_VO_4_, 10% glycerol and Roche protease inhibitor mix) on ice. Tissue was removed by centrifugation. Isolated lysates were loaded into 4–12% gels, separated by SDS-PAGE, and transferred to PVDF membranes (Millipore). Primary antibodies used in this study were as follows: mouse anti-Actin (1:10,000; ICN691001, ThermoFisher), rabbit anti-Rab5 (1:1,000; ab31261, Abcam), mouse anti-Dynamin (1:1,000; 610245, BD Biosciences), mouse anti-Rab7 (1:500; Rab7, DSHB), rabbit anti-Phospho-Drosophila-S6K (Thr398) (1:1,000; 9209, CST), rabbit anti-S6K (1:1,000; sc-9027, SCBT), rabbit anti-Drosophila Atg8 (1:1,000; gift from S Zhang), rabbit anti-Ubiquitin (P37) (1:1,000; 58395S, CST). Horseradish peroxidase (HRP)-conjugated secondary antibodies (Jackson ImmunoResearch Labs Inc.) were used at 1:5,000.
Live imaging of LysoTracker
Third instar Drosophila fat bodies or adult brains were dissected in PBS and then stained with 100 nM LysoTracker Red DND-99 (Invitrogen) for 10 min on a shaker. After quickly washing with PBS, samples were mounted in 80% glycerol and were imaged using a Leica SP8 confocal microscope (Leica) or a Zeiss LSM880 confocal microscope (Carl Zeiss).
The number and mean intensity of LysoTracker signals were quantified using Fiji. The images were background-subtracted, and LysoTracker-positive puncta were identified using automatic thresholding. The intensity of each punctum was measured and averaged.
RNA extraction and quantitative real-time PCR
Total RNA was isolated from 30 adult brains using TRIzol (Invitrogen) and samples were treated with Turbo DNA-free kit (Invitrogen). Reverse transcription was performed using a High-Capacity cDNA Reverse Transcription Kit (Applied Biosystems). RT-PCR was performed using Fast SYBR Green Master Mix (Applied Biosystems) and a QuantStudio 5 Real-Time PCR system (Applied Biosystems). RT-PCR was performed with 3 PCR replicates for each biological sample, 3–4 biological replicates. Primers used for the RT-PCR experiments are listed below.
Primers used:
Gapdh: Forward: 5′-CCACTGCCGAGGAGGTCAACTAC-3′; Reverse: 5′-ATGCTCAGGGTGATTGCGTATGC-3′
vha100-2: Forward: 5′-ACCCACTTCAAGCGTTATGC-3′; Reverse: 5′-TGAACACCATGTAGCCGAAG-3′
vhaSFD: Forward: 5′-GATTTGCCTTTGTGGGAGTC-3′; Reverse: 5′-TTGCACCTGGAAGTTGACAC-3′
vha16-1: Forward: 5′-AAGTCTGGTACCGGTATTGC-3′; Reverse: 5′-CCATGACCACAGGAATGATG-3′
vha68-2: Forward: 5′-TCATCATCTACGTCGGTTGC-3′; Reverse: 5′-TACGCTTCATGATGGACTCG-3′
vhaAC45: Forward: 5′-TCCTGATGGGACTGTTTGTG-3′; Reverse: 5′-TGATGTCCATCATCCAGCAG-3′
atg8a: Forward: 5′-ATTCCACCAACATCGGCTAC-3′; Reverse: 5′-GCCATGCCGTAAACATTCTC-3′
vha100-1: Forward: 5′-AGCTGCGTTACCTGGAGAAG-3′; Reverse: 5′-TTCTCAAAGGTGGCCTCCAG-3′
vhaM8.9: Forward: 5′-GTCCCAAGGCAATCAGTTTC-3′; Reverse: 5′-AAGGGATCGTTGATGGTCAG-3′
Untargeted lipid analysis via LC-MS/MS
Lipid extraction
Lipids were extracted from w+, w+;Gba1b^T2A-GAL4^/+, w+; anne^T2A-GAL4^/+, w+;Gba1b^T2A-GAL4^/+;anne^T2A-GAL4^/+ adult fly heads using a neutral and acidic lipid extraction as described previously [41, 42]. In brief, an internal standard mixture containing deuterated lipids was in equal amount across all samples. Each sample was then mixed with methanol:chloroform to a final volume ratio of 2:1 (v/v) and tip-sonicated. The mixture was briefly vortexed and incubated on ice for 10 minutes to ensure thorough extraction. After centrifugation at 13,800 × g for 2 minutes at 4 °C, 950 μL of the supernatant was collected. To extract remaining lipids, the residual layer was further treated with 750 μL of chloroform:methanol:1 M HCl (40:80:1, v/v/v), vortexed for 1 minute, and incubated at room temperature for 15 minutes. Next, 250 μL of ice-cold chloroform and 450 μL of 0.1 M HCl were added, followed by vortexing for an additional minute. After centrifugation at 6,500 × g for 2 minutes at 4 °C, the lower organic phase was collected and pooled with the first extract. Combined organic extracts were dried under vacuum and stored at − 80 °C until LC-MS analysis.
LC-MS/MS for lipidomics
The lipid extracts were analyzed on a Hypersil GOLD Vanquish C_18_ ultrahigh-performance LC (UHPLC) column (150 × 2.1 mm, C_18_ 1.9 μm and 175 Å) using a Fourier transform Orbitrap Fusion Tribrid IQ-X mass spectrometer (Thermo Fisher Scientific) coupled to a Vanquish Horizon UHPLC (Thermo Fisher Scientific) using a data-driven iterative approach as described previously [43]. Untargeted lipidomics were performed as previously described, with modifications. Briefly, a binary gradient at a flow rate of 300 µl min-1 using aqueous phase (water:acetonitrile = 4:6 (vol/vol)) and organic phase (isopropanol:methanol:acetonitrile = 8:1:1 (vol/vol/vol)) with 10 mM ammonium formate and 0.1% formic acid as modifiers was applied to separate the lipids. The organic phase was increased from 20% to 95% over 17 min, maintained at 95% for 3 min and equilibrated to 20% for 5 min for the next injection. The analytical column was maintained at 50 °C. A full-scan mass spectrum (250–1600 m/z in positive ion mode and 200–1600 m/z in negative ion mode) was acquired in the Orbitrap with a resolution of 60,000 at an m/z of 200. MS/MS spectra were obtained at a resolution of 15,000 at an m/z of 200. In positive ion mode, a spray voltage of 3.5 kV and stepped collision energy of 25, 30 and 35% in higher-energy collisional dissociation (HCD) were applied. Collision-induced dissociation (CID) was triggered for ions with detection of m/z 184 in HCD fragmentation. MS^3^ via CID was triggered when neutral loss of fatty acyl chains were detected in the HCD MS/MS for triglyceride characterization. In negative mode, a spray voltage of 2.7 kV and stepped collision energy of 28, 35 and 40% in HCD were used.
MS data analysis for lipidomics
The acquired MS/MS spectra were processed using LipidSearch 5 (Thermo Fisher Scientific) to annotate and quantify lipids. Lipids were annotated by comparing precursor ion masses and corresponding MS/MS spectra against the database. Precursor ion mass tolerance was set to 5 ppm, and fragment ion tolerance was set to 8 ppm. All lipids were normalized by peak area of internal standard sharing the identical head group of lipids.
Metabolon global metabolomics
For each of the twelve genotypes, five pooled biological replicates were prepared, each consisting of 200–250 mixed-sex (1:1 male-to-female ratio) Drosophila heads collected at 7, 15, and 30 days post-eclosion. Heads were isolated by vigorously vortexing snap-frozen flies, followed by separation from bodies using sieves pre-chilled on dry ice. Samples were stored at −80 °C until shipment on dry ice to Metabolon, Inc. for global metabolomic profiling using the HD4 platform. Sample processing, quality control, and initial data analysis were performed by Metabolon. An overview of the HD4 methodology is provided below.
HD4 global metabolomics
Sample processing was conducted using the MicroSTAR system (Hamilton Company), during which recovery standards were added. Proteins were precipitated using methanol under vigorous agitation with the GenoGrinder 2000 (Glen Mills). Following extraction, samples were divided into multiple fractions, dried, and reconstituted in appropriate solvents for analysis. Each sample was analyzed under four chromatographic conditions using a Waters ACQUITY UPLC system coupled to a Thermo Scientific Q-Exactive high-resolution/accurate mass spectrometer. This system was equipped with a heated electrospray ionization (HESI-II) source and operated with an Orbitrap mass analyzer at a resolution of 35,000. Metabolite identification was performed using Metabolon’s automated Laboratory Information Management System, which matches ion features in the samples to a proprietary reference library. This library includes annotated metabolites defined by retention time, accurate mass-to-charge ratio (m/z), preferred adducts, in-source fragmentation patterns, and corresponding MS/MS spectra. All identifications were manually curated through visual quality control using Metabolon’s in-house software. For downstream analysis, raw intensity values for each metabolite were normalized to their internal median. Zero values were imputed using the smallest non-zero value detected for that metabolite across the dataset.
Data analysis
Log-transformed data from Metabolon were used for PCA and heatmap generation. PCA was performed using the prcomp function in R, and the resulting plot was created with ggplot2 (v3.5.1). The heatmap was generated using the pheatmap package (v1.0.12) with scale = “none”. Pathway annotations were derived from the chemical annotation table provided by Metabolon. Boxplots of individual metabolite levels were created using ggplot2 based on batch-normalized-imputed data.
Drug administration in fly food
The following chemical inhibitors were added freshly to the regular fly food at the indicated concentration: 10 μM or 100 μM ML-SA1 (29958, Cayman Chemical), 100 μM Myriocin from Mycelia sterilia (M1177, Sigma-Aldrich), 10 mM Spermine (S3256, Sigma-Aldrich), 10 mM Spermidine (S2626, Sigma-Aldrich), and 10 mM DFMO (gift from Dr. Stewart and Dr. Casero). The flies were transferred to fresh food with or without the drugs every three days.
Identification of PD cases with variants in ATP13A2 and GBA1
The institutional review boards at Baylor College of Medicine (BCM) approved both the biospecimen collection and sequencing (H-50254). Subjects were recruited from the Parkinson’s Disease Center and Movement Disorders Clinic during routine clinic visits between 2022 and 2024. All patients with PD were diagnosed by neurologists with subspecialty training in movement disorders. All participants agreed to provide a blood sample for a biorepository along with clinical and demographic data. We confirmed the presence of heterozygous variants in GBA1 and ATP13A2 within the BCM proband (along with sibling genotypes) using polymerase chain reaction and Sanger sequencing.
To screen for additional individuals carrying pathogenic or risk variants in both GBA1 and ATP13A2, we further leveraged sequencing data generated by the Global Parkinson’s Genetics Program (GP2; https://gp2.org/) [44]. We used Tier 2 short-read sequencing data from GP2 Release 8 (DOI 10.5281/zenodo.13755496), including clinical exome sequencing (CES) data from 10,454 PD patients and genome sequencing (WGS) data from 5,654 PD patients. Tier 2 data access requires approval and a Data Use Agreement signed by the institution. After removing overlapping samples between both datasets, a total of 15,881 individuals with PD remained for further analyses. GP2’s workflow, as well as sequencing, genotyping, processing, and quality control of genetic data within GP2, have been described before [45–47]. Variants in the genes of interest were extracted using PLINK [48, 49] and annotated with ANNOVAR [50, 51]. We used the Gauchian pipeline (https://github.com/Illumina/Gauchian) [52] for WGS data as a variant caller for GBA1. All code generated for this article, and the identifiers for all software programs and packages used, are available on GitHub (link) and were given a persistent identifier via Zenodo.
We also interrogated genome sequencing from the UKBB (UK Biobank) to identify the frequency of ATP13A2 variants in unaffected GBA1 carriers. We accessed UKBB data in June 2025 via DNAnexus under application number 33601. To determine PD status, we used Data Field “Source of report of G20 (parkinson’s disease)” (field 131023). For the sequencing data, we used the DRAGEN population level WGS data (field 24310). WGS processing and quality control has been described elsewhere [53, 54]. The variants in the genes of interest were extracted using PLINK and annotated with VEP [55]. In total, we identified 25,869 GBA1 carrying participants without PD report.
Quantification and statistical analysis
All datasets were analyzed using Microsoft Excel 365 and GraphPad Prism (10.4.2). Statistical comparisons were performed using two-tailed Student’s t-tests or one-way analysis of variance (ANOVA), as appropriate. Sample sizes for fly experiments are provided in Figure legends, with all crosses performed at least three times. Data are presented as mean ± SEM. Statistical significance thresholds are as follows: ns (not significant), p > 0.05; *p < 0.05; **p < 0.01, ***p < 0.001, and ****p < 0.0001.
Results
Gba1b dominantly interacts with anne
In order to test the hypothesis that loss-of-function in other LSD genes may modify GBA1 penetrance in PD, we screened for dominant interactions of Gba1b with other fly orthologues of LSD genes, using a simple climbing assay in aging double heterozygous flies (Gba1b^-^/+;LSD^-^/+). We screened a total of 34 fly orthologues in combination with one Gba1b null allele [56, 57] (Table S1). Alleles for each LSD were crossed with Gba1b^STOP^ (LSD^-^/+; Gba1b^STOP^/+), a severe loss-of-function allele [58].
We measured the negative geotactic response of flies using an automated locomotor behavioral assay [59] and measured climbing speed of adult LSD^-^/+ and LSD^-^/+; Gba1b^STOP^/+ flies longitudinally from day 0 to day 30. The single loss of nine genes—Csp, Ect3, Sgsh, CG5731, Npc1a, Snmp1, Trpml, emp, and anne—causes a significant decline in climbing ability with aging compared to controls (Table S1, Fig. S1A-I). Among these, only anne, the Drosophila ortholog of human ATP13A2, showed a further deterioration in locomotor phenotypes when combined with Gba1b, suggestive of a synergistic interaction (Table S1, Fig. S1I). Hence, we focused on the interaction between anne and Gba1b.
ATP13A2 (or PARK9) encodes a lysosomal ATPase that exports polyamines from the lysosomes and mediates K^+^/H^+^ exchange [60, 61]. Biallelic ATP13A2 variants cause Kufor-Rakeb syndrome, a juvenile-onset parkinsonism with dementia [57]. ATP13A2 deficiency elevates α-synuclein levels and increases neuronal susceptibility to oxidative stress [63–65]. The human ATP13A2 and fly Anne proteins share 36% identity and 52% similarity in amino acid composition (DIOPT score: 13/19) and the protein structures are highly conserved as predicted by AlphaFold [66, 67].
Loss of anne causes embryonic lethality
To assess the phenotypes associated with the loss of function of anne, we used the anne^T2A-GAL4^allele (Material and Methods) as well as a CRISPR allele, anne^1-205AA^ that truncates the protein and only retains 205 of the 1047 amino acids [68] (Fig. S2A). In addition, we used the Df(4)ED6366 (Df for short), which is a chromosomal deletion allele that spans about 120 kb, removing all anne coding sequences [69] (Fig. 1A). Biallelic LoF anne alleles result in embryonic lethality (Fig. 1B, a, Fig. S2B). Moreover, the following three experiments unambiguously show that the embryonic lethality is indeed due to the T2A-GAL4 insertion. First, the lethality is fully rescued by the introduction of one copy of an 80-kb P{acman;CH321-61L7}, a genomic bacterial artificial chromosome (BAC) that contains anne. Second, by using a Flippase (UAS-Flp), the FRT sites that flank the T2A-GAL4 cassette can be utilized to excise the mutant cassette and revert the phenotype. Finally, the GAL4 permits the rescue of embryonic lethality of mutant animals to adult flies by driving the UAS-anne or UAS-human ATP13A2 cDNAs (Fig. 1B, b). The latter also shows that the human protein can fully rescue the loss of the fly gene and that their function is evolutionarily conserved. Fig. 1anne is predominantly expressed in neurons. (A) Genomic structure of anne locus and reagents used in this study. (B) Summary of the lethality phenotype of flies lack anne: (i) y^1^w^^;anne*^T2A-GAL4/T2A-GAL4^, (ii) y^1^w^^;anne*^T2A-GAL4^/Df. Lethality can be fully rescued by a genomic fragment (GR, CH321-61L7), Flippase (UAS-Flp), and reference fly and human cDNAs (n > 100). (C) Expression pattern of anne in the adult brain is visualized using anne^T2A-GAL4^ allele-driven expression of UAS-mCherry.NLS (magenta) co-stained with markers for neurons (Elav) or glia (Repo) (green). Single-layer confocal images from the dashed squares indicate that mCherry is co-localized with Elav (c’) but not Repo (f’). Scale bars, 50 μm and 20 μm. n > 3Fig. 2anne genetically interacts with Gba1b and mediates age-dependent loss of neuronal activity. (A) Climbing ability of flies of the indicated genotypes after 15 or 30 days. w+;Gba1b^T2A^/+;anne^T2A^/+ flies have severe climbing defects at D30. Flies were raised at 25 °C (n > 20). (B) ERG recordings of flies of the indicated genotypes after 7, 15 or 30 days of constant light. w+;Gba1b^T2A^/+;anne^T2A^/+ flies show a reduction of LCRPs and on-transients from D15. The ERG LCRP and on-transient amplitudes are quantified on the right (n > 6). Error bars represent SEM; *p < 0.05, *p < 0.01, p < 0.001, **p < 0.0001Fig. 3Aged Gba1b^T2A^/+;anne^T2A^/+ flies show impaired glial morphology, which precedes neuronal loss. (A) TEM images of fly retinas of the indicated genotypes after 15 or 30 days of constant light. Red arrows point to rhabdomeres. Red asterisks point to vacuoles. The overall morphology of the retina is severely affected in w+;Gba1b^T2A^/+;anne^T2A^/+ flies, whereas the retinas of w+ or w+;Gba1b^T2A^/+ flies do not show obvious defects. w+;anne^T2A^/+ flies show mild defects. The loss of intact photoreceptors per ommatidium is quantified on the right (n > 30). Retinas from 3 animals were quantified. Scale bars, 4 μm. (B) Enlarged TEM images of a single ommatidium of the indicated genotypes after 15 days of constant light. Pigment cells are highlighted in blue. Photoreceptors are highlighted in red. Green marks glial detachment, which is commonly seen in the retina of w+;Gba1b^T2A^/+;anne^T2A^/+ flies, but rarely observed in w+ flies. The size of pigment glia and the area of glial detachment per ommatidium are quantified on the right (n > 20). Retinas from 3 animals were quantified. Scale bars, 2 μm and 800 nm. Error bars represent SEM; *p < 0.05, **p < 0.01, ***p < 0.001, ****p < 0.0001
anne is expressed in neurons
To determine the expression pattern of anne in the central nervous system (CNS), anne^T2A-GAL4^/in(4)ci^D^ animals were used to drive UAS-nls:mCherry, allowing the identification of nuclei of cells that express anne. Co-staining with antibodies against Elav (a neuronal marker) and Repo (a glial marker) revealed that anne is primarily expressed in neurons within the ventral nerve cord of third-instar larvae (Fig. S3A). In adult brains, anne is expressed in most neurons but only in ~10% of glia of all brain regions (Fig. 1C). The anne expression suggests that it is likely expressed in active neurons during development [70]. In summary, anne is mostly expressed in neurons in the CNS.
anne and Gba1b double heterozygous mutants exhibit progressive neurodegeneration
The climbing screen data suggest that anne and Gba1b (Gba1b^STOP^/+;anne^T2A-GAL4^/+) genetically interact to promote neurodegeneration. To validate this interaction, we assayed other combinations of loss-of-function alleles: Gba1b^T2A-GAL4^/+;anne^T2A-GAL4^/+ and Gba1b^STOP^/+;anne^1-205AA^/+ flies. Consistent with our previous observation, both genotypes lead to significant climbing impairments when compared to Canton-S or y^1^w* controls (Fig. 2A and Fig. S2C).Fig. 4. Aged Gba1b^T2A^/+;anne^T2A^/+ flies show an elevated number of lysosomes but reduced lysosomal acidification in the neurons. (A) Enlarged TEM images of a photoreceptor of the indicated genotypes after 15 days of constant light. Yellow asterisks point to lysosomes in the photoreceptors. w+;Gba1b^T2A^/+;anne^T2A^/+ flies exhibit an increased number of lysosomes in photoreceptors at D15 when compared to w+, w+;Gba1b^T2A^/+, or w+;anne^T2A^/+ flies (n > 20). Scale bars, 2 μm. The number of lysosomes in the photoreceptors is quantified on the right. Retinas from 3 animals. (B) Immunostaining of LBPA in the brains of indicated genotypes after 15 or 30 days of constant light. w+;Gba1b^T2A^/+;anne^T2A^/+ flies have increased fluorescent intensity of BMP at D15 when compared to w+ or w+;Gba1b^T2A^/+ flies. w+;anne^T2A^/+ flies show a mild increase in BMP fluorescent intensity. Scale bars, 50 μm. n = 3. (C) Live imaging of LysoTracker Red DN-99 in the brains of indicated genotypes after 15 days of constant light. w+;Gba1b^T2A^/+;anne^T2A^/+ flies show defective lysosomal acidification. Scale bars, 50 μm. The number and fluorescence intensity of the LysoTracker positive puncta are quantified in e and f. Error bars represent SEM; *p = 0.0184, **p = 0.0062, ****p < 0.0001
To assess the roles of anne and Gba1b in neurons and glia, we used the Drosophila visual system as a model. Electroretinogram (ERG) recordings allow us to assess photoreceptor function and synaptic transmission. Wang et al. (2022) [29] documented that prolonged light-induced neuronal activity leads to severe ERG defects when Gba1b is lost. In addition, loss of white exacerbates the phenotypes and loss of white in an otherwise wild-type background leads to a progressive glial dysfunction and accumulation of GlcCer in pigment glia. Hence, we assayed all genotypes in a white+ background (Canton-S (w+), abbreviated w+) or with the Gba1b^STOP^ allele that carries a white+ allele.
To assess if there is a progressive loss of neuronal function, we recorded ERGs in 7-, 15-, or 30-day-old flies exposed to continuous light. Single heterozygous w+;Gba1b^T2A-GAL4^/+ flies or w+;anne^T2A-GAL4^/+ flies do not exhibit ERG defects (Fig. 2B, d, e, h, i, l, k). In contrast, double heterozygous w+;Gba1b^T2A-GAL4^/+;anne^T2A-GAL4^/+ flies display a moderate reduction in light coincident receptor potential (LCRP) amplitudes and on-transients by day 15 (Fig. 2B, f, l, k). However, by day 30, we observe a severe reduction in LCRP amplitude and both on/off-transients (Fig. 2B, j-l). y^1^w;Gba1b*^STOP^/+;anne^T2A-GAL4^/+ and y^1^w;Gba1b*^STOP^/+;anne^1-205AA^/+ flies also show a significant LCRP amplitude decrease compared to y^1^w;Gba1b*^STOP^/+ controls when aged (Fig. S2D). Together, our data show that a partial loss of anne in neurons and Gba1b in glia synergistically disrupts phototransduction and synaptic transmission.
Glial morphology is affected prior to neuronal loss in Gba1b-/+;anne-/+ flies
To investigate the ultrastructural defects, we turned to the fly eye. The fly eye comprises ~750 ommatidia, each containing eight photoreceptor neurons surrounded by pigment glia. We performed transmission electron microscopy (TEM) of flies aged for 15 and 30 days. After 15 days of light exposure, the w+;Gba1b^T2A-GAL4^/+;anne^T2A-GAL4^/+ mutants display a mild loss of photoreceptors (Fig. 3A, a, b, g) while glial cells are obviously disrupted (Fig. 3B, a-b’, circled in blue). While glia in control flies are closely associated with photoreceptors, glia of the double heterozygous mutants are often swollen (Fig. 3B, a-c) and detached from the neighboring photoreceptors (Fig. 3B, a-b’, highlighted in green; 3B, d). In contrast, little to no obvious morphological defects were observed in photoreceptors at day 15 (Fig. 3B, a-b’), indicating that the primary structural abnormalities originate in glia.
By day 30, TEM revealed neurodegenerative phenotypes in w+;Gba1b^T2A-GAL4/^+;anne^T2A-GAL4^/+ mutants, including photoreceptor loss, vacuolization, and glial loss (Fig. 3A, c-g, red arrowheads and asterisks), consistent with the severe ERG defects (Fig. 2B, j-l). In contrast, w+ and w+;Gba1b^T2A-GAL4^/+ controls show no obvious signs of neuronal or glial loss (Fig. 3A, c, d, g). However, w+;anne^T2A-GAL4^/+ flies exhibit a mild photoreceptor and rhabdomere loss along with some vacuolization (Fig. 3A, e, g, red arrowheads and asterisks), but these lesions do not impact ERGs (Fig. 2B, i, l, k). These results clearly indicate that a single-copy loss of anne and Gba1b first affects glial cells, followed by a progressive neuronal loss.
To assess whether this progressive neuronal loss can be observed in other neuronal populations, we stained the brains of w+ and w+;Gba1b^T2A-GAL4^/+;anne^T2A-GAL4^/+ flies with tyrosine hydroxylase (TH) to assess DA clusters distributed throughout the brain. The w+;Gba1b^T2A-GAL4^/+;anne^T2A-GAL4^/+ flies exhibit a ~ 20% reduction in the number of DA neurons in all clusters (Fig. S4). In the PAM cluster, this reduction showed a trend at D15 and was significant by D30 (Fig. S4).
Partial loss of anne and Gba1b enhances endo-lysosomal trafficking
Given that ATP13A2 and GBA1 converge on regulating lysosome function, we evaluated lysosomal function in w+;Gba1b^T2A-GAL4^/+;anne^T2A-GAL4^/+ flies by first assessing lysosomal morphology and abundance. TEM images show that by day 15, there is a significant increase in the number of lysosomes in the photoreceptors of w+;Gba1b^T2A-GAL4^/+;anne^T2A-GAL4^/+ flies when compared to controls (Fig. 4A, indicated by yellow asterisks). The size of lysosomes is not increased. This increase in number is not further elevated at day 30 (Fig. 4A, c).
We next assessed the levels of Cathepsin L (CTSL), a lysosomal luminal enzyme. Immunostaining of aged heterozygous fly brains revealed subtle but significantly elevated CTSL levels (Fig. S5A). Moreover, immunostaining for lysobisphosphatidic acid (LBPA), also known as bis-(monoacylglycero)phosphate (BMP), a lysosomal luminal lipid [71], revealed increased BMP levels in w+;anne^T2A-GAL4^/+ flies, which were further increased in w+;Gba1b^T2A-GAL4^/+;anne^T2A-GAL4^/+ flies (Fig. 4B). Together, these findings indicate enhanced lysosomal biogenesis in the double heterozygous mutant flies. Western blot showed that Rab5, an early endosomal marker, was modestly elevated in double heterozygous animals (Fig. S5B, a, b). In addition, we observed mild increases in Dynamin and Rab7 protein levels at D15 (Fig. S5B, a, c, d). These changes in endosomal proteins are consistent with altered endo-lysosomal pathway regulation. In contrast, no significant changes in the levels of downstream targets of Mitf (microphthalmia-associated transcription factor, or transcription factor EB, TFEB) were detected (Fig. S5C), indicating that canonical TFEB-driven biogenesis [72] is not the primary mechanism underneath the increase in lysosome number.
To assess lysosomal acidification, essential for hydrolase activity, we used a dye that labels acidic vesicles, LysoTracker. In aged adult brains (Fig. 4C) and fat bodies (Fig. S5D), LysoTracker staining was significantly reduced in w+;anne^T2A-GAL4^/+ flies when compared to controls, with a further decrease in w+;Gba1b^T2A-GAL4^/+;anne^T2A-GAL4^/+ flies. This reduction was evident from both the decreased number of LysoTracker-positive lysosomes (Fig. 4C, e; Fig. S5D, e) and the diminished LysoTracker intensity (Fig. 4C, f; Fig. S5D, f), indicating impaired lysosomal acidification.
Lysosomal dysfunction can influence mTor (mechanistic Target of rapamycin) signaling and autophagy [12]. To determine whether mTor activity is altered in w+;Gba1b^T2A-GAL4^/+;anne^T2A-GAL4^/+ flies, we examined the direct targets of the mTORC1 complex. Specifically, we analyzed S6 kinase (S6K) along with its phosphorylated form, p-S6K. No significant changes in protein levels were observed (Fig. S5E, a). To assess autophagy induction, we measured the levels of the autophagic marker Atg8, which also remained unchanged in w+;Gba1b^T2A-GAL4^/+;anne^T2A-GAL4^/+ flies (Fig. S5E, a). Moreover, Western blot analysis of ubiquitin indicates no alterations in ubiquitin-mediated degradation (Fig. S5E, b). These findings show that mTor signaling and autophagy induction are not obviously affected. Hence, lysosomal accumulation likely arises from enhanced endolysosomal flux rather than autophagy induction. In summary, heterozygous loss of anne and Gba1b drives increased lysosomes, but these lysosomes fail to be acidified properly, culminating in lysosomal dysfunction.
Loss of Gba1b causes GlcCer accumulation in the brain
Given that loss of Gba1b impairs glucosylceramide degradation [29, 58], we hypothesized that the heterozygous loss of anne and Gba1b may alter sphingolipid metabolism. In addition, given that anne loss is known to disrupt polyamine metabolism, we also assessed the levels of polyamines [60]. We performed untargeted metabolomics on heads of 1) w+, 2) w+;Gba1b^T2A-GAL4^/+, 3) w+;anne^T2A-GAL4^/+, and 4) w+;Gba1b^T2A-GAL4^/+;anne^T2A-GAL4^/+ flies at days 7, 15, and 30. Across all samples, we detected 780 metabolites, including lipids (Table S2). Principal component analysis (PCA) of these metabolites revealed prominent age-related differences among the four genotypes (Fig. S6A). Further comparisons at each time point identified distinct metabolic changes in double heterozygous animals when compared to controls and single heterozygotes.
Some of the key intermediates of sphingolipid metabolism are shown in Fig. 5A, a. Aberrant profiles were observed in various mutant backgrounds (Fig. 5A, b-d). In double heterozygotes, GlcCer levels were elevated relative to w+ controls as early as day 7 and these persisted through day 30 (Fig. 5A, b). Notably, w+;anne^T2A-GAL4^/+ fly heads also showed a significant GlcCer increase by day 30, approaching the levels observed in the double mutants (Fig. 5A, b). Of the > 10 GlcCer species analyzed, more than five were significantly elevated in day 30 double heterozygotes (Fig. S6B). Moreover, immunostaining for GlcCer of 15-day-old fly retinas showed that the GlcCer levels in the double heterozygous flies were significantly elevated and accumulated in swollen glia (Fig. 5B). Additionally, sphinganine levels were significantly increased in day 30 double heterozygotes compared to controls and single heterozygotes (Fig. 5A, c), suggesting an upregulation of the de novo ceramide biosynthesis pathway in the endoplasmic reticulum (Fig. 5A, a). Ceramide levels showed a modest increase in double heterozygotes at day 7, without further age-dependent accumulation (Fig. 5A, d). Interestingly, w+;anne^T2A-GAL4^/+ flies also exhibited increased ceramide levels at days 15 and 30 (Fig. 5A, d). In summary, these data document a dysregulation in sphingolipid metabolism which is consistent with a defect in the breakdown of GlcCer and a dysregulation of the de novo ceramide synthesis. Fig. 5. Sphingolipid metabolism is dysregulated in Gba1b^T2A^/+;anne^T2A^/+ flies. (A) Sphingolipid metabolism pathways in the ER and lysosome. Cer, ceramide; dhCer, dihydroceramide; GalCer, galactosylceramide; GlcCer, glucosylceramide; CPE, ceramide phosphoethanolamine; SM, sphingomyelin; Sph, sphingosine; S1P, sphingosine-1-phosphate; GSL, glycosphingolipid (a). Fold changes in GlcCer (b), sphinganine (c), and Cer (d) levels in the indicated genotypes at days 7, 15, and 30 (n = 5). (B) BODIPY 493/503 (a-d) and glucosylceramide antibody staining of the retina of indicated genotypes (e-h) after 15 days of constant light. The mean intensity of glucosylceramide is quantified in i (n > 6). Scale bars, 5 μm
Polyamine profiling revealed a general age-dependent increase in polyamine levels. However, no distinct genotype-specific patterns were observed (Fig. S6C, a, b). Notably, spermidine levels were selectively reduced in double heterozygotes by day 30 (Fig. S6C, b, c), while spermine levels remained unchanged (Fig. S6C, b, d). This reduction in spermidine was not detected at day 7 or 15, suggesting that dysregulation emerges later during the progression of neurodegeneration and is not a primary driver.
Although PCA revealed clear age-dependent shifts in metabolite composition, the genotype explained only a small fraction of total variance. This was not unexpected given that all genotypes analyzed were heterozygous for loss-of-function alleles, which are unlikely to produce widespread metabolic remodeling. Instead, PCA performed within individual ages revealed partially overlapping genotype clusters, suggesting subtle but biologically meaningful metabolic differences. Our targeted analyses indicate that these differences are most obvious for specific sphingolipid species, particularly GlcCer and sphinganine, rather than global alterations across the metabolome. Thus, we propose that changes in a limited set of key lipid metabolites, rather than broad metabolic reprogramming, drive the observed neurodegenerative phenotypes.
Improving lysosomal function rescues neurodegenerative phenotypes in Gba1bT2A-GAL4/+;anneT2A-GAL4/+ flies
Given the impairment in lysosomal acidification, we aimed to restore lysosomal function and assessed both physiological function (via ERGs) and tissue morphology (retina structure). ML-SA1, a specific agonist of the lysosomal TRPML1 channel, promotes lysosomal trafficking, enhances lysosomal biogenesis, and stimulates autophagic flux through TFEB activation [73]. Feeding w+;Gba1b^T2A-GAL4^/+;anne^T2A-GAL4^/+ flies ML-SA1 resulted in a dose-dependent rescue of the ERG defects observed in 30-day-old flies (Fig. 6A). Flies treated with 10 µM ML-SA1 exhibited a partial but significant improvement in LCRPs (Fig. 6A, b, g, h), whereas those treated with 100 µM ML-SA1 showed a complete rescue of the on/off transients and LCRP defects (Fig. 6A, c, g, h). Fig. 6. Boosting lysosomal functions rescues the neurodegeneration in aged Gba1b^T2A^/+;anne^T2A^/+ flies. (A) ERG recordings of flies of the indicated genotypes treated with ML-SA1, myriocin, spermine, or spermidine for 30 days in constant light. The reduction in the LCRPs and on/off-transients in w+;Gba1b^T2A^/+;anne^T2A^/+ flies was partially rescued with ML-SA1 and myriocin feeding. The ERG LCRP and on-transient amplitudes are quantified in g and h (n > 6). Error bars represent SEM; **p < 0.01. (B) BODIPY 493/503 staining of the retina of indicated genotypes with drug treatment after 30 days of constant light. The loss of photoreceptors in w+;Gba1b^T2A^/+;anne^T2A^/+ flies was partially rescued with ML-SA1, myriocin, and DFMO feeding. The number of photoreceptors is quantified in g (n > 10). Scale bars, 5 μm
Metabolomics analysis revealed that sphingolipid metabolism is altered in aged w+;Gba1b^T2A-GAL4^/+;anne^T2A-GAL4^/+ flies, accompanied by some dysregulation of polyamine levels. To assess the impact of these metabolic changes, we treated flies with a drug that inhibits sphingolipid synthesis and supplemented the food with polyamines and difluoromethylornithine (DFMO). Treatment with myriocin, a compound that reduces de novo synthesis of ceramide and its derivatives, partially but significantly restored ERG responses in 30-day-old double heterozygous fly eyes (Fig. 6A, d, g, h). In contrast, supplementation with polyamines, including 10 mM spermine or 10 mM spermidine, failed to significantly improve ERG defects in aged w+;Gba1b^T2A-GAL4^/+;anne^T2A-GAL4^/+ flies (Fig. 6A, e, f, g, h). Interestingly, inhibiting polyamine synthesis utilizing 10 mM DFMO, a drug that reduces the activity of ornithine decarboxylase, an enzyme that is required for polyamine biosynthesis [74–76] (Fig. S6C, a), partially rescued the climbing and nearly fully rescued the ERG defects in 30-day-old flies (Fig. S7).
To assess photoreceptor morphology, we stained retinas with BODIPY 493/503, which labels neutral lipids and highlights rhabdomeres as well as other retinal structures. BODIPY staining revealed a partial but significant suppression of photoreceptor loss in double heterozygous mutant flies treated with 100 µM ML-SA1, 100 µM myriocin, and 10 mM DFMO (Fig. 6B). Taken together, these findings demonstrate that enhancing lysosomal function can partially rescue the neurodegenerative phenotypes in w+;Gba1b^T2A-GAL4^/+;anne^T2A-GAL4^/+ flies. Cer/GlcCer accumulation is a driver of the neurodegenerative phenotypes, and polyamine imbalance also plays a role in the neurodegenerative process.
Double heterozygous loss-of-function variants in GBA1 and ATP13A2 in individuals with PD
To translate our findings, we interrogated available human genetic data and explored whether digenic variation in GBA1 and ATP13A2 may interact to drive PD in humans. We first interrogated our local collection of PD cases with genome sequencing from Baylor College of Medicine (n = 149; mean age = 65; 37% female). Overall, 9 cases were carriers of established GBA1 risk alleles for PD, including a single case that was double heterozygous for GBA1 (p.T408M) as well as a variant in ATP13A2 (p.R370W). This individual had onset of unilateral rest tremor and gait/balance difficulty in his 60s, a positive dopamine transporter scan, and was levodopa responsive, consistent with typical PD. Family history was notable for PD in the individual’s father with disease onset in his 80s. Besides the GBA1 and ATP13A2 variants, there were no other rare variant PD risk alleles detected in the individual’s genome.
The GBA1 p.T408M variant is an established, mild loss-of-function allele that reduces GCase activity to approximately 60% and has been associated with a 1.4 to 5-fold increased risk of PD [77–80]. However, the ATP13A2 p.R370W variant has not been previously linked to Kufor-Rakeb syndrome or parkinsonism. In public databases of control individuals, ATP13A2 p.R370W is rare (freq. = 4.21x10^−5^) (gnomAD), and is predicted to be likely damaging based on multiple bioinformatic prediction tools (CADD score = 24.9) [81]. Arginine 370 falls within the cytosolic ATP-binding domain of ATP13A2, and this residue is conserved in Drosophila anne, where it corresponds to R491 (Fig. 7A). To determine whether anne p.R491W is a loss-of-function mutation, we expressed the variant using the T2A-GAL4/Df > UAS-anne p.R491W system. While lethality in anne^T2A-GAL4^/Df flies was fully rescued by wild-type anne cDNAs (Fig. 1B, b), the R491W variant only achieved ~50% rescue (Fig. 7B). A similar partial rescue was observed using the human ATP13A2 p.R370W cDNA (Fig. 7B). We then evaluated the motor function and retinal physiology of flies rescued with the variant proteins. Climbing assays revealed that 30-day-old UAS-ATP13A2 p.R370W/+;anne^T2A-GAL4^/Df and UAS-anne p.R491W/+;anne^T2A-GAL4^/Df flies exhibited a significantly reduced locomotor activity (Fig. 7C). However, their ERG responses were not significantly affected (Fig. 7D). These findings indicate that ATP13A2 p.R370W is a partial loss-of-function allele.Fig. 7anne p.R491W is a weak loss of function allele. (A) Amino acid conservation of a portion of the fly and human ATP13A2 proteins. (B) The rescue ability of reference and variant fly and human cDNAs. UAS-anne or UAS-ATP13A2 Ref almost completely rescues the lethality of anne LoF mutants. UAS-anne p.R491W or UAS-ATP13A2 p.R370W partially rescues lethality (n > 100). (C) Climbing analysis of the flies of the indicated genotypes after 30 days of ambient light. UAS-anne p.R491W/+;anne^T2A^/Df and UAS-ATP13A2 p.R370W/+;anne^T2A^/Df flies exhibit climbing defects. Flies were raised at 22 °C (n > 20). (D) Analysis of ERG recordings of flies of the indicated genotypes after 30 days of ambient light. UAS-anne p.R491W/+;anne^T2A^/Df and UAS-ATP13A2 p.R370W/+;anne^T2A^/Df flies show no changes in LCRP or on-transient amplitudes compared to UAS-anne/+;anne^T2A^/Df and UAS-ATP13A2/+;anne^T2A^/Df flies (n > 6). Error bars represent SEM; *p < 0.05, **p < 0.01
In order to better estimate how frequently digenic variants in GBA1 and ATP13A2 are found in PD, we interrogated clinical exome and genome sequencing from 15,881 individuals with PD from the Global Parkinson’s Genetics Program (GP2) [44, 47] (Tables S3 and S4). GBA1 risk variants were identified in 1292 individuals. Among those 1292 GBA1-PD cases with heterozygous GBA1 variants, we identified 5 additional cases with three different heterozygous likely pathogenic ATP13A2 variants (p.Y1020Tfs3, p.Q635, c.477+2T > G) (Table S3) (freq. = 0.39%). In addition, we discovered 2 more individuals with heterozygous ATP13A2 variants among 210 GP2 cases recruited with previously known GBA1-PD, both with GBA1 p.N409S and ATP13A2 p.Y1020Tfs*3. Lastly, to estimate the population background frequency of digenic putative pathogenic variants in GBA1 and ATP13A2, we interrogated genome sequence data from the United Kingdom Biobank (UKBB). Among 25,869 heterozygous unaffected carriers of GBA1 risk alleles (without known PD), we found 17 individuals also carrying a likely pathogenic variant in ATP13A2 (freq. = 0.06%). Our results are therefore suggestive of a higher rate of heterozygous mutations in ATP13A2 among individuals with *GBA1-*PD.
Discussion
The aim of our study was to test the hypothesis that partial loss-of-function in LSD genes may modify GBA1-PD penetrance. We observed that partial loss of Gba1b and anne, the fly orthologs of GBA1 and ATP13A2 in humans, synergistically promote neurodegeneration by affecting lysosomal function and disrupting sphingolipid metabolism. These findings provide experimental support for the hypothesis that GBA1 penetrance is influenced by additional genetic modifiers. Given that anne is expressed in neurons and Gba1b in glia throughout development and adulthood, these phenotypes result from an aberrant neuron-to-glia crosstalk.
Increased GlcCer production in neurons affects glial morphology prior to neuronal insults
The time course and spatial progression of neurodegeneration in our model highlights a critical role for neuron-glia crosstalk in maintaining metabolic homeostasis. The first severe phenotype that we observed is an obvious disruption of the morphology of glia that surround the photoreceptors. This disruption was associated with a subtle loss of function in ERGs as well as a subtle neuronal loss, suggesting that glia are early drivers in the pathology (Fig. 3). This finding is consistent with observations from zebrafish and mouse models, where microglial activation and astrocytic dysfunction occur prior to neuronal degeneration in GBA-deficient contexts [82–84]. Our previous studies have established the importance of neuron-to-glia lipid trafficking, wherein neurons produce GlcCer that is released for uptake in glia upon a glial signal: secretion of TGF-β in vertebrate cell cultures or Dpp/Daw in Drosophila. When glial Gba1b function is lost, GlcCer accumulates, first in glia, then in neurons [29]. However, w+;Gba1b^T2A^/+ flies showed no overt neurological defects and no increase in GlcCer (Figs. 2, 3A, 5), suggesting that one wild type Gba1b allele is sufficient for proper glial and neuronal function. However, loss of a single copy of ATP13A2/anne in the w+;Gba1b^T2A^/+ flies may lead to increased GlcCer production, which is exported from neurons to glia, where it may overwhelm the glial degradative capacity in heterozygous cells and cause cellular toxicity. Consistent with this hypothesis, lipidomic analyses revealed that GlcCer in w+;Gba1b^T2A^/+;anne^T2A^/+ flies is elevated when compared to w+ or Gba1b or anne single heterozygotes (Fig. 5A, b and Fig. S6B). This is accompanied by a progressive increase in sphinganine levels (Fig. 5A, c), a product of the de novo ceramide synthesis pathway. Interestingly, ceramide synthesis has been reported to be upregulated in the cingulate gyrus of PD patients carrying a GBA1 mutation [85]. Sphinganine accumulation has also been reported in the substantia nigra of MPTP (1-methyl-4-phenyl-1,2,3,6-tetrahydropyridine)-treated mice [86], a PD model in which this neurotoxin destroys nigrostriatal dopaminergic neurons [87]. Similarly, in human studies, increased ceramide levels have been detected in plasma, serum, cerebrospinal fluid, and brain tissue of PD patients [88–94]. Our data documents an early ceramide accumulation starting at day 7 in double heterozygous flies (Fig. 5A, d). Given the well-established neurotoxicity of elevated ceramide levels in various fly PD models, including loss of PLA2G6, synuclein overexpression, VPS35 loss [95], and Pink1 loss [96, 97], these findings support a pathological role for sphingolipid imbalance. Importantly, treatment with myriocin partially rescues ERG defects and retinal degeneration in double heterozygotes (Fig. 6), implicating GlcCer accumulation and broader sphingolipid dysregulation as key drivers of glial and neuronal dysfunction.
Interestingly, the gene required for GlcCer synthesis is expressed in neurons but not in glia. The presence of GlcCer in glia therefore depends on export and subsequent uptake of exosomes from neurons. Indeed, immunostaining of 15-day-old double heterozygous retina demonstrated an accumulation of GlcCer in the pigment glia, but not in neurons (Fig. 5B). Notably, the GlcCer immunostaining also revealed a glial expansion and vacuolization (Fig. 5B), consistent with the TEM data (Fig. 3) that glial morphological changes and dysfunction occur prior to photoreceptor degeneration. Accumulation of GlcCer persisted on day 30 in fly retina immunostaining, when severe neurodegeneration was observed. At this stage, GlcCer was detected in both pigment glia and the photoreceptors in the w+;Gba1b^T2A^/+;anne^T2A^/+ retina, suggesting a potential defect in neuron-to-glia GlcCer transport (Fig. S8). In the absence of neuronal activity, neurons do not produce GlcCer and we have previously shown that neuronal activity strongly promotes GlcCer production using several stimulation paradigms, including light [29]. We therefore tested whether reducing neuronal activity could mitigate degeneration in w+;Gba1b^T2A^/+;anne^T2A^/+ flies. Indeed, w+;Gba1b^T2A^/+;anne^T2A^/+ flies reared in constant darkness to eliminate light-dependent photoreceptor activity maintain robust ERG responses even at day 45 (Fig. S9). This supports a model in which w+;Gba1b^T2A^/+;anne^T2A^/+ neurons produce too much GlcCer leading to an overload of partially compromised glial lysosomes with GlcCer, leading to dysfunctional glial cells with morphological defects that are already obvious at day 15 (Fig. 3).
ATP13A2-associated polyamine changes contribute to neurodegeneration
Complete loss of ATP13A2 disrupts lysosomal polyamine export, leading to intralysosomal accumulation and a net decrease in total cellular polyamines compared to controls [60]. Whether heterozygous loss yields a similar polyamine deficit remains unknown. In mice, heterozygosity for an ATP13A2 knockout allele triggers microgliosis and astrocytosis in cortex and hippocampus by 18 months [98]. In Drosophila, anne single heterozygous mutants exhibit mild photoreceptor dysfunction [99], and anne knockdown in α-synuclein-expressing animals impairs locomotion [100]. Consistent with these observations we observe modest age-dependent locomotor deficits (Fig. 2A, b) and photoreceptor degeneration (Fig. 3A, e, g) in day-30 w+;anne^T2A^/+ flies. Whether these phenotypes arise from altered polyamine handling is unclear.
Metabolomic profiling of w+;anne^T2A^/+ heads revealed no significant changes in polyamine levels. In contrast, w+;Gba1b^T2A^/+;anne^T2A^/+ flies exhibited reduced levels of spermidine and acetyl-spermidine at day 30 (Fig. S6C, a-c), a time point at which significant neurodegeneration is already evident. However, dietary polyamine supplementation only modestly improved neurodegeneration (Fig. 6A). On the other hand, DFMO showed rescue in climbing and ERG assays as well as photoreceptor loss (Figs. S7 and 6B), suggesting that inhibiting polyamide synthesis can partially reverse the neurodegenerative phenotypes. This is surprising as we did not detect a significant increase in polyamine levels in our metabolomics assay. However, the number of polyamines we detected using our panel was quite limited. Since ATP13A2 functions in exporting polyamine into the cytosol, partial loss-of-function of ATP13A2 may result in a compensatory elevation in polyamine synthesis in the cytosol. Excess cytosolic polyamine levels can lead to toxicity [101], and DFMO is known to reduce the cytoplasmic levels of polyamines [74–76]. Detailed mechanisms may require further investigation, but the DFMO data indicates that polyamine imbalance plays a role in driving neurodegeneration.
Neuronal endo-lysosomal acidification defects may drive excess GlcCer export from neurons, thereby promoting both glial and neuronal dysfunction
ATP13A2 has been shown to be a cotransporter of K^+^ and H^+^ across the late-endosomal/lysosomal membrane [61]. Consistent with this observation, we found that lysosomal acidification is modestly compromised in 15-day-old w+;anne^T2A^/+ flies. However, lysosomal acidification is severely affected in w*+;Gba1b*^T2A^/+;anne^T2A^/+ animals (Fig. 4C). Moreover, at day 15, photoreceptors of w+;Gba1b^T2A^/+;anne^T2A^/+ flies exhibit an increase in lysosome number (Fig. 4A), and by day 30, we observe aberrant lysosomes (Fig. 3A). Indeed, TEM images do not reveal obvious lysosomal enlargements, but many of the phenotypes we documented mirrored typical changes seen in human LSDs, such as increased lysosome number due to enhanced biogenesis [102, 103], the presence of electrodense, partially degraded material, and multi-membrane structures [104, 105]. Although we did not detect elevated TFEB-mediated biogenesis (Fig. S5D), we found that several endosomal proteins, Rab5, Rab7, and Dynamin (Fig. S5B), are modestly upregulated. In addition, the levels of two lysosomal markers (CTSL and BMP) are also upregulated (Figs. 4B, S6A). These data are consistent with an increase in endocytic flux.
Most LSD phenotypes arise from secondary storage and trafficking defects rather than the primary enzyme deficiency [73, 106]. Therefore, boosting lysosomal function and membrane trafficking can clear aggregated compartments and confer protection. For example, in Niemann-Pick C models, activation of the lysosomal Ca^2+^ channel TRPML1 enhances exocytosis of lysosomes and clears cholesterol-filled lysosomes [73]. Similarly, ML-SA1 treatment in our w+;Gba1b^T2A^/+;anne^T2A^/+ model nearly fully rescued photoreceptor function and ERG defects (Fig. 6). These data suggest that enhancing lysosomal exocytosis and membrane trafficking is sufficient to reverse neurodegenerative phenotypes.
Taken together, our data suggest that loss of anne disrupts neuronal GlcCer trafficking, augmenting its transfer to glia in an activity-dependent manner. While lysosomal dysfunction clearly contributes, the mechanistic link between impaired acidification and GlcCer accumulation remains to be defined. GlcCer is synthesized from ceramide in the neuronal Golgi [107–110] and trafficked to the plasma membrane [111]. Once GlcCer reaches the plasma membrane, it can be internalized through endocytic pathways [112, 113] and sorted into multivesicular bodies for exosomal release [29]. Photoreceptor activity drives extensive membrane remodeling [114–117], which may underlie high rates of GlcCer turnover and transfer to glia. Recent work implicates the Commander and the retromer complexes, which are required for endosomal sorting, in modulating glucocerebrosidase (GCase) activity and PD risk, further linking endo-lysosomal trafficking to GlcCer metabolism [95, 118].
During endolysosomal maturation, progressive luminal acidification orchestrates cargo sorting and membrane identity. Disruption of this pH gradient, through V-ATPase inhibition or lipid accumulation, impairs sorting complexes and intraluminal vesicle (ILV) formation, yielding aberrant multivesicular bodies and increased ILV/exosomal release of undegraded cargo [119–121]. Since BMP marks ILVs within both lysosomes and the late endosomal MVBs [122, 123], the increased BMP staining we observe may also reflect elevated ILV/exosome production (Fig. 4B). Moreover, impaired lysosomal function was associated with EV biogenesis [124, 125]. Thus, loss of anne likely impairs late-endosomal/lysosomal pH, promoting GlcCer transport via exosomes because of defective endo-lysosomal trafficking.
Relevance for GBA1-PD
GBA1 causes an approximately 5-fold increased risk of PD [16, 126]. Mutations causing more severe loss of GCase enzymatic activity are associated with increased penetrance for PD and greater risk of PD related cognitive impairment, supporting a loss-of-function mechanism [127]. Whereas Gaucher’s disease requires a loss of more than 85% of the GCase activity [128], increased PD risk maybe seen with as little as 30% reduction, such as in heterozygous individuals with the GBA1 p.T408M variant [129, 130]. Besides, GBA1 PD risk variants have been identified in other genes that cause LSDs, including ARSA, GALC, and SMPD1[3]. A burden of rare damaging variants among LSD genes has also been associated with PD risk, and up to one-fifth of PD cases may have multiple such variants [30, 131]. These results are consistent with a possible oligogenic model in which genetic variants in other genes may interact with GBA1 heterozygosity to modify PD penetrance. In our local PD sample, we identified an individual with *GBA1-*PD who was also a carrier of a novel loss-of-function variant in ATP13A2 (p.R370W) (Fig. 7). Additional data mining in the GP2 cohort identified additional PD cases with double heterozygous variants in GBA1 and ATP13A2, consistent with a digenic model (Table S3). Our results are consistent with a prior study highlighting an increased frequency of ATP13A2 heterozygous variants among individuals with PD [132].
Conclusions
Our findings demonstrate that cell-type–specific lysosomal gene haploinsufficiency cooperatively impairs lysosomal acidification and elevates glucosylceramide, initiating a neuron-glia cross-talk failure and neurodegeneration in Drosophila. These results substantiate a mechanistic framework whereby subtle, combined lysosomal defects—as seen in human heterozygous carriers of GBA1 and ATP13A2 variants—drive PD pathology. The reversal of these defects by ML-SA1, myriocin, and DFMO underscores the translational potential of targeting lysosomal membrane trafficking, sphingolipid metabolism and polyamine imbalance for early therapeutic intervention in polygenic neurodegeneration.
Electronic supplementary material
Below is the link to the electronic supplementary material.
Supplementary Material 1 Supplementary Material 2 Supplementary Material 3 Supplementary Material 4 Supplementary Material 5
The reference list from the paper itself. Each links out to its DOI / PubMed record.
- 1Spillantini MG, Schmidt ML, Lee VMY, Trojanowski JQ, Jakes R, Goedert M. α-synuclein in Lewy bodies. Nat. 1997, Aug 28;388(6645):839–40. 10.1038/421669278044 · doi ↗ · pubmed ↗
- 2Fearnley JM, Lees AJ. Ageing and Parkinson’s disease: substantia nigra regional selectivity. Brain. 1991, Oct 1;114(5):2283–301. 10.1093/brain/114.5.22831933245 · doi ↗ · pubmed ↗
- 3Ye H, Robak LA, Yu M, Cykowski M, Shulman JM. Genetics and pathogenesis of Parkinson’s syndrome. Annu Rev Pathol. 2023, Jan 24;18:95–121. 10.1146/annurev-pathmechdis-031521-034145 PMC 1029075836100231 · doi ↗ · pubmed ↗
- 4Nalls MA, Blauwendraat C, Vallerga CL, Heilbron K, Bandres-Ciga S, Chang D, et al. Identification of novel risk loci, causal insights, and heritable risk for Parkinson’s disease: a meta-analysis of genome-wide association studies. Lancet Neurol. 2019, Dec 1;18(12):1091–102. 10.1016/S 1474-4422(19)30320-5PMC 842216031701892 · doi ↗ · pubmed ↗
- 5Kalia LV, Lang AE. Parkinson’s Disease. Lancet. 2015, Aug 29;386(9996):896–912. 10.1016/S 0140-6736(14)61393-325904081 · doi ↗ · pubmed ↗
- 6Moors T, Paciotti S, Chiasserini D, Calabresi P, Parnetti L, Beccari T, et al. Lysosomal dysfunction and α-synuclein aggregation in Parkinson’s disease: diagnostic links. Mov Disord. 2016, Jun 1;31(6):791–801. 10.1002/mds.2656226923732 · doi ↗ · pubmed ↗
- 7Wong YC, Krainc D. Lysosomal trafficking defects link Parkinson’s disease with Gaucher’s disease. Mov Disord. 2016, Nov 1;31(11):1610–18. 10.1002/mds.26802 PMC 595728927619775 · doi ↗ · pubmed ↗
- 8Coukos R, Krainc D. Key genes and convergent pathogenic mechanisms in Parkinson disease. Nat Rev Neurosci. 2024, Jun;25(6):393–413. 10.1038/s 41583-024-00812-238600347 · doi ↗ · pubmed ↗