Evolutionary mobility and genetic dynamics of MORFFO genes: shuttling among ancient plant lineages
Paulo H. Labiak, Li‐Yaung Kuo, Blake D. Fauskee, Kenneth G. Karol

TL;DR
This paper explores mobile genes in ferns called MORFFOs, which behave differently from typical plant genes and may spread through horizontal gene transfer.
Contribution
The study reveals MORFFOs as dynamic, potentially selfish genetic elements with unique evolutionary patterns in ferns.
Findings
MORFFOs show high substitution rates and distinct codon preferences compared to other plastid genes.
Phylogenetic analysis suggests MORFFOs replicate outside plastids and may spread via horizontal gene transfer.
MORFFOs are under purifying selection but exhibit dynamic locations and genealogies.
Abstract
Plastid genomes (plastomes) of land plants are characterized by their architectural and genic content stability. However, fern plastomes exhibit unexpected dynamism, characterized by the presence of mobile protein‐coding genes (CDS) – Mobile Open Reading Frames in Fern Organelles (MORFFOs).We investigate the evolutionary dynamics of MORFFOs in 30 species of Anemiaceae (Schizaeales), an ancient lineage of ferns, focusing on their transposition, substitution patterns, codon usages, and RNA editing patterns.MORFFOs expand plastome size and occur in diverse intergenic regions, exhibiting dynamic locations, genealogies, and exceptionally high substitution rates compared with canonical plastid CDS. Sliding window and codon usage analyses demonstrate that MORFFOs are under purifying selection but exhibit distinct codon preferences that deviate from those of other plastid CDS, suggesting…
Genes, proteins, chemicals, diseases, species, mutations and cell lines named across the full text — each resolved to its canonical identifier and authoritative record.
Click any figure to enlarge with its caption.
 Fig. 1
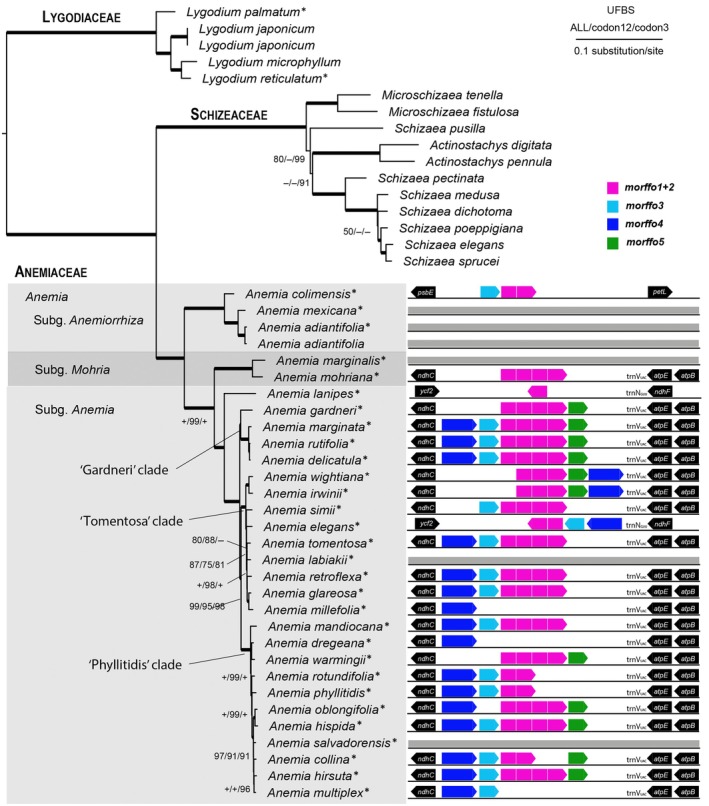 Fig. 2
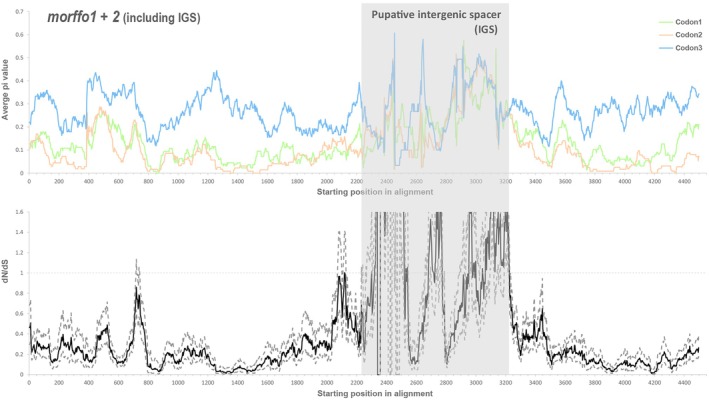 Fig. 3
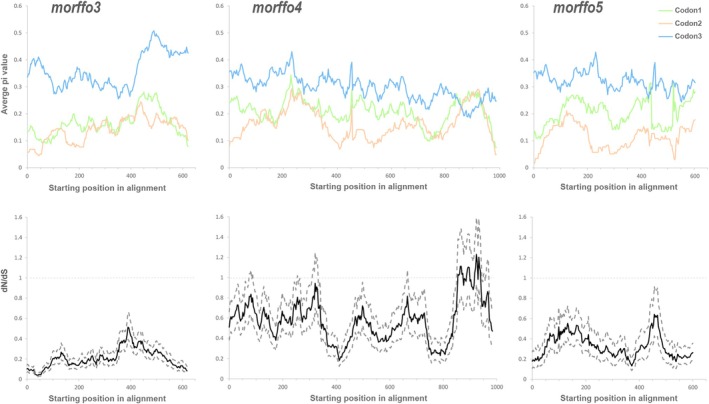 Fig. 4
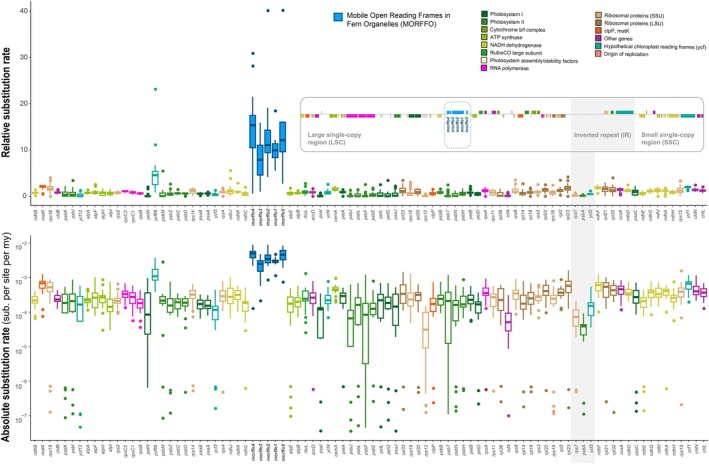 Fig. 5
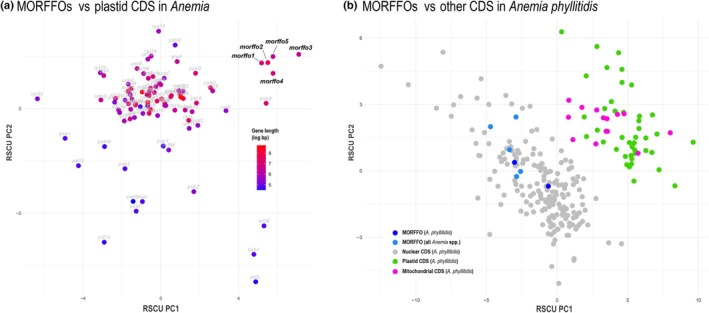 Fig. 6
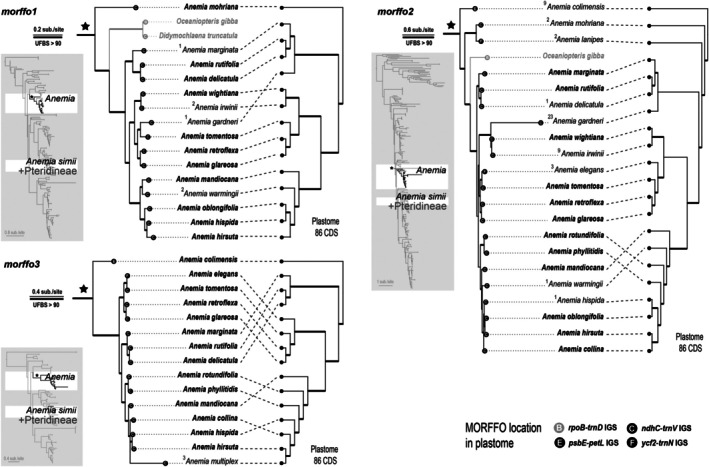 Fig. 7
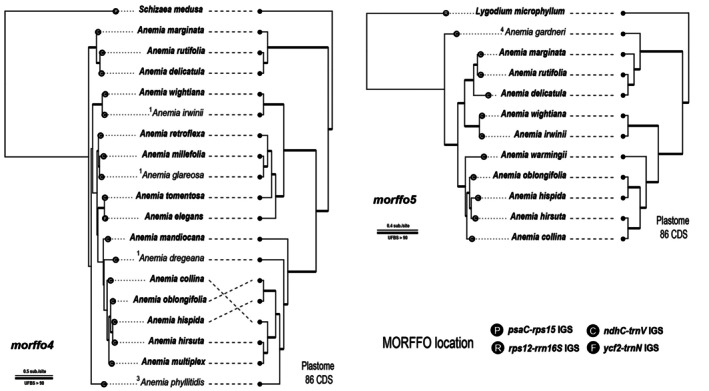 Fig. 8
| Species | Plastome size (bp) | GC% | LSC (bp) | SSC (bp) | IR (bp) | MORFFO (location) |
|---|---|---|---|---|---|---|
|
| 162 393 | 39.6 | 89 081 | 22 636 | 25 338 | |
|
| 166 588 | 40.7 | 92 673 | 22 481 | 25 717 | 2, 3 ( |
|
| 168 038 | 38.4 | 94 285 | 22 773 | 25 490 | 2, 3, 4, 5 ( |
|
| 166 735 | 38.3 | 94 573 | 22 522 | 24 820 | 1, 2, 3, 4, 5 ( |
|
| 162 446 | 38.0 | 88 894 | 22 764 | 25 394 | 4 ( |
|
| 169 497 | 38.1 | 87 094 | 22 419 | 29 992 | 2, 3, 4 ( |
|
| 165 424 | 37.7 | 91 317 | 22 811 | 25 648 | 1, 2, 5 ( |
|
| 168 948 | 38.3 | 94 994 | 22 506 | 25 724 | 1, 2, 4 ( |
|
| 168 525 | 38.3 | 94 941 | 22 778 | 25 403 | 1, 2, 3, 4, 5 ( |
|
| 167 933 | 38.4 | 94 304 | 22 791 | 25 419 | 1, 2, 3, 4, 5 ( |
|
| 165 681 | 38.3 | 92 612 | 22 263 | 25 403 | 1, 2, 4, 5 ( |
|
| 161 880 | 37.9 | 87 874 | 22 564 | 25 721 | |
|
| 166 839 | 38.3 | 89 086 | 22 695 | 27 529 | 2 ( |
|
| 168 634 | 38.7 | 94 907 | 22 705 | 25 511 | 1, 2, 3, 4 ( |
|
| 158 086 | 38.5 | 87 751 | 22 657 | 23 839 | |
|
| 167 176 | 38.2 | 94 896 | 22 548 | 24 866 | 1, 2, 3, 4, 5 ( |
|
| 164 632 | 39.8 | 90 676 | 22 590 | 25 683 | |
|
| 161 184 | 37.7 | 87 954 | 22 500 | 25 365 | 4 ( |
|
| 163 391 | 39.0 | 91 911 | 22 790 | 24 345 | 2 ( |
|
| 162 142 | 37.9 | 88 565 | 22 789 | 25 394 | 3, 4 ( |
|
| 167 429 | 38.3 | 93 997 | 22 718 | 25 357 | 1, 2, 4, 5 ( |
|
| 161 330 | 38.0 | 87 555 | 22 769 | 25 503 | 2, 3, 4 ( |
|
| 168 383 | 38.4 | 94 501 | 22 566 | 25 658 | 1, 2, 3, 4 ( |
|
| 166 859 | 38.4 | 93 396 | 22 625 | 25 419 | 2, 3 ( |
|
| 166 856 | 38.3 | 94 647 | 22 507 | 24 851 | 1, 2, 3, 4, 5 ( |
|
| 161 286 | 37.8 | 87 652 | 22 774 | 25 430 | |
|
| 167 595 | 38.3 | 93 835 | 22 514 | 25 623 | 1, 2, 3 ( |
|
| 168 532 | 38.2 | 94 744 | 22 432 | 25 678 | 1, 2, 3, 4 ( |
|
| 163 652 | 38.2 | 90 357 | 22 775 | 25 260 | 1, 2, 5 ( |
|
| 166 643 | 38.3 | 92 762 | 22 585 | 25 648 | 1, 2, 4, 5 ( |
- —Conselho Nacional de Desenvolvimento Científico e Tecnológico10.13039/501100003593
- —National Science and Technology Council in Taiwan10.13039/100020595
- —Coordenação de Aperfeiçoamento de Pessoal de Nível Superior ‐ Brasil (CAPES)10.13039/501100002322
Peer Reviews
No public reviews on file for this paper yet. If you reviewed it on a platform where reviews are public (OpenReview, ICLR, NeurIPS, ICML), you can paste yours below so the community can read it here.
Videos
No videos yet. Explain this paper in a talk, walkthrough, or lecture? Add one.
Taxonomy
TopicsPhotosynthetic Processes and Mechanisms · Genomics and Phylogenetic Studies · Protist diversity and phylogeny
Introduction
Plastid genomes (plastomes) in land plants are typically characterized by a highly conserved organization and genic content, in contrast to their pre‐endosymbiotic cyanobacterial ancestors, which exhibit dynamic genomic architecture and frequently engage in horizontal gene transfer (HGT), as is common among prokaryotes (Gross et al., 2008; Wicke et al., 2011). Most land plant plastomes have a quadripartite structure composed of two inverted repeats (IRs) flanking a large single‐copy (LSC) and a small single‐copy (SSC) region, and encode a core set of c. 80–87 protein‐coding genes (CDS) within a relatively compact genome of c. 120–160 kbp (Wicke et al., 2011; Gitzendanner et al., 2018). Large‐scale rearrangements, such as inversions or translocations, are rare, contributing to the general conservation of gene order (synteny) across plastomes (Wicke et al., 2011). However, size variation has been identified in plastomes of a few land plant lineages due to changes in organization and genic content. Significant size reductions in plastomes are observed in some groups, such as the gymnosperms (Cronn et al., 2008; McCoy et al., 2008), Cactaceae (Sanderson et al., 2015), Convolvulaceae (Funk et al., 2007), Orchidaceae (Yang et al., 2013), and ferns (Schizaeales and Stromatopteris Mett. in Gleicheniales; Labiak & Karol, 2017; Du et al., 2022; Ke et al., 2022). In many such cases, the entire suite of ndh genes (c. 10 kbp) has been lost. Conversely, when observed, plastome expansions are frequently attributable to IR expansions that duplicate adjacent genes (Li et al., 2016; Kim et al., 2020; Du et al., 2022; Jiang et al., 2024). By contrast, the acquisition of foreign genes and thus enriching genic content via HGT or intracellular gene transfer (IGT) into plastomes is exceedingly rare and has been reported in a few groups of angiosperms to date (Straub et al., 2013; Filip & Skuza, 2021; Jo et al., 2024; Cauz‐Santos, 2025). One such case is from the parasitic plant Rafflesia R. Br. (Rafflesiaceae), which possesses plastome‐like ‘vestiges’ containing plastid genes derived from its host (Molina et al., 2014). Although progress has been made in acknowledging these putative intergenomic transfers, the physical integration of these transferred elements remains unresolved.
Plastomes of ferns have generally mirrored the conserved features of those in other land plant lineages (Du et al., 2019, 2022), with only a few cases exhibiting dramatic size variation that can largely be explained by IR expansion or gene loss (Labiak & Karol, 2017; Kuo et al., 2018; Du et al., 2019, 2022). However, recent discoveries have revealed novel, lineage‐specific plastid CDSs in ferns (Robison et al., 2018; Song et al., 2018), which challenge the paradigm of plastome conservatism. Notably, some of these sequences, termed Mobile Open Reading Frames (ORF) in Fern Organelles (MORFFOs), appear to be predominantly found in ferns and are absent in nearly every other land plant lineage (Kim & Kim, 2018, 2020; Robison et al., 2018; Lehtonen & Cárdenas, 2019; Kim et al., 2023; Kuo et al., 2024). MORFFOs are particularly intriguing due to their widespread occurrence across fern lineages, their uncertain evolutionary origin, and their unusual genomic behavior (Robison et al., 2018; Kuo et al., 2024). Unlike canonical plastid genes, MORFFOs are highly variable in presence and genomic location, often forming large clusters up to 11 kbp and contributing to notable increases in plastome size (Robison et al., 2018; Lehtonen & Cárdenas, 2019). To date, MORFFOs have been reported in plastomes from nearly half of all fern families (Lehtonen & Cárdenas, 2019; Kuo et al., 2024). In the family Pteridaceae, three distinct MORFFO genes (morffo1–morffo3) have been identified in various locations, including intergenic regions within the LSC and the rrn16–rps12 intergenic region in the IR (Robison et al., 2018). In Ophioglossaceae, morffo1 and morffo2 occur in both plastomes and mitogenomes (Kim & Kim, 2018; Kuo et al., 2024). Additionally, MORFFO‐like sequences have been found in some fern nuclear genomes and several organellar genomes in other land plant lineages (Kuo et al., 2024). Their sporadic distribution and lack of clear orthologs outside ferns suggest possible origins via HGT and/or IGT (Kim & Kim, 2018; Robison et al., 2018; Kuo et al., 2024). To date, however, no CDSs have been confirmed as resulting from HGT from a plastome to another plastome in land plants (Cauz‐Santos, 2025), rendering MORFFOs potentially unprecedented in their diversity and evolutionary origin, despite their prevalence in ferns.
Within ferns, the order Schizaeales stands out for its remarkable variation in plastome organization, which is complicated by IR expansions and the loss of the entire ndh suite of genes. Diverging more than 200 Ma (Schuettpelz & Pryer, 2009; Testo & Sundue, 2016; Nitta et al., 2022), Schizaeales includes families that differ markedly in plastome architecture and genic content. Schizaeaceae, for instance, exhibits extreme plastome reduction and IR reconfiguration (Labiak & Karol, 2017; Ke et al., 2022). Plastomes of Actinostachys Wall. (Schizaeaceae) rank among the smallest known in ferns and exhibit the complete loss of all ndh and chl genes, likely reflecting a mycoheterotrophic gametophytic phase (Labiak & Karol, 2017; Ke et al., 2022). By contrast, Anemiaceae – the sister family to Schizaeaceae – maintains relatively conserved plastome organization and gene content, albeit with moderate expansions primarily due to the insertion of MORFFO‐like sequences into intergenic regions. Recent sequencing efforts have revealed that such insertions are present in c. 80% of all studied Anemiaceae species, suggesting that MORFFO integration is a recurring feature in the family. Given the contrasting plastomic features between Anemiaceae and its sister lineage, Schizaeaceae, this system provides a unique opportunity to investigate the evolutionary origins and behavior of MORFFOs. In particular, Anemiaceae plastomes offer insights into the dynamics of these unusual sequences and their role in plastome evolution.
In this study, we conducted comprehensive analyses of Anemiaceae plastomes to not only reconstruct the plastome phylogeny of this group but also investigate the diversity, distribution, and evolutionary patterns of MORFFOs. We began by conducting phyloplastomic sampling across this fern family. By analyzing these plastomes, we characterized their organization and genic content, including MORFFO insertion sites. We then reconstructed a robust plastome phylogeny to trace the evolutionary histories of MORFFOs and assess their substitution rates, codon usage, sequence divergence, and RNA editing patterns relative to canonical plastid genes. Based on this integrated evidence, we tested the hypothesis that MORFFOs originated through HGT and/or IGT and demonstrate that their mobility has played a significant role in the evolution of fern plastomes.
Materials and Methods
DNA extraction, genome sequencing, assembly, and annotation
Samples included fresh‐collected, silica‐dried leaves, and herbarium specimens. Total genomic DNA was extracted using the Qiagen DNeasy Plant Mini Kit (Valencia, CA, USA) following the manufacturer's protocol. For most samples, TrueSeq libraries were prepared and sequenced using the Illumina HiSeq 2500 at Cold Spring Harbor Laboratories. The sample of Anemia phyllitidis (L.) Sw. (collection no. Kuo 4249) was sequenced by Novogene Co., Ltd (Beijing, China) on the Illumina NovaSeq X Plus platform. The resulting paired‐end reads were processed using Geneious Prime (Kearse et al., 2012; v.2020.2.4, Biomatters Ltd, Auckland, New Zealand). For most species, end regions with >5% chance of error per base were trimmed, and the resulting reads were assembled de novo in Geneious Prime. For Anemia phyllitidis, specifically, plastome assembly was carried out using the de novo approach as implemented in NOVOPlasty v.4.3.3 (Dierckxsens et al., 2017), with the rbcL sequence from a different A. phyllitidis voucher as reference. The draft plastome assembly was iteratively polished using Pilon v.1.24 (Walker et al., 2014). Initial plastome annotations were performed in Geneious Prime using published plastome annotations of related taxa. Gene content, protein translation, putative start and stop codons, and introns were verified using the find ORFs tool as implemented in Geneious Prime. Additionally, tRNA genes were annotated using tRNAscan‐SE 2.0 (Chan et al., 2021). Putative RNA editing events necessary for protein translation were predicted by visual inspection of ORFs and with the R script ReFernment (Robison & Wolf, 2019). Plastome structure, gene content, and general characteristics were then compared to selected fern plastomes available on NCBI (http://www.ncbi.nlm.nih.gov/).
Plastid RNA editing analysis
For A. phyllitidis, transcriptomic data were generated from the same specimen (Kuo 4249) used for genomic data and plastome assemblies. RNA was extracted from flash‐frozen green sporophyte tissue using the E.Z.N.A. Plant RNA Kit from Omega Bio‐Tek (R6827; Omega Bio‐Tek, Norcross, GA, USA), with additional treatment using DNase I (69 182; Millipore Sigma, Darmstadt, Germany) to reduce genomic DNA contamination. RNA concentration was quantified using a Qubit 2 Flurometer (Thermo Fisher Scientific Inc., Walden, MA, USA) with the Qubit RNA High Sensitivity Quantification Assay kit (Q32852; Thermo Fisher Inc.). A cDNA library was constructed using the NEBNext Ultra II Library Prep (E7775; New England Biosciences, Ipswich, MA, USA) with ribosomal depletion probes designed for plant samples supplied by New England Biosciences as part of a beta test agreement.
Plastid RNA editing sites for A. phyllitidis were identified by extracting all CDS and MORFFO sequences using Geneious Prime, including 100 bp of flanking sequence upstream and downstream of each gene. These sequences were concatenated into a single multi‐FASTA file. The RNA editing detection pipeline from Fauskee et al. (2025) was implemented to detect potential RNA editing sites. In this pipeline, RNA reads were trimmed twice with Trimmomatic (v.0.39), first in paired‐end mode using the following settings: LEADING:3 TRAILING:3 SLIDINGWINDOW:4:15 MINLEN:36 to remove adapters and low‐quality reads, then in single‐end mode using the HEADCROP:13 setting, which removes the first 13 bases in each read in which GC (guanine‐cytosine) content was nonuniform. RNA reads were then mapped to the plastid CDS for each species using Bowtie2 v.2.2.4 (Langmead & Salzberg, 2012), and a BAM file was generated using Samtools v.1.14 (Li et al., 2009). The total number of RNA reads mapped to each site in each gene, as well as the number of reads with each nucleotide present at that site, were calculated using bam‐readcount v.0.8.0 (Khanna et al., 2022) and custom Linux commands. This ultimately outputs a TSV file showing the base present in the DNA sequence at each site for each analyzed gene, the total number of mapped RNA reads at each site, and the number of mapped reads for each of the four nucleotides.
Putative RNA editing sites were identified and characterized using the R pipeline from Fauskee et al. (2025). A site was classified as edited if ≥ 10 RNA reads mapped to the site, and ≥ three reads and ≥ 10% of those mapped reads showed the edited nucleotide. (e.g. a T mapped to a C for a C‐to‐U editing site). Manual inspection was performed in uncommon regions with very low RNA read coverage. The pipeline also characterized the amino acid change induced by each RNA editing event, the codon position at which it occurs, the efficiency of each editing site, and several other features. RNA editing efficiency is defined as the proportion of mapped RNA reads displaying the edited base (e.g. the number of reads with a T mapped to a C divided by the total number of reads mapped to that site).
Plastome sampling
Anemia is the only extant genus in Anemiaceae, with c. 115 species (Mickel, 2016). The ingroup included newly generated plastomes for 30 species of Anemia: Anemia adiantifolia (L.) Sw., A. colimensis Mickel, A. collina Raddi, A. delicatula Mickel, A. dregeana Kunze, A. elegans (Gardner) C. Presl, A. gardneri Hook., A. glareosa Gardner, A. hirsuta (L.) Sw., A. hispida Kunze, A. irwinii Mickel, A. labiakii Mickel, A. lanipes C. Chr., A. mandiocana Raddi, A. marginalis (Sav.) Christenh., A. marginata Mickel, A. mexicana Klotzsch, A. millefolia Gardner, A. mohriana Christenh., A. multiplex Mickel, A. oblongifolia (Cav.) Sw., A. phyllitidis (L.) Sw., A. retroflexa Brade, A. rotundifolia Schrad., A. rutifolia Mart., A. salvadorensis Mickel & Seiler, A. simii Tardieu, A. tomentosa (Sav.) Sw., A. warmingii Prantl, and A. wightiana Gardner, plus a previously published plastome of A. adiantifolia (Du et al., 2022). These species were chosen to represent the main clades within Anemia, as recovered in previous phylogenies (Labiak et al., 2015). For the other members of the Schizaeales, 11 species of Schizaeaceae were included (Actinostachys digitata (L.) Wall., A. pennula Hook., Microschizaea fistulosa (Labill.) C.F. Reed, M. tenella (Kaulf.) C.F. Reed, Schizaea dichotoma (L.) Sm., S. elegans (Vahl) Sw., S. medusa L.Y. Kuo, B.F. Ke, Fay W. Li & Rouhan, S. pectinata (L.) Sw., S. poeppigiana J.W. Sturm, S. pusilla Pursh, and S. sprucei Hook.) (Labiak & Karol, 2017; Ke et al., 2022), and five accessions of Lygodium – three from prior studies (two specimens of L. japonicum (Thunb.) Sw., and L. microphyllum (Cav.) R. Br.) (Gao et al., 2013; Kim et al., 2014) and two newly sequenced for this study (L. palmatum (Bernh.) Sw. and L. reticulatum Schkuhr). GenBank accession numbers are provided in Supporting Information Dataset S1.
Phylogenomic analyses of plastomes
CDSs were extracted for 86 plastid‐encoded genes across all taxa. Each gene was individually aligned using the ‘translation alignment’ tool implemented in Geneious Prime. Gene alignments with pairwise identity < 70% were excluded due to homology uncertainty (rpl21, rpl23, rps15, ycf2, rpoC2, ndhF, cemA, matK, and ycf1). The resulting alignments were visually inspected, and regions of uncertain homology were trimmed using Gblocks 0.91.1 (Castresana, 2000; Talavera & Castresana, 2007) in codon mode with a relaxed set of parameters (b2 = 3, b5 = half). Maximum likelihood (ML) phylograms were generated using IQ‐TREE v.2 (Minh et al., 2020). Three codon partitioning schemes were analyzed: all codon positions (‘ALL’), first+second positions (‘codon12’), and third positions only (‘codon3’). Model selection was performed using ModelFinder (Kalyaanamoorthy et al., 2017) with the Bayesian Information Criterion with the setting of ‘‐m TESTNEWMERGE’ and ‘‐rcluster 100’. Support values were calculated using 1000 ultrafast bootstrap replicates (Hoang et al., 2018).
Identification of MORFFOs
MORFFOs were initially detected using the Geneious Prime ‘find ORFs’ tool with a minimum ORF length of 500 bp. Similar positions were annotated sequentially (e.g. morffo1, morffo2, morffo3). BLASTn searches were conducted using previously described MORFFOs from Robison et al. (2018) and Lehtonen & Cárdenas (2019) to identify homologous sequences in Anemiaceae. For species lacking large insertions, whole plastome and BLASTn comparisons were used to identify potential homologs. tBLASTn was used to search for MORFFO‐like sequences in other fern plastomes and Anemia transcriptomes. Protein sequences of MORFFOs identified in Anemia were queried against FTOL v.1.6 (Nitta et al., 2022), the poly‐A enriched transcriptomes of A. phyllitidis (Qi et al., 2018) and A. tomentosa (One Thousand Plant Transcriptomes Initiative, 2019), and the ribosomal depletion transcriptome of A. phyllitidis by this study, which was assembled using Trinity (Grabherr et al., 2011). The MORFFOs were extracted and aligned using a codon‐aware approach with MACSE v.2 (Ranwez et al., 2011), which also identified frameshift mutations in the coding sequences. The MORFFOs were then reannotated following the alignment results.
Substitution patterns of MORFFOs
To further assess whether Anemia MORFFOs behave like CDS, substitution patterns were analyzed using a sliding window approach. Specifically, pseudogene‐like sequences detected with frameshift mutations by MACSE were excluded, and stop codons were removed from the alignments. Because some Anemia morffo2 lacked a stop codon, the genic boundary between morffo2 and the 3′‐adjacent morffo1 remains ambiguous. Therefore, we also analyzed nucleotide substitution patterns across the morffo2‐morffo1 intergenic spacer (IGS), hereafter referred to as ‘morffo1 + 2.’ With these alignments, preliminary ML phylograms of Anemia MORFFOs were generated using the same IQ‐TREE parameters mentioned earlier. A sliding window analysis (window size = 90 bp; step size = 3 bp) was implemented, and pairwise DNA sequence divergences (pi) for different codon positions were generated using a customized Python script with the Biopython library (Cock et al., 2009). Ratios of nonsynonymous to synonymous substitutions (dN/dS) were estimated by HyPhy (Kosakovsky et al., 2020) under the MG94 codon substitution model (Muse & Gaut, 1994) using the corresponding preliminary ML phylograms.
MORFFOs phylogeny
To investigate evolutionary relationships of Anemia MORFFOs with expanded sampling, we incorporated the morffo1 and morffo2 alignments from Kuo et al. (2024) (22 additional fern families). The morffo1 + 2 alignment was split based on IGS boundaries identified through substitution patterns (see earlier in ‘Substitution patterns of MORFFOs’ in the Materials and Methods section). The morffo3 alignment was expanded using sequences from Robison et al. (2018) and newly identified sequences from our BLAST searches (see the ‘Identification of MORFFOs’ in the Materials and Methods section). All alignments were refined using MACSE. Model selection and codon partitioning were performed with ModelFinder (BIC, recluster = 100). ML gene phylograms were generated in IQ‐TREE v.2 with 1000 ultrafast bootstrap replicates.
Relative synonymous codon usage
Relative synonymous codon usage (RSCU) for Anemia MORFFOs and 86 plastid‐encoded CDSs was calculated using the cusp package in EMBOSS (Rice et al., 2000). We further compared the RSCU patterns of MORFFOs in A. phyllitidis with those of its nuclear, plastid, and mitochondrial CDSs. To retrieve nuclear CDSs, we identified Benchmarking Universal Single‐Copy Orthologs (BUSCO) genes from the newly generated transcriptome (see earlier ‘Identification of MORFFOs’ in the Materials and Methods section) using BUSCO v.6 and the Viridiplantae ODB10 dataset (Tegenfeldt et al., 2025). To obtain mitochondrial CDSs, we incorporated the workflow of Cárdenas & Lehtonen (2023) and Kuo et al. (2024). First, HybPiper v.2 (Johnson et al., 2016) was used to assemble mitochondrial gene CDSs, using A. phyllitidis genome‐skimming DNA reads and fern mitochondrial exon sequences by Cárdenas & Lehtonen (2023) as our input and blastx reference, respectively. The resulting hybpiper output was then used as seeds for mitogenome assembling in NOVOPlasty. Finally, mitochondrial CDSs were annotated and manually verified in Geneious Prime. In this RSCU comparison, only CDSs longer than 500 bp were analyzed to avoid stochastic biases resulting from short gene length. The amino acids methionine (M) and tryptophan (W) were excluded from the analysis because only a single codon encodes each. Principal component analysis (PCA) was used to assess differences in RSCU results.
Substitution rate estimation
Relative and absolute substitution rates were calculated for each MORFFO and plastid‐encoded CDS using tip‐to‐root distances in their single‐gene phylograms, normalized by those from the plastome phylogram and chronogram, respectively. Specifically, the 86‐CDS ML phylogram constructed from the matrix including all sites (see ‘Phylogenomic analyses of plastomes’ in the Materials and Methods section) was used as our plastome phylogram. Using this phylogram, the corresponding plastome chronogram was generated using treePL (Smith & O'Meara, 2012). Calibration points included a crown group age maximum of 231.11 mya for Schizaeaceae+Anemiaceae (Testo & Sundue, 2016; Nitta et al., 2022), and a minimum crown node age of 136 mya for Anemiaceae based on Pelletixia and Ruffordia fossils from the Early Cretaceous (Skog, 1982; Dettmann & Clifford, 1992).
All single‐gene phylograms for all CDSs were reconstructed using IQ‐TREE v.2. All 86 plastid‐encoded CDS single‐gene phylograms were inferred under a topological constraint from the plastome ML phylogram. Model selection and codon partitioning followed the same IQ‐TREE settings described earlier (see ‘MORFFOs phylogeny’ in the Materials and Methods section). Previously reconstructed MORFFO ML phylograms were used (see ‘MORFFOs phylogeny’ in the Materials and Methods section) after removing Anemia simii (due to horizontal transfer likely from other fern lineages; see the Results section). To obtain conservative rate estimates that are presumed to remain under functional constraints, we also performed analyses excluding pseudogene‐like MORFFOs (i.e. sequences containing frameshift mutations) by removing their tips from the MORFFO ML phylograms. To calculate relative substitution rates, all non‐Anemiaceae tips from all phylograms were also removed, and subphylograms were generated from every internode of the trimmed single‐gene phylograms. Tip‐to‐root branch lengths for each subphylogram were summed, and these values were divided by the corresponding sums derived from the plastome subphylogram. Absolute substitution rates were calculated similarly, using the corresponding branch length sums from the plastome subchronograms as the denominators. To ensure consistent ‘roots’ (i.e. placement of the most recent common ancestor) across comparisons, we included only those single‐gene subphylograms in which all descendant taxa had formed a monophyletic group in both the plastome phylogram and chronogram. All comparisons and calculations were performed using a custom R script with the phytools (Revell, 2012), ape (Paradis et al., 2004), adephylo (Jombart et al., 2010), and phangorn (Schliep, 2011) packages.
Results
Plastome architecture and identification of MORFFO
We assembled 29 complete Anemiaceae and two Lygodiaceae plastomes in this study. The only incomplete plastome was Anemia wigthiana, which was recovered in two contigs separated by an ambiguous assembly in the LSC. All plastomes have a quadripartite organization composed of one LSC, SSC, and two IRs. Gene content and architecture are relatively stable among the different lineages. The plastomes of Anemia are composed of 117 genes, 86 CDSs, four rRNAs, and 27 tRNAs. Plastome length varied from 158,086 bp (in A. marginalis) to 169,465 bp (in A. elegans). A graphical representation of two Anemia plastomes is depicted in Fig. 1. The two plastomes of Lygodium are also similar in gene content and architecture, with 86 CDS, four rRNAs, and 27 tRNAs. The total lengths of each plastome and each partition (LSC, SSC, and IR) are summarized in Table 1.
Plastomes of Anemiaceae with (Anemia hirsuta, outer plastome) or without (A. labiakii, inner plastome) a large insertion between the trnV‐UGC and ndhC genes, where the Mobile Open Reading Frames in Fern Organelles (MORFFO) cluster is located.
Except for MORRFOs, gene content and order were identical among Anemia plastomes. The largest plastomes generally contained several insertions, ranging from 2400–9400 bp. These insertions included MORFFOs that were typically found in gene clusters and located between ndhC and trnV‐UAC in the LSC region in most species. Exceptions include MORFFOs located between ycf2 and trnN‐GUU in the IR of A. elegans and A. lanipes, as well as MORFFOs located between psbE and petL in the LSC of A. colimensis (Table 1). In most instances, these MORFFOs shared the same start codons.
We found at least five MORFFOs in Anemia. Three correspond to morffo1, morffo2, and morffo3, as described by Robison et al. (2018), based on our BLAST similarity searches (Dataset S1). Because these MORFFOs (including their IGS; Table 1) were present in 20 of 30 species (66.6%) and could be easily aligned, they were treated as homologous and named accordingly. However, these three MORFFOs were present only with partial sequences in some species, such as A. dregeana, A. elegans, A. gardneri, A. irwinii, A. lanipes, A. marginata, A. warmigii, and A. wightiana (Fig. 2). Notably, these MORFFO sequences were sometimes found as a single and large ORF (c. 4500 bp) or with internal stop codons that split the large ORF into up to four smaller ORFs of different lengths. Morffo4 and morffo5, on the other hand, seem to be exclusive to Schizaeales, sharing only a slight resemblance with MORFFOs from other fern plastomes. Morffo4 and morffo5 were present in 19 of 30 (63.3%) Anemia species (Table 1) but only in species belonging to the three derived clades.
Phylogram of the Schizaeales based on 86 plastid protein‐coding genes (CDS). The main clades recognized by Labiak et al. (2015) are indicated at the left. The presence and position of each Mobile Open Reading Frames in Fern Organelles (MORFFO) are indicated at the right. Values shown along branches are maximum likelihood ultrafast bootstrap support (UFBS) for the three partitions used in our analyses; ‘+’ and ‘–’ indicate values of 100 and 50 or less, respectively. Branches with UFBS values of 100 are shown in bold. Asterisks indicate the newly sequenced plastomes.
MORFFOs were not found in Anemia mexicana, A. adiantifolia, A. labiakii, A. marginalis, A. millefolia, or A. salvadorensis plastomes. Consistent with this finding, the intergenic regions between ndhC and trnV‐UAC in these species were significantly smaller, ranging from 718 bp to 917 bp. Although MORFFOs were not as evident as in most species, a few smaller ORFs (< 300 bp) found in A. gardneri, A. millefolia, and A. phyllitidis were somewhat similar to MORFFOs identified in other species. Morffo4 and morffo5 were also identified in other Schizaeales plastomes. Outside of Schizaeales, however, only a few tBLASTn hits met the cutoff criteria – covering at least one‐third of the query length and with sequence identity above 30% (Dataset S1). Under these criteria, morffo4 was identified with weak similarity (30%) in the plastomes of Mankyua chejuense (GenBank accession no.: KP205433) and Pyrrosia petiolosa (GenBank accession no.: MT210541).
Sequence‐similar copies of MORFFOs were not detected in two Anemia polyA‐enriched transcriptomes (A. phyllitidis and A. tomentosa). Notably, highly similar copies (similarity >90%) were detected in the ribosomal‐depleted transcriptome for A. phyllitidis (Dataset S1); however, these sequences differed from those found in the A. phyllitidis plastome. In addition, no RNA editing was detected in the plastid‐encoded MORFFOs of A. phyllitidis, in contrast to the majority of other plastid‐encoded CDSs (Dataset S2). Although five MORFFO sites showed editing frequencies above 10% with more than two edited reads, our manual inspection of the read mapping profile confirmed that these signals originated from reads derived from other genes, likely other nonplastid‐encoded MORFFO copies.
Phylogenomic analyses
The final nucleotide dataset comprised 47 taxa and 86 CDS, totaling 72 105 aligned nucleotides. The ML phylogenomic analyses (Figs 2, S1) recovered the main clades within Schizaeales, representing the three families traditionally recognized: Anemiaceae, Lygodiaceae, and Schizaeaceae.
In Anemiaceae, the results corroborate, in most respects, those presented by Labiak et al. (2015), offering better resolution for poorly resolved clades in that study. Subgen. Anemiorrhiza was identified as the first divergent lineage (ultrafast bootstrap support (UFBS) = 100), followed by subgen. Mohria (UFBS = 100) (Fig. 2). Within the subgen. Anemia, Anemia lanipes resolved as the first divergent lineage (UFBS = 100), and the remaining members were composed of three derived clades, including ‘gardneri’, ‘tomentosa’, and ‘phyllitidis’ (Fig. 2).
Substitution patterns and rates of MORFFOs
The sliding window analyses further revealed selection constraints across the entire MORFFO gene family (Figs 3 and 4). Overall, their dN/dS ratios were lower than 1, with substitutions being more conserved in the first two codon positions compared to the third (Figs 3 and 4). In morffo1 + 2, we also identified a region with elevated dN/dS and substitution rates across all three putative codon positions (Fig. 3), which is presumably the noncoding IGS between morffo1 and morffo2. Figs 5 and S2 present relative and absolute substitution rates of Anemia MORFFOs alongside those of the canonical plastid CDS. These MORFFOs exhibited exceptionally high rates, c. 10 to 15 times higher than other plastid‐encoded CDSs. As expected, MORFFO substitution rates were higher when pseudogenes were included (Fig. S2) than when they were excluded (Fig. 5). Another notable pattern is that CDSs in the IRs showed lower rates than those outside of the IRs (Figs 5, S2).
Sliding window analysis of Anemia morffo1 + 2 (two MORFFO genes and their intergenic spacer) with a window size of 90 bp and step size of 3 bp. The upper panel shows the average pairwise nucleotide diversity (pi) across different codon positions. The lower panel displays dN/dS ratios, with the solid line representing the mean and dashed lines indicating the 95% confidence intervals.
Sliding window analysis of other Anemia Mobile Open Reading Frames in Fern Organelles (MORFFOs) with a window size of 90 bp and step size of 3 bp. The upper panel shows the average pairwise nucleotide diversity (pi) across different codon positions. The lower panel displays the ratios of nonsynonymous to synonymous substitutions (dN/dS), with the solid line representing the mean and dashed lines indicating the 95% confidence intervals.
Relative (upper) and absolute (lower) substitution rates of nonpseudogenized Mobile Open Reading Frames in Fern Organelles (MORFFOs) and 86 plastid protein‐coding genes in Anemia. The boxplots show the 25th–75th percentiles (boxes), median values (horizontal lines within the boxes), whiskers representing 1.5× the interquertile range, and points beyond these rangers as outliers.
Relative synonymous codon usage (RSCU)
Fig. 6a illustrates the PCA dimensions of RSCU of 86 CDS and four MORFFOs from Anemia plastomes. As expected under genetic drift, the genes with shorter lengths (< 150 bp) tended to be fixed and exhibited more biased codon usage, and thus were found more scattered in the plot (Fig. 6a). Except for MORFFOs, plastid‐encoded genes of substantial lengths displayed similar codon usage patterns, clustering closely together (Fig. 6a). By contrast, MORFFOs showed distinct codon usage patterns compared with other plastid‐encoded genes and formed a separate cluster further shows that the RSCU profiles of A. phyllitidis MORFFOs cluster with nuclear BUSCO CDSs (totally 185 complete single‐copy genes), and are well‐separated from both plastid (n = 44) and mitochondrial CDSs (n = 14).
Relative synonymous codon usage (RSCU) principal component analysis plots of four Mobile Open Reading Frames in Fern Organelles (MORFFOs) and 86 plastid protein‐coding genes (CDSs) in Anemia (a), and MORFFOs, nuclear, plastid, and mitochondrial CDSs in A. phyllitidis (b).
MORFFO phylogeny
The phylograms of Anemia MORFFOs are shown in Figs 7 and 8 and S3–S5. All MORFFOs exhibited genealogies incongruent with the plastome phylogeny. Morffo1, morffo2, and morffo3 phylogenies revealed that Anemia sequences were distantly related to other Schizaeales sequences and were not monophyletic (Figs 7, S3–S5). Notably, A. simii MORFFOs were phylogenetically distant from other Anemia sequences, and, instead, nested in those derived from different fern lineages, predominantly from Pteridineae (Polypodiales) ferns (Fig. 7). MORFFOs from other fern lineages were found nested within Anemia MORFFOs, including morffo1 and morffo2 of Oceaniopteris gibba (Labill.) Gasper & Salino (Aspleniineae; Polypodiales), and morffo1 of Didymochlaena truncatula (Sw.) J. Sm. (Polypodiineae; Polypodiales) (Fig. 7). MORFFO gene phylogenies of Anemia species only partially align with the plastome phylogeny and strong conflict (e.g. UFBS > 90) within Anemia can also be easily found (Figs 7 and 8). In some cases, the terminal branches of Anemia MORFFO phylogenies were exceptionally long, likely due to gene pseudogenization, as indicated by frameshift mutations in the MACSE alignments.
Phylogenies of morffo1, morffo2, and morffo3 found in Anemia (left) aligned with the plastome topology (right). Numbers shown along branches are maximum likelihood ultrafast bootstrap support (UFBS) values. Branches with UFBS values of 90 are shown in bold. The values on the taxon names indicate the number of frameshift mutations found in Mobile Open Reading Frames in Fern Organelles (MORFFO) sequences. The left and lower panels show their full phylograms highlighted with Anemia MORFFO sequences.
Phylogenies of morffo4 and morffo5 found in Anemia (left), aligned with the plastome topology (right). Numbers shown along branches are Maximum likelihood ultrafast bootstrap support (UFBS) values. Branches with UFBS values of 90 are shown in bold. The values on the taxon names indicate the number of frameshift mutations found in Mobile Open Reading Frames in Fern Organelles (MORFFO) sequences.
Discussion
Phylogenomic topology with improved resolution
The phylogenomic results presented here (Fig. 2) support most of the relationships recovered in previous studies for the Schizaeales (Skog et al., 2002; Wikström et al., 2002; Labiak et al., 2015; Labiak & Karol, 2017; Ke et al., 2022). These include the recognition of the three main family‐level lineages: Anemiaceae, Lygodiaceae, and Schizaeaceae. Generic circumscriptions are also consistent with what is currently accepted, except for one example in the Schizaeaceae. Ke et al. (2022) proposed recognizing three genera in this family: Actinostachys, Microschizaea, and Schizaea sensu stricto. These genera were supported by phylogenomic analysis, except for the position of S. pusilla, which was recovered as sister to either Schizaea or Schizaea + Actinostachys, depending on the data matrices, models, and partitions used. The results presented here support the latter scenario, albeit with reduced support (Fig. 2).
For Anemiaceae, in particular, our phylogenetic analysis corroborates many of the previously recovered relationships for the backbone of Anemiaceae (Labiak et al., 2015). Generally, the three main clades, which correspond to the subgenera Anemia, Anemiorrhiza, and Mohria, were recovered here with high UFBS (Fig. 2). Within the Anemia s.s. clade (subgenus Anemia), we obtained a better‐resolved phylogeny (Figs 2, S1) than that of Labiak et al. (2015). In the current analysis, the first divergent lineage is A. lanipes, a species endemic to Madagascar. This relationship was also recovered in Labiak et al. (2015), and it is corroborated in our phylogenomic analysis. In our analysis, A. gardneri was recovered as sister to the A. rutifolia clade (A. delicatula, A. marginata, and A. rutifolia). This contrasts with the results of Labiak et al. (2015), in which A. gardneri was recovered as sister to the remaining clades of Anemia, namely, the phyllitidis and tomentosae clades. It should be noted, however, that the relationships recovered for these clades by Labiak et al. (2015) had low support values in both the Bayesian and ML analyses, which may be due to the limited amount of data used in that study.
Our results also supported the monophyly of the ‘tomentosa’ and the ‘phyllitidis’ clades of Labiak et al. (2015). In the ‘tomentosa’ clade, the polytomy among the Anemia elegans, A. flexuosa, and the A. simii clades was better resolved, but still without full support in our analysis. A similar pattern was recovered within the ‘phyllitidis’ clade, in which the relationships were better resolved but still without full support (Fig. 2). At the base of this clade, the relationships of A. mandiocana and A. rotundifolia, which were recovered as a polytomy in Labiak et al. (2015), were resolved as a grade that includes A. mandiocana as sister to the rest, followed by a clade with A. dregenea, A. rotundifolia, and A. warmingii. The remaining relationships were the same as those in Labiak et al. (2015), except for the close relationship between A. hirsuta and A. multiplex, which were then recovered in different clades (Fig. 2).
Noteworthy is that the Indian endemic Anemia wightiana was recovered as sister to the Brazilian endemic A. irwinii (Fig. 2). This sister relationship was unexpected – although possible – because it would require a long‐distance dispersal event between the two continents. However, our current sampling limits our ability to draw a more precise conclusion, making it necessary to include additional African and Malagasy samples for more robust biogeographical analyses.
Signature of MORFFOs as atypical protein‐coding genes in plastomes
MORFFOs in fern plastomes were first identified by their recognizable ORFs, with similar amino sequences across fern taxa. Their expression and function as CDS, however, remain largely unexplored. Due to the absence of a conserved stop codon position, genic boundaries between some MORFFOs are also unclear, as showcased by morffo1 + 2 in Anemia (Fig. 3). To address this issue, we attempted to detect MORFFO expression in transcriptomes of two Anemia species. Additionally, our empirical evidence from the sliding window analyses confirmed that substitution patterns of these Anemia MORFFOs resemble those of CDS with functional constraint (Figs 3 and 4). These MORFFOs are subject to not only translational selection with constrained codon usage (Fig. 6) but also to purifying selection, as indicated by dN/dS ratios that are predominantly below one across entire genes (Figs 3 and 4). This purifying selection is particularly evident at the first two codon positions (Figs 3 and 4), in which nucleotide substitutions often result in changes in amino acids. By contrast, selection at the third codon position is much more relaxed, following a pattern typical of coding genes (Figs 3 and 4). These results also allowed for a better delimitation of the noncoding IGS between morffo1 and morffo 2 (Fig. 3).
Despite exhibiting signatures typical of CDS under purifying selection, we found that MORFFOs have usually frequent pseudogenization (detailed in the ‘Dynamism and mobility of MORFFOs in plastomes’ in the Discussion section) and other atypical signatures compared to other plastid‐encoded genes. First, MORFFOs are often oriented opposite to the transcriptional direction of flanking operons, and/or located far from operon promoters that are conserved in land plants, including ferns (Shiina et al., 2005; Shahar et al., 2019). Anemia MORFFOs in this study are good examples: They are mostly inserted within the trnV–ndhC IGS, inside the atpB operon (Ghulam et al., 2012; Shahar et al., 2019), yet they are inverted relative to the transcriptional direction of the nested operon (Figs 2 and 5). Similar arrangements have also been observed in other MORFFOs (Lehtonen & Cárdenas, 2019; Kim et al., 2023; Kuo et al., 2024). Second, although these MORFFOs are transcribed, they apparently undergo no RNA editing (Dataset S2), unlike the majority of plastid‐encoded CDS in most ferns, in which post‐transcriptional C‐to‐U and U‐to‐C edits are frequent (Fauskee et al., 2025). For other Anemia plastid‐encoded CDSs, RNA editing has been found in 69 (80%) of these genes, with an overall occurring frequency of 0.55% across all sites (Dataset S2). However, none were detected in A. phyllitidis MORFFOs, which comprise 2490 bases. Lastly, their codon usage patterns differ significantly from those of canonical plastid CDS. As shown in the PCA plots of their RSCU, MORFFOs form a separate cluster from other plastid and also mitochondrial genes (Fig. 6), nested within the nuclear gene cluster (Fig. 6b). These differences in codon usage bias may reflect selection pressures associated with diverse translational ‘habitats’ represented by different genomic counterparts in plant cells. Taken together, MORFFOs appear to have transcription and translation decoupled from other plastid‐encoded CDS, are unlikely to use the plastid genetic machinery, and are very possibly expressed outside of the plastid, potentially within the nucleus.
Dynamism and mobility of MORFFOs in plastomes
Since structural rearrangements and recombination events are infrequent in plastomes, the synteny of plastid genes is well‐preserved (Du et al., 2022; Cauz‐Santos, 2025), as also observed in the ancient fern lineage Anemia (Fig. 1). Due to this linkage, plastid genes are usually stably positioned. All are thought to cotransfer vertically and thus share a common genealogy. However, MORFFOs represent an exception in fern plastomes, exhibiting inconsistent genic positions and genealogies (Kim & Kim, 2018, 2020; Robison et al., 2018; Lehtonen & Cárdenas, 2019; Kim et al., 2023; Kuo et al., 2024). Due to their ambiguous homology and dynamic nature, MORFFOs were only discovered recently, in 2018, initially from fern plastomes (Kim & Kim, 2018; Robison et al., 2018). Nevertheless, they appear more widespread in fern plastomes than previously recognized. In this study, we identified and characterized novel MORFFOs, morffo4 and morffo5, which are found only in Anemiaceae and sister families. In addition to various loci in fern plastomes, MORFFOs have also been detected in mitochondrial and nuclear genomes in ferns and other plant lineages (Kuo et al., 2024). Despite their prevalence, MORFFOs do not appear essential for plastid and plastome function as they are absent from some fern plastomes, including some Anemia plastomes studied here (Fig. 1; Table 1).
Our comprehensive plastome sequencing in a discrete fern lineage, Anemia, offers plastome maps along with a fine‐scaled phylogenetic framework to investigate genomic dynamics of MORFFOs in greater detail. First, we found that transposition and replication of these genes are likely independent of plastomes. In Anemia, MORFFOs have shifted their plastomic locations across lineages (Fig. 2). However, Anemia plastomes exhibit no structural changes that disrupt gene synteny, providing a potential opportunity for gene translocation. Thus, we also found no additional gene transpositions in plastomes. Previous MORFFO studies echo these findings, and genic positions of MORFFOs were usually inconsistent, while irrelevant to plastomic rearrangements (Robison et al., 2018; Kuo et al., 2024). These phenomena suggest the capabilities of MORFFOs to replicate and move alone without relying on their plastomes. Evidence from their inconsistent genealogies and elevated substitution rates further supports this idea. While MORFFOs remain functionally constrained as demonstrated here (Figs 3 and 4), they show exceptionally higher substitution rates than that of other plastid‐encoded CDS (Fig. 5) – even those from the SSC and LSC, which usually have higher substitution rates than the CDSs present in the IR (Li et al., 2016). This pattern is likely the result of faster replication rates (i.e. cumulating more mutations through duplication cycles per unit time) or increased error rates during replication (e.g. using a different polymerase). In either case, MORFFO replication is suggested to be unsynchronized with, and uncoupled from, plastome replication, and may occur outside of plastids. Second, we found that MORFFOs do not appear to be essential for maintaining plastid function or overall fitness. They are frequently pseudogenized or absent in Anemia plastomes (Figs 2, 7, 8). In one notable case, their presence in A. phyllitidis plastomes shows dynamic variation even within this species. One of the sequenced plastomes lacks MORFFOs entirely (GenBank accession no.: OM990738; data not shown), and another expresses apparently functional MORFFOs (Dataset S1). Taken together, MORFFOs more resemble selfish and mobile DNA elements, characterized by their dynamic and often unpredictable presence, whereas canonical plastome CDS primarily have essential roles in plastid function.
HGT acquisition of MORFFOs and their shuttling among plant lineages
Plastomes of land plants are generally conserved in their genic composition and even tend to resist the invasion of foreign DNA (Filip & Skuza, 2021; Cauz‐Santos, 2025), in contrast to the mitogenome and nuclear genome, in which transfers of foreign genes are more common (Davis & Xi, 2015; Filip & Skuza, 2021). Unsurprisingly, relatively few studies have confirmed HGT or IGT in plastomes of land plants (Straub et al., 2013; Filip & Skuza, 2021; Cauz‐Santos, 2025). However, the increasing discovery of MORFFOs in fern plastomes is reshaping this understanding. The dynamic presence of MORFFOs suggests frequent HGT and IGT events (Kim & Kim, 2018; Kuo et al., 2024). Previous evidence has largely been based on comparative genomics, including a few plastomes within select lineages and sequence similarity searches that found BLAST hits in GenBank (Kim & Kim, 2018, 2020; Robison et al., 2018; Kim et al., 2023). Nonetheless, direct phylogenetic evidence clearly identifying such HGT or IGT events has been lacking. Kuo et al. (2024) analyzed plastome and mitogenome assemblies from 16 representatives of the fern family Ophioglossaceae. This first phylogenetic investigation of fern MORFFOs revealed a scattered distribution of Ophioglossaceae sequences and interlaced patterns of plastid and mitochondrial sequences in their gene trees, suggesting that frequent HGT and/or IGT events have shaped their evolution. Due to scarce sampling of closely related taxa, the evolutionary trajectory and directionality of these transfers, however, remain unclear for Ophioglossaceae and other fern lineages.
Leveraging dense plastome sampling within a specific fern lineage and broadly across ferns, our study focuses on MORFFOs from Anemia. Although the origin of these MORFFOs is still not fully proved, the strong genealogical conflicts (i.e. UFBS > 90) between the MORFFO and the plastome phylogeny (Figs 7 and 8) suggest that MORFFO genes are more likely to have been transferred into fern plastomes through HGT and even IGT. The most striking example is A. simii, whose MORFFOs, morffo1 to morffo3, are phylogenetically nested within plastid sequences from distantly related fern lineages, mostly from Polypodiales suborder Pteridineae (Figs 7, S3–S5). This opens up the possibility of HGT from Pteridineae (Polypodiales) and/or other distantly related fern lineages into A. simii, although additional evidence is needed to ascertain whether the transfer originated directly from the plastome or from other genomic compartments (i.e. mitogenome or nuclear genome) in these fern lineages. It also remains possible that some of the MORFFOs in A. simii and those in Pteridineae plastomes share a common origin in nonplastid genomes, subsequently being inserted into plastomes through HGT and IGT. Additional evidence supporting this HGT hypothesis is that the A. simii plastome lacks morffo4 and morffo5, which are otherwise unique to Schizaeales plastomes (Fig. 2). Another notable example of HGT involves Anemia morffo1 and morffo2, which appear to have been transferred into the plastomes of distantly related fern lineages, including O. gibba (Aspleniineae; Polypodiales) and D. truncatula (Polypodiineae; Polypodiales) (Fig. 7). In these recipient plastomes, Anemia‐like MORFFOs are inserted at different positions, and arranged differently from the configuration in Anemia (Fig. S6). Even more intriguing, in the plastome of O. gibba, the Anemia‐like MORFFOs are flanked by morffo3 genes apparently related to the fern family Desmophlebiaceae, which are likely to have originated from a distinct HGT source (Fig. S5). These findings indicate that MORFFO genes not only can translocate independently but also may form chimeric gene blocks that insert together into a plastome.
Although the presence of MORFFOs in the mitogenome and nuclear genome of Anemia remains understudied due to the difficulty of fully assembling these genomes, their presence is highly plausible, as suggested by Kuo et al. (2024). Through BLAST searches in the A. phyllitidis transcriptome, we identified sequence‐variant MORFFO copies that are absent from its plastome. These findings support their origin outside of plastomes, likely from the nuclear genome, as indicated by their RSCU similarity (Fig. 6b). Interestingly, the absence of these copies in poly‐A–enriched transcriptomes suggests that they are not typical nuclear mRNAs. Instead, they may represent viral‐like/selfish genetic elements residing in the nuclear genome. Our preliminary search of the nuclear genome of its sister genus Lygodium (Pelosi et al., 2025) also identified sequences closely matching MORFFOs (data not shown). Importantly, our deep investigation of MORFFO evolutionary patterns in Anemia demonstrates that these genes are likely transcribed, translated, and replicated outside the plastids, supporting their mechanistic potential to facilitate IGT‐based transfer.
Conclusions
MORFFOs in fern plastomes remain largely mysterious. The molecular mechanisms underlying their replication and insertion into these genomes are still unknown, despite their widespread presence across distinct fern lineages. In this study, we identified two novel MORFFOs from the fern family Anemiaceae. Our comparative genomic and phylogenetic approaches further reveal their evolutionary constraints as CDS, yet also their remarkable evolutionary mobility, contrasting with the steady genomic ‘plate’ that is the rest of the plastome, in which gene synteny has been maintained for more than 150 Myr, as showcased in the ancient fern lineage Anemiaceae. MORFFOs also display unusual genetic signatures that differ from plastid‐encoded CDS, including the absence of RNA editing, distinct codon usage, and extraordinarily high substitution rates. These diagnostics suggest their possible origins outside of the plastome, potentially involving HGT and/or IGT. Notably, these findings underscore that such mobile elements can move across genic, genomic, and even interspecies barriers, highlighting unique cases in which fern plastomes have frequently acquired genes through HGT or IGT, a phenomenon rarely observed in other land plant lineages.
Competing interests
None declared.
Author contributions
PHL was involved in conceptualization, data curation, analysis, funding acquisition, investigation, methodology, writing – original draft, writing – review and editing. L.‐YK was involved in conceptualization, data curation, analysis, investigation, methodology, writing – original draft, writing – review and editing. BDF was involved in analysis, methodology, writing – original draft, writing – review and editing. KGK was involved in conceptualization, data curation, analysis, funding acquisition, investigation, methodology, writing – original draft, writing – review and editing.
Disclaimer
The New Phytologist Foundation remains neutral with regard to jurisdictional claims in maps and in any institutional affiliations.
Supporting information
Dataset S1 Voucher information and the results of the BLAST similarity searches of the Anemia MORFFOs.
Dataset S2 Plastid RNA editing sites for Anemia phyllitidis.
Fig. S1 Phylogram of the Schizaeales based on 86 plastid CDS. Fig. S2 Relative and absolute substitution rates of Anemia MORFFOs and the plastid CDSs. Fig. S3 Phylogeny of morffo1. Fig. S4 Phylogeny of morffo2. Fig. S5 Phylogeny of morffo3. Fig. S6 Organization of morffo genes in the plastome of Oceaniopteris gibba.Please note: Wiley is not responsible for the content or functionality of any Supporting Information supplied by the authors. Any queries (other than missing material) should be directed to the New Phytologist Central Office.
The reference list from the paper itself. Each links out to its DOI / PubMed record.
- 1Cárdenas GG , Lehtonen S . 2023. The third opinion on fern phylogenetics with novel insights into their mitogenome evolution. Phytotaxa 625: 227–247.
- 2Castresana J . 2000. Selection of conserved blocks from multiple alignments for their use in phylogenetic analysis. Molecular Biology and Evolution 17: 540–552.10742046 10.1093/oxfordjournals.molbev.a 026334 · doi ↗ · pubmed ↗
- 3Cauz‐Santos LA . 2025. Beyond conservation: the landscape of chloroplast genome rearrangements in angiosperms. New Phytologist 247: 2571–2580.40613318 10.1111/nph.70364 PMC 12371153 · doi ↗ · pubmed ↗
- 4Chan PP , Lin BY , Mak AJ , Lowe TM . 2021. TRN Ascan‐SE 2.0: improved detection and functional classification of transfer RNA genes. Nucleic Acids Research 49: 9077–9096.34417604 10.1093/nar/gkab 688PMC 8450103 · doi ↗ · pubmed ↗
- 5Cock PJA , Antao T , Chang JT , Chapman BA , Cox CJ , Dalke A , Friedberg I , Hamelryck T , Kauff F , Wilczynski B et al. 2009. Biopython: freely available Python tools for computational molecular biology and bioinformatics. Bioinformatics 25: 1422–1423.19304878 10.1093/bioinformatics/btp 163PMC 2682512 · doi ↗ · pubmed ↗
- 6Cronn R , Liston A , Parks M , Gernandt DS , Shen R , Mockler T . 2008. Multiplex sequencing of plant chloroplast genomes using Solexa sequencing‐by‐synthesis technology. Nucleic Acids Research 36: e 122.18753151 10.1093/nar/gkn 502PMC 2577356 · doi ↗ · pubmed ↗
- 7Davis CC , Xi Z . 2015. Horizontal gene transfer in parasitic plants. Current Opinion in Plant Biology 26: 14–19.26051213 10.1016/j.pbi.2015.05.008 · doi ↗ · pubmed ↗
- 8Dettmann ME , Clifford HT . 1992. Phylogeny and biogeography of Ruffordia, Mohria and Anemia (Schizaeaceae) and Ceratopteris (Pteridaceae): evidence from in situ and dispersed spores. Alcheringa 16: 269–314.