Genomic responses to increased temperature and pollinator selection in Brassica rapa L
Yanqian Ding, Florian P. Schiestl

TL;DR
This study shows how temperature and pollinator type together influence the genomic adaptation of Brassica rapa plants.
Contribution
The paper quantifies the joint genomic effects of temperature and pollinator identity on plant adaptation.
Findings
Warming strengthened selection in community-level pollination, especially in the hot-generalised treatment.
Bumblebee pollination showed strong genomic change, but it was obscured by genetic drift.
Butterfly pollination had minimal genomic response compared to other treatments.
Abstract
Rapid environmental change reshapes both abiotic stress and biotic interactions, yet it remains unclear how these combined forces structure plants' genomic adaptation. In particular, the joint influence of temperature and pollinator identity, two ecological axes undergoing simultaneous global shifts, has rarely been quantified at genomic resolution.We resequenced Brassica rapa L. plants after a six‐generation evolution experiment, combining two temperature regimes (ambient vs hot) with three pollination treatments (bumblebee, butterfly, and mixed bumblebee–butterfly), and glasshouse control, to assess how these factors shape genomic responses.Using multiple complementary statistics (allele‐frequency trajectories, F ST outliers, Cochran–Mantel–Haenszel tests, and local score analyses), we found that adaptive genomic responses differed sharply among pollinators and temperatures: warming…
Genes, proteins, chemicals, diseases, species, mutations and cell lines named across the full text — each resolved to its canonical identifier and authoritative record.
Click any figure to enlarge with its caption.
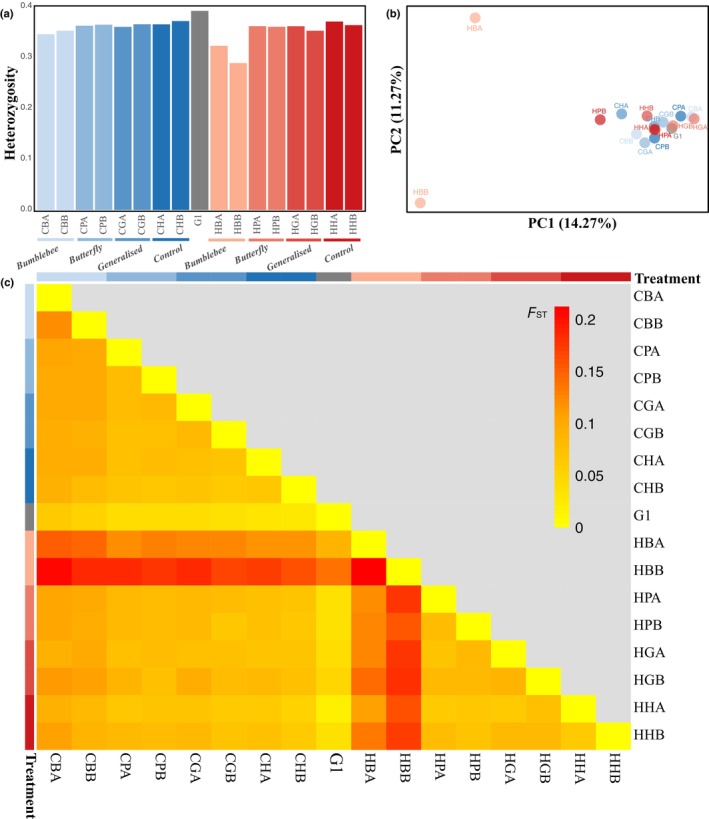 Fig. 1
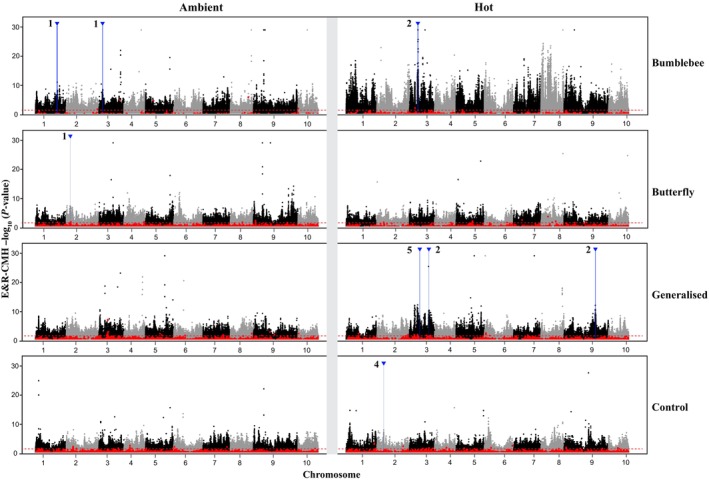 Fig. 2
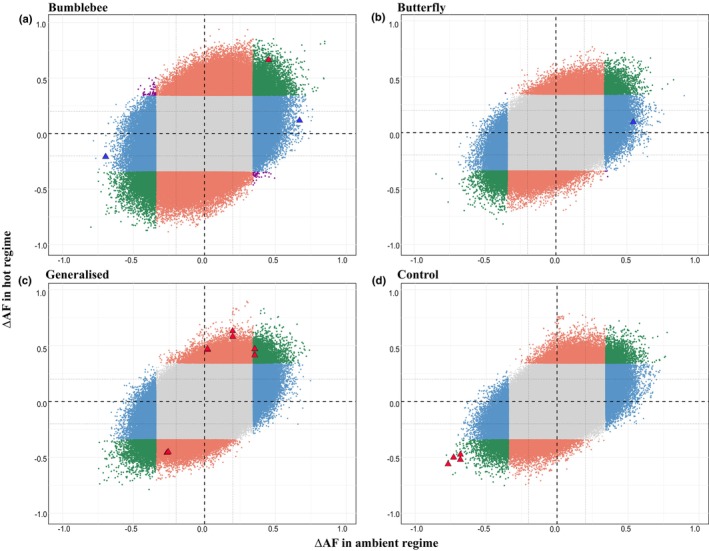 Fig. 3
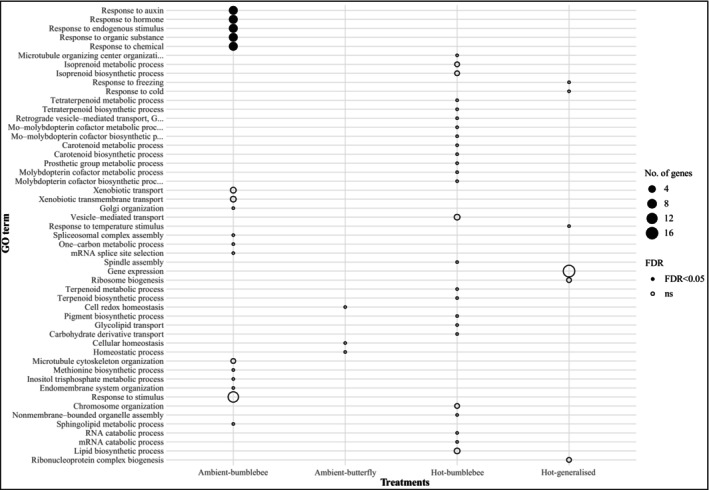 Fig. 4
| Populations | Temperature | Pollinators | Rep | π_MEAN (SD) | θ_MEAN (SD) | Tajima's D_MEAN (SD) |
|---|---|---|---|---|---|---|
| CBA | Ambient | Bumblebee | A | 0.219 (0.372) | 0.905 (0.529) | −2.939 (2.268) |
| CBB | Ambient | Bumblebee | B | 0.228 (0.319) | 0.869 (0.485) | −2.758 (2.216) |
| CPA | Ambient | Butterfly | A | 0.277 (0.408) | 0.843 (0.453) | −2.549 (2.236) |
| CPB | Ambient | Butterfly | B | 0.244 (0.368) | 0.929 (0.508) | −2.879 (2.372) |
| CGA | Ambient | Generalised | A | 0.297 (0.437) | 0.919 (0.489) | −2.681 (2.25) |
| CGB | Ambient | Generalised | B | 0.301 (0.434) | 0.89 (0.481) | −2.478 (2.233) |
| CHA | Ambient | Control | A | 0.291 (0.439) | 0.944 (0.524) | −2.794 (2.373) |
| CHB | Ambient | Control | B | 0.261 (0.373) | 0.829 (0.43) | −2.571 (2.236) |
| G1 | 0.318 (0.414) | 0.925 (0.47) | −2.621 (2.297) | |||
| HBA | Hot | Bumblebee | A | 0.194 (0.328) | 0.851 (0.504) | −2.874 (2.23) |
| HBB | Hot | Bumblebee | B | 0.204 (0.399) | 0.965 (0.589) | −3.13 (2.388) |
| HPA | Hot | Butterfly | A | 0.322 (0.475) | 0.937 (0.504) | −2.587 (2.235) |
| HPB | Hot | Butterfly | B | 0.262 (0.461) | 0.967 (0.523) | −3.052 (2.299) |
| HGA | Hot | Generalised | A | 0.254 (0.355) | 0.837 (0.442) | −2.549 (2.246) |
| HGB | Hot | Generalised | B | 0.272 (0.408) | 0.895 (0.516) | −2.572 (2.261) |
| HHA | Hot | Control | A | 0.291 (0.398) | 0.888 (0.472) | −2.543 (2.307) |
| HHB | Hot | Control | B | 0.339 (0.457) | 0.866 (0.469) | −2.435 (2.269) |
|
| ER_CMH significant (FDR < 0.05) SNPs | Local score genomic region | |||
|---|---|---|---|---|---|
| Chromosome | Genomic regions (Mb) | Length (kb) | |||
| Ambient‐bumblebee | 213 | 5311 | A01 | 21.20–22.16 | 957 |
| A03 | 3.30–3.84 | 578 | |||
| Hot‐bumblebee | 2177 | 61 653 | A03 | 7.88–8.70 | 882 |
| Ambient‐butterfly | 7913 | 2670 | A02 | 4.1725–4.1733 | 0.8 |
| Hot‐butterfly | 3698 | 1039 | – | – | – |
| Ambient‐generalised | 6252 | 2076 | – | – | – |
| Hot‐generalised | 6160 | 6133 | A03 | 10.00–10.40 | 396 |
| A03 | 19.14–19.44 | 300 | |||
| A09 | 31.33–31.98 | 649 | |||
| Ambient‐control | 11 665 | 798 | – | – | – |
| Hot‐control | 8599 | 1092 | A02 | 6.69–6.78 | 82 |
- —Swiss National Science Funds
Peer Reviews
No public reviews on file for this paper yet. If you reviewed it on a platform where reviews are public (OpenReview, ICLR, NeurIPS, ICML), you can paste yours below so the community can read it here.
Videos
No videos yet. Explain this paper in a talk, walkthrough, or lecture? Add one.
Taxonomy
TopicsPlant and animal studies · Genetic diversity and population structure · Animal Behavior and Reproduction
Introduction
Ongoing global environmental change is fundamentally reshaping the selective environments experienced by wild and cultivated plant populations world‐wide. Climate change, including rising temperatures, altered precipitation regimes, and more frequent extreme events, interact synergistically with biological pressures such as changing pollinator communities and herbivore dynamics to create increasingly complex and novel selection landscapes (Cohen & Leach, 2020; Desaint et al., 2021). Agricultural intensification at landscape scales, including increased use of agrochemicals and loss of seminatural habitats, represents a major driver of insect declines and community changes, further increasing the evolutionary pressures on plant populations. These combined abiotic and biotic stressors not only affect plant growth and reproduction directly but also modulate key ecological interactions, including pollination and herbivory, with cascading effects on evolutionary trajectories (Anderson & Mitchell‐Olds, 2011; Lasky et al., 2014; Zhu, 2016; Sato et al., 2024).
The recognition that pollinator‐mediated divergent selection drives floral evolution and plant speciation has deep historical roots, tracing back to Darwin's original insights and formalised by Grant (1949). This foundational concept has evolved into one of the most active areas in plant evolutionary biology, supported by mounting evidence across phylogenetic, ecological, and experimental scales (Fenster et al., 2004). Recent advances in experimental evolution methodologies and population genomics now provide unprecedented molecular resolution into these dynamics, revealing how pollinator interactions shape genomic evolution through complex networks of directional, balancing, and frequency‐dependent selection (De‐la‐Cruz et al., 2022). The integration of high‐throughput sequencing with controlled evolution experiments has transformed our understanding from phenotype‐focussed studies to genome‐wide portraits of adaptive change.
Distinct pollinator functional groups exert markedly different selection pressures on floral traits such as scent composition, morphological architecture, and nectar production dynamics, driving population‐level divergence in plant reproductive characteristics with remarkable rapidity (Knauer & Schiestl, 2017; Caruso et al., 2019; Dorey & Schiestl, 2024). Efficient pollinators such as bumblebees (Bombus spp.) can impose strong and consistent directional selection when acting as dominant visitors, generating pronounced allele frequency shifts at loci controlling floral adaptation within surprisingly few generations (Frachon & Schiestl, 2024). This evolutionary potential has been demonstrated through compelling experimental studies: nine generations of bumblebee selection in Brassica rapa produced significant trait divergence and altered selfing rates due to pollinator efficiency differences, accompanied by detectable genomic changes at multiple loci (Gervasi & Schiestl, 2017; Kofler et al., 2024). Natural populations provide complementary evidence for rapid pollinator‐mediated evolution, revealing how these processes unfold under more complex ecological conditions. Recent integrative studies on monkeyflowers have provided exceptional insights into ongoing adaptive walks during incipient pollinator shifts in wild populations. A 2025 study examined two independent yellow‐flowered forms that arose within red hummingbird‐pollinated species, revealing convergent evolution at multiple biological levels and demonstrating that large‐effect mutations in floral colour genes drive initial pollinator attraction shifts, followed by smaller‐effect changes in floral morphology and scent emission (Wenzell et al., 2025). These experimental and field studies collectively reveal that the genetic architecture underlying rapid pollinator‐mediated evolution varies considerably across systems and traits. While some evolutionary transitions are controlled by relatively few major‐effect loci, as seen in Mimulus pollinator preferences driven by flower colour and nectar production genes (Bradshaw & Schemske, 2003; Streisfeld & Rausher, 2009), other systems show more polygenic architectures where many small‐effect changes contribute to adaptive shifts (Zan & Carlborg, 2019; Gramlich et al., 2022; Minadakis et al., 2024). Furthermore, pollination systems involving multiple agent types or dual‐function visitors introduce fundamentally more complex selective regimes that can constrain or redirect evolutionary trajectories. For instance, butterflies function simultaneously as pollinators and herbivores, creating inherently conflicting selection pressures that generate nonadditive and highly context‐dependent evolutionary outcomes (Sletvold et al., 2015; Rusman et al., 2018, 2020; Schiestl et al., 2018; Frachon et al., 2023; Figueira et al., 2025). Such ecological complexity may be further buffered by phenotypic plasticity and epigenetic modifications, including herbivory‐induced DNA methylation changes that can alter floral traits substantially without requiring genomic sequence evolution (Kellenberger et al., 2016, 2018; Mukherjee et al., 2019). These mechanisms can effectively decouple phenotypic and genomic responses, significantly complicating the detection of adaptation at the DNA sequence level and highlighting the need for integrated approaches that consider multiple levels of biological pollinator type strongly impacts gene flow patterns both within‐ and among‐plant populations, suggesting the pollinator identity effects extend beyond immediate selection to influence broader evolutionary processes including population connectivity and local adaptation potential.
Temperature represents a critical ecological dimension that directly shapes plant–pollinator interactions by altering both partners' physiology and behaviour. On the plant side, elevated temperatures reduce pollen viability and germination, particularly in crop species (Rojas et al., 2024), and affect floral traits that mediate pollinator attraction, such as flower size, anthesis timing, and corolla morphology, potentially excluding mismatched pollinators (Scaven & Rafferty, 2013; Jagtap et al., 2023; Traine et al., 2024; Rusman et al., 2025). These changes cascade through mating systems and gene flow, altering evolutionary trajectories. For instance, heat‐stressed Vicia faba populations shift from 17% to 80% outcrossing in field conditions due to changes in pollinator activity and resource allocation, promoting genetic mixing and potentially accelerating selection for heat‐tolerant genotypes (Bishop et al., 2017). Earlier anthesis favours early‐foraging species while disadvantaging others, reshaping pollination network structure and cross‐pollination dynamics (Khan et al., 2024). Experimental warming studies also demonstrate that plant–bee interactions become less frequent and shorter in duration, ultimately reducing seed quality and quantity due to pollinator‐mediated fitness costs (de Manincor et al., 2023). Pollinators, in turn, respond strongly to thermal variation, altering their foraging efficiency, timing, and behaviour in ways that reshape selection pressures on floral traits (Scaven & Rafferty, 2013; Descamps et al., 2021; Moss & Evans, 2022). For example, bumblebees under heat stress display reduced flower visitation rates, altered handling times, and modified foraging bout durations, potentially changing both the strength and direction of selection on floral characteristics in nonlinear ways (Walters et al., 2022; Naumchik & Youngsteadt, 2023; Gérard et al., 2024). These temperature‐induced behavioural changes, in combination with altered plant physiology, may generate feedback loops that modulate the intensity and outcome of adaptive responses.
Beyond these immediate ecological effects, heat stress induces extensive changes at the regulatory, transcriptomic, and epigenetic levels that significantly complicate the detection and interpretation of classical genomic selection signals (Migicovsky et al., 2014; Yadav et al., 2022). Plants respond to heat stress through complex molecular networks involving signal transduction, metabolite production, and expression of heat stress‐associated genes, with heat stress tolerance being fundamentally polygenic in nature. Recent genome‐wide analyses in Brassicaceae have identified extensive families of heat shock responsive genes, including heat shock proteins (HSPs) and heat shock transcription factors (HSFs), many of which are associated with quantitative trait loci for heat stress response (Cantila et al., 2024). These findings suggest that temperature functions not only as a direct selective agent but also as a fundamental modulator of evolutionary potential and the genomic detectability of selection signatures in plant populations.
The interaction between temperature stress and pollinator‐mediated selection creates particularly complex evolutionary scenarios that are increasingly relevant under climate change. Understanding these interactions requires experimental approaches that can disentangle the relative contributions of abiotic and biotic factors while accounting for their nonadditive effects on both phenotypic and genomic evolution. Despite growing recognition of the independent effects of abiotic and biotic factors on plant evolution, their interactive influence on genomic evolution trajectories remains poorly understood (Nawaz et al., 2023; Dixit et al., 2024). This lack of understanding represents a critical knowledge gap in our ability to predict evolutionary responses under global change scenarios. Here, we address this fundamental gap by experimentally testing how temperature and pollinator identity interact to shape genomic adaptation patterns in a factorial evolution experiment. Using B. rapa as a model system, we employed factorial combinations of abiotic conditions (ambient vs hot temperature regimes) and biotic (bumblebee, butterfly, generalised pollinator–herbivore, and hand‐pollinated control) maintained across six generations of experimental evolution. We applied population genomic and functional annotation approaches to identify treatment‐specific selection signatures and investigate how ecological complexity shapes the genomic responses of adaptation. By integrating environmental, ecological, and genomic perspectives, our study provides novel insights into how climate and community‐level interactions jointly govern adaptive trajectories in plants.
Materials and Methods
Plant material and experimental evolution design
We used Brassica rapa L. (Wisconsin Fast Plants®, Carolina Biological Supply, USA), a mostly outcrossing annual species with a rapid life cycle (c. 2 months seed‐to‐seed under glasshouse conditions). This system has been used previously in experimental evolution studies due to its ease of handling, short generation time, and well‐characterised reproductive and genetic features (Gervasi & Schiestl, 2017; Ramos & Schiestl, 2019; Dorey et al., 2024; Dorey & Schiestl, 2024). All plant material was produced by previous experimental evolution in Traine (2025), from which we obtained leaf tissue samples for population genomic analysis.
Briefly, the base population consisted of 98 full‐sib families derived from hand‐crosses among 300 parental plants of B. rapa Fast Plants to increase standing genetic variation. Experimental evolution was then conducted for six generations in a factorial design, comprising two temperature regimes and four pollination regimes. The temperature regimes were (1) ambient (23°C) and (2) hot (27°C with a weekly 24‐h spike to 30°C), reflecting current and CH2018 projections for mid‐century northern Switzerland (Fischer et al., 2022; Federal Office of Meterology and Climatology Meteo Swiss, 2024). All plants were grown in climate‐controlled glasshouse cabins. All pots were watered twice‐daily, with additional checks to maintain equal soil moisture between temperature regimes, minimising any cofounding effects of drought. Within each temperature, we imposed three pollination regimes: bumblebee (Bombus terrestris), butterfly (Pieris rapae, including herbivory), and generalised (both species; including herbivory). And two control groups from hand‐pollination, served as an abiotic control capturing glasshouse background selection unrelated to pollinator behaviour. Each combination of temperature × pollination regime constituted a treatment, and each treatment was represented by two independent replicate populations (A and B), each initiated with 49 plants (in total 16 populations). Throughout the manuscript, we use ‘regime’ to refer to environmental factors (temperature or pollination), ‘treatment’ for each temperature × pollination combination, and ‘population’ for each replicate evolutionary line.
Bumblebee colonies were obtained from Andermatt Biocontrol (Switzerland) and kept in 3 × 1 × 1 m flight cages with supplemental nectar (BioGluc, Biobest, Westerlo, Belgium) and pollen (Blütenpollen Multiflora, KoRo Handels GmbH, Berlin, Germany). Butterflies were reared from laboratory colonies and supplied with B. rapa for feeding and oviposition. They were kept under controlled glasshouse conditions (22 ± 1°C, 60% RH, 16 h : 8 h, light : dark photoperiod) before the pollination. Insect visitation for pollination was allowed within the corresponding temperature regimes: ambient‐evolving plants in the ambient cabin and hot‐evolving plants in the hot cabin so that temperature also directly shaped pollinator activity and foraging behaviour.
Pollination protocols were designed to impose a comparable level of pollen limitation across pollinator types while preserving the natural behavioural differences that generate selection. Bombus bumblebees are highly efficient foragers that, under unrestricted conditions, visit nearly all flowers in a cage within a short period. In nature, such saturation rarely occurs because pollen is lost to other insects, grooming, or deposition on nonreproductive surfaces. To recreate a realistic level of pollen limitation in the experimental cages, while maintaining a selective component, we restricted bumblebee access by allowing each individual to visit only three plants before recapture and releasing in total 12 bumblebees sequentially. This approach standardised pollen delivered per bee, but it also meant that only a subset of plants received pollen, which directly reduced the number of reproductive contributors and therefore the realised effective population size (Ne).
By contrast, whereas bumblebees visit usually all flowers of one plant during a visit, Pieris butterflies normally visit fewer flower and more individual plants. Thus, in butterfly treatments, more plants received pollinator visits and thus got pollinated. Because they do not approach saturation even over several days, pollen limitation arises inherently from their behaviour rather than from imposed constraints. Accordingly, 25 mated butterflies were left in cages for 4 d, which yields a similar overall quantity of pollen transfer but typically to a larger number of plant individuals than in the bumblebee treatment. Thus, although pollen limitation per se was broadly comparable between pollinator types, the number of plants that actually set seed differed systematically, producing treatment‐specific realised Ne values. These demographic differences are crucial for downstream genomic analyses because selection acts on individuals, whereas drift is determined by the number of individuals contributing offspring. For the generalised treatment, the numbers of insects (6 bumblebees, 20 butterflies) were adjusted to maintain comparable total visitation and pollen transfer, while retaining the natural mixture of pollinator and herbivore interactions.
After each generation, seeds were dried and counted; the contribution of each plant to the next generation was proportional to its total seed number, ensuring fitness translates into offspring contribution to the next generation. To reduce maternal and transgenerational effects before genomic sampling, all populations underwent a seventh ‘refresher’ generation grown at ambient temperature with hand‐pollination (10 flowers per plant). Leaf tissues from the first and final generations were collected, immediately frozen at −80°C, and later freeze‐dried (−80°C, 100 h) before DNA extraction. Full experimental details – including insect husbandry, visitation protocols, and trait measurement procedures, are provided in Traine et al. (2024, 2025) and in Traine (2025, chapter II).
DNA extraction and pool‐sequencing
High‐molecular‐weight genomic DNA was extracted from freeze‐dried pooled leaf tissues using sbeadex plant kit in combination with the KingFisher Apex Robot (Thermo Fisher Scientific, Waltham, MA, USA), following the manufacturer's protocol. Pool‐seq libraries were prepared from each evolved population as well as from the ancestral G1 population. Within each pool, equal representation of individual replicates was ensured by first extracting DNA from each plant separately and then combining equal DNA mass per individual within that population. Only individuals with sufficient DNA quality and concentration were retained. An identical DNA amount from each was combined using a Brand pipetting robot, resulting in final pool sizes of 22–30 individuals per population pool (Supporting Information Table S1). Whole‐genome sequencing was performed at BGI Genomics (Poland). Paired‐end libraries were prepared using BGI Optimal DNA Library Prep Kit (BGI, Shenzhen, China) and sequenced on the DNBSEQ‐T7 platform (BGI) with 150‐bp paired‐end reads, targeting an average depth of c. 120× per pool to enable accurate allele frequency estimation. Initial read processing was conducted by BGI using SOAPnuke (BGI's in‐house pipeline), with filtering parameters: ‐n 0.001 ‐l 20 ‐q 0.5 ‐‐adaMR 0.25 ‐‐polyX 50 ‐‐minReadLen 150, removing adapters, polyX stretches, and low‐quality reads. After cleaning, reads were assessed with FastQC v.0.12.1, and the first 15 bases were trimmed before alignment.
Variant calling and filtering
Cleaned reads were aligned to the Brassica rapa FPsc v.1.3 reference genome, Phytozome release 12 (https://phytozome.jgi.doe.gov/pz/portal.html) using Bwa‐Mem2 (v.2.2.1, Vasimuddin et al., 2019). Variant calling followed the Gatk Best Practices pipeline (Depristo et al., 2011; Van der Auwera et al., 2013), using HaplotypeCaller for variant detection and Picard (v.3.3.0) to mark and remove duplicate reads (McKenna et al., 2010). Indels were separated from single‐nucleotide polymorphisms (SNPs) before downstream filtering (vcftools ‐‐remove‐indels) and were not included in subsequent analysis. Variant recalibration was conducted using a two‐step calibration approach (‐‐filter‐expression ‘QD < 2.0 || FS > 60.0 || MQ < 45.0 || DP > ${maxdepth}’ for SNPs, and ‐‐filter‐expression ‘QD < 2.0 || FS > 200.0’ for indels) (https://bioinformaticsworkbook.org/dataAnalysis/VariantCalling/gatk‐dnaseq‐best‐practices‐workflow.html#gsc.tab=0). Only SNPs located on the 10 chromosomes were retained; unassigned scaffolds were excluded using VCFtools v.0.1.16 (Danecek et al., 2011). Additional SNP filtering criteria were defined empirically from the observed read‐depth distribution (mean ≈ 53×; range ≈ 18–160×): ‐‐min‐meanDP 18 ‐‐max‐meanDP 160 ‐‐MAF 0.1 ‐‐min alleles‐2 ‐‐max‐alleles 2 ‐‐max‐missing 0.95 ‐‐minGQ 15. SNPs located in repetitive or low‐complexity regions were excluded using the ‐‐exclude‐bed option with a custom annotation file derived from the B. rapa genome. For downstream population genetic analyses, samtools mpileup was used to extract SNP‐level read counts, which were then converted to synchronised allele frequency data using PoPoolation2 (mpileup2sync.pl; Kofler et al., 2011b).
Genetic population structure, differentiation, and diversity
To compare standing genetic variation in Wisconsin Fast Plants with natural B. rapa populations, we estimated genome‐wide nucleotide diversity (π_all sites) for the ancestral generation one (G1) population using an all‐sites mpileup including invariant positions (samtools mpileup ‐aa). Analyses were restricted to callable, nonrepetitive regions of the 10 chromosomes using the same repeat mask and depth/quality thresholds applied to SNP filtering (MAPQ ≥ 20, baseQ ≥ 20, min depth 18, max depth 160). π was calculated with PoPoolation (Variance‐sliding.pl; Kofler et al., 2011a) and averaged across windows; uncertainty was evaluated via bootstrap resampling.
Allele frequencies for each population were estimated using PoPoolation2 (snp‐frequency‐diff.pl), with filtering thresholds set to ‐‐min‐count 12, ‐‐min‐coverage 18, and ‐‐max‐coverage 150. To assess patterns of within‐population diversity, we calculated nucleotide diversity for all SNPs dataset (π_SNPs), Watterson's θ, and Tajima's D using grenedalf (Czech et al., 2024), employing the following parameters: ‐‐filter‐sample‐min‐count 2, ‐‐filter‐sample‐min‐read‐depth 4, ‐‐window‐type interval, ‐‐window‐interval‐width 50 000, ‐‐window‐average‐policy valid‐snps, ‐‐filter‐total‐min‐read‐depth 18, and ‐‐filter‐total‐max‐read‐depth 150. Estimates of expected heterozygosity (H e) were computed using the compute.fstats function from PoolFstat v.2.1.2 (Hivert et al., 2018; Gautier et al., 2022, 2024), based on the formula H = 1 − Q1, where Q1 represents the probability of identity‐in‐state among alleles within a population. Calculations were based on the filtered set of biallelic SNPs, excluding invariant sites. To evaluate genome‐wide population structure, a principal component analysis (PCA) was performed using the glPca function (adegenet package v.2.1.11, Jombart, 2008; Jombart & Ahmed, 2011), implemented in R v.4.3.1 (R Core Team, 2023). Pairwise population differentiation was estimated using Hudson's F ST, calculated with the compute.pairwiseFST function in PoolFstat v.2.1.2.
Drift expectations and simulations
As a consequence of the pollen‐limitation design and random variation in visitation, the number of plants that contributed seeds differed across populations, producing different population‐specific realised effective population sizes (N e, Table S1). Nonvisited plants were excluded from seed collection to ensure reproductive success reflected realised pollination. In the bumblebee treatments, only the subset of plants visited by bumblebees contributed to the next generation (N e ≈ 18). In butterfly and generalised treatments, a larger proportion of plants received sufficient visitation, yielding larger N e (≈35). These N e estimates were derived empirically from census data and used to parameterise neutral simulations and drift expectations.
We then quantified neutral expectations for allele‐frequency change (|ΔAF|) under the realised demography using:
where p 0 is the ancestral allele frequency, p is the allele frequency after t generations, and N _e,g _ is the realised effective population size in generation g. Each term describes drift in a single generation. Multiplying them links drift across generations. This gives the expected amount of allele‐frequency change under neutrality for each treatment. We used this expression to calculate the neutral range (95% bounds) for |ΔAF|, which were then compared with observed allele‐frequency shifts. To complement the analytical range, we also simulated 10^5^ neutral SNPs per treatment by drawing initial frequencies from the empirical G1 allele‐frequency spectrum and propagating them forward for six generations using the treatment‐specific N e sequence (N e1…N e6). The resulting null distributions of |ΔAF| and F ST were then compared against observed values, and excess tail probability was interpreted as significant support for locus‐specific selection.
To account for background genomic change unrelated to pollinator‐mediated selection, we additionally used the hand‐pollinated populations (ambient and hot) as empirical controls, capturing adaptation to glasshouse conditions but lacking biotic selective agents (CBA/CBB, HBA/HBB).
Genetic signatures of selection
To identify genomic regions under selection in our experimental evolution study, we implemented a comprehensive analytical framework integrating SNP‐level outlier tests, regional signal enrichment, and cross‐method validation. Each treatment was compared against a shared initial (G1) pool. Given the short evolutionary time frame and the pool‐sequencing approach, our pipeline was designed to maximise detection sensitivity while controlling for false positives and replicate effects. Here, we note a key methodological comparison with earlier bumblebee‐selection experiments conducted in the same system. Previous studies (Dorey et al., 2024) used individually sequenced plants and phenotype–genotype association tests, which provide high sensitivity for detecting selection even when drift is substantial. By contrast, our pool‐seq does not link genotypes to individual fitness components, drift must be modelled explicitly, and detection thresholds must be more conservative to avoid false positives. Consequently, our selection results are expected to be less sensitive but more stringent than those obtained from individual sequencing approaches. Both strategies capture complementary aspects of evolutionary change: individual‐level analyses detect selection correlated with measured traits, whereas pooled, drift‐calibrated genomic scans emphasise robust, replicable allele‐frequency shifts across the whole genome.
In the SNP‐level detection, we first computed absolute allele frequency difference (AFD) for every SNP in each population: ΔAF=AFfinal−AFG1. For each population, the effective |ΔAF| threshold was set to the larger of the population‐specific 95^th^ percentile predicted under neutrality and the empirical control baseline (from previous section). A SNP was therefore considered to show significant shift only when |ΔAF| exceeded the relevant population‐specific threshold in both replicates within a treatment. Comparing ΔAF between ambient and hot, each SNP was assigned to one of four classes: (1) Background, |ΔAF| below the calibrated threshold in both regimes; (2) Global adaptation to pollinator, same‐signed shifts above threshold in both regimes. (3) Conditional adaptation, above threshold in only one regime; and (4) Antagonistic pleiotropy, opposite‐signed shifts above threshold in both, indicating opposite fitness effects across temperatures.
To compensate for the lack of variance‐normalising denominator of AFD, we then applied Hudson's F ST to evaluate allele frequency divergence between each final‐generation replicate and the initial G1 population with R package poolfstat v.2.1.2. Hudson's formulation is well‐suited for pool‐sequencing designs, as it accounts for both within‐ and between‐population variance and is less biased by uneven sequencing depth than other F ST metrics, which allows for more robust statistical comparisons across loci and replicates, especially when combining data with variable coverage or sampling error (Bhatia et al., 2013; Hivert et al., 2018).
To ensure biological relevance and replicate‐level consistency, we applied a conservative three‐step filtering strategy aligned with the recalibrated nulls. First, directional consistency: SNPs were required to show allele‐frequency shifts in the same direction across both replicates (i.e. both increasing or both decreasing relative to G1). Second, replicate concordance: |ΔAF| had to exceed the calibrated thresholds (above) in both replicates simultaneously. Finally, outlier thresholding: each replicate's F ST had to exceed its population‐specific neutral 95^th^ percentile from the drift analysis. This approach adapts earlier strategies based on AFD (e.g. López et al., 2025), while leveraging the statistical advantages of F_ST_ for population‐level allele frequency data. The resulting SNP set provided a stringent but scalable foundation for identifying high‐confidence selection signals in downstream analyses.
Accurately accounting for linkage disequilibrium (LD) is essential when identifying selection signals across the genome. However, traditional LD estimation based on individual genotypes is not directly applicable to pool‐sequencing data. To address this, we used LDx (Feder et al., 2012), a tool specifically designed to estimate LD from pooled allele frequencies. Despite its adaptation for pool‐seq, LDx has known limitations in precision, particularly under experimental evolution conditions with limited generations and low sampling variance. To avoid prematurely filtering informative sites while still accounting for LD structure, we instead applied the local score approach (Fariello et al., 2017). This method retains the full SNP dataset while detecting clusters of moderately significant SNPs, which are likely to reflect underlying LD or selection on linked haplotypes. This strategy allows us to preserve signals that might be disrupted by hard LD pruning, while still incorporating genomic structure in a statistically informed way. Based on a recent benchmarking evaluation of selection detection methods in pool‐sequencing data (Vlachos et al., 2019) and to account for replicate structure, we implemented a top‐performing region‐level approach to identify signatures of selection: the Evolve‐and‐Resequence Cochran–Mantel–Haenszel (ER_CMH, MartaPelizzola/ACER package) (Spitzer et al., 2020). This method is well‐suited to detecting clusters of moderately differentiated SNPs, which may reflect soft sweeps or linked selection variants. This likelihood‐based test evaluates allele frequency shifts across replicates relative to the initial G1 pool while adjusting for drift and sampling variance. The G1 pool was duplicated across replicates to match the evolved population structure. Resulting P‐values were corrected with the Benjamini–Hochberg false discovery rate (FDR) procedure to make Manhattan plot.
To identify genomic regions with clusters of moderately significant SNPs, we applied the local score approach based on the Lindley process (Fariello et al., 2017). Raw P‐values from ER_CMH were converted to scores using –log_10_(q) − ξ (ξ = 1 for relaxed threshold and ξ = 2 for strict threshold). Cumulative Lindley scores were calculated along each chromosome. Significance thresholds were determined by fitting a Gumbel distribution to the maxima of 5000 resampled score trajectories across genomic windows of 10–70 kb. Chromosome‐specific thresholds were applied at the 5% significance level to define enriched genomic intervals.
Functional annotation of selective genomic regions
To improve specificity and account for the short experimental timescale, we integrated the outputs from the SNP‐level and region‐level analyses and retained only regions that were independently significant in both F ST significant and ER_CMH‐local score analyses. This yielded a conservative set of high‐confidence loci under selection. The final candidate genes, identified through relaxed selection filtering, were annotated using Bedtools intersect against gene models from the Brassica rapa FPsc v.1.3 reference genome (Phytozome release 12). Gene identifiers and functional descriptions were extracted using custom parsing scripts and matched to the official annotation database. For each treatment, we performed Gene Ontology (GO) enrichment using topGO (classic Fisher test), with all annotated genes as the background. We report both raw P‐values and Benjamini–Hochberg FDR–adjusted P‐values (FDR < 0.05), noting that only a small number of terms remained significant after FDR correction. Enrichment results were used to highlight biological processes that may underlie treatment‐specific adaptive responses.
Results
Overall genomic divergence patterns
We sequenced and analysed pooled genomic data from 17 populations, including the initial generation (G1) and 16 evolved populations spanning eight treatment combinations (2 temperatures × 4 pollination regimes with 2 replicates). After quality filtering and variant calling, we retained a total of 1787 629 high‐confidence bi‐allelic SNPs across all samples for downstream analyses.
The G1 population exhibited a genome‐wide nucleotide diversity of π = 0.0086 per site (95% bootstrap CI: 0.00858–0.00863), calculated across all callable, nonrepetitive genomic sites. While this genome‐wide estimate reflects absolute genetic diversity across all sites (including invariant positions) and allows direct comparison with natural populations, subsequent analyses of population differentiation and heterozygosity were performed on the filtered SNP dataset. This SNP‐based dataset provides a robust basis for relative comparisons among treatments since all populations were aligned to the same reference genome and underwent identical variant calling and filtering procedures. Within this framework, compared to the G1 (expected heterozygosity = 0.39), all evolved populations exhibited reduced heterozygosity, with the most pronounced loss observed in hot environments with bumblebee‐pollination (HBA and HBB; H e = 0.32 and 0.29, respectively; Fig. 1a).
Genome‐wide patterns of diversity and population structure following experimental evolution. (a) Expected heterozygosity in initial (G1) and evolved populations under different temperature and pollination treatments. (b) Principal component analysis of genome‐wide allele frequencies, showing genetic divergence of evolved populations from G1 and clustering by treatment. (c) Pairwise Hudson's F ST heatmap between all population pairs, reflecting genome‐wide genetic differentiation. Treatment codes follow the structure: first letter denotes temperature regime (C for ambient, H for hot), second letter indicates pollination regime (B: bumblebee (Bombus terrestris), P: butterfly (Pieris rapae), G: generalised, H: control (hand‐pollination)), and third letter indicates replicate (A or B). G1 samples are shown in dark grey; ambient treatments are shaded in blue, and hot treatments in red.
PCA based on allele frequencies revealed variable levels of separation among treatments. Specifically, populations evolved under the hot bumblebee (HB) condition showed a distinct separation along the first principal component (PC1), which explained 16.5% of the variance, while other treatments clustered more closely together. Within the HB treatment, the two replicates (HBA and HBB) were further separated from each other along the second principal component (PC2), indicating both treatment‐specific and replicate‐level divergence (Fig. 1b). Pairwise F ST values further supported these observations. The greatest genomic divergence from G1 was observed in the hot bumblebee treatment, with HBA and HBB showing F ST values of 0.088 and 0.139, respectively. By contrast, other treatments displayed lower F ST values, typically ranging from 0.021 to 0.063 (Fig. 1c).
We further calculated genome‐wide summary statistics, including nucleotide diversity (π), Watterson's θ and Tajima's D, to assess shifts in genetic variation across treatments. All evolved populations showed reduced nucleotide diversity relative to the initial pool, consistent with strong selection or genetic drift during the experimental evolution. The most pronounced reduction in π occurred in the hot bumblebee treatment, dropping from 0.318 (G1) to 0.194 and 0.204 in HBA and HBB, respectively (Table 1). Tajima's D values were consistently negative across treatments, with the strongest shift observed in the hot bumblebee populations (HBA: –2.874; HBB: −3.130). Given the known limitations of Pool‐seq data for estimating absolute values (Czech et al., 2024), we emphasise contrasts among treatments and directional consistency rather than interpreting absolute values.
Demography and drift impact genome‐wide divergence and the resolution of selection signals
Genome‐wide reductions in heterozygosity, elevated F ST, and negative Tajima's D in the bumblebee treatments coincide with realised small N e, whereas the control populations and other pollinator regimes retained considerably larger values. Neutral Wright–Fisher simulations parameterised by these trajectories reproduced the magnitude of genome‐wide drift expected under each demographic regime. The resulting 95^th^ percentiles of absolute allele‐frequency change (|ΔAF|) and Hudson's F ST differed markedly among populations, with bumblebee regimes yielding the highest thresholds (|ΔAF|95 ≈ 0.34–0.35; F _ST_95 ≈ 0.55–0.57; Table S2). The empirical control baseline provided an additional benchmark for glasshouse‐specific variance (|ΔAF|95 = 0.32–0.36), and the final cut‐offs for each treatment were defined as the maximum between the neutral and empirical limits. For most populations, the empirical‐control distribution determined the effective threshold, whereas in bumblebee populations, the neutral expectation dominated owing to their small N e.
Environmental treatments drive distinct genomic signatures of selection
The composite selection signals among F ST outlier scan, ER_CMH test and local score analysis showed a highly treatment‐specific pattern (Table 2; Fig. 2). Explicitly, we first tested for common genomic regions selected across treatments grouped by pollinator identity (i.e. bumblebee, butterfly, generalised‐pollination across temperature regimes) and by temperature conditions (i.e. hot vs ambient across pollinator treatments), but found no universally shared genomic regions responding consistently across these broader ecological factors, highlighting the strong specificity of genomic responses to each unique combination of pollinator identity and temperature. Overlaps within pollinator identities or temperature regimes were also limited, further highlighting the context‐dependent nature of selection.
Genome‐wide single‐nucleotide polymorphism (SNP)‐level and local score regional selection signals across treatments. The basic Manhattan plots showed −log10(P‐values) from Evolve‐and‐Resequence Cochran–Mantel–Haenszel test (ER_CMH) across all 10 chromosomes, separated by black and grey. The horizontal panels from top to bottom represent pollination regimes: bumblebee, butterfly, generalised, and control, respectively. The vertical panels from left to right represent ambient and hot regimes, respectively. The black and grey dots represent all SNPs in different chromosomes. Red dashed lines indicate false discovery rate = 0.05 in ER_CMH. Red dots represent the SNPs that are significantly different from neutral drift simulations. Blue vertical lines and downward triangles highlight genomic regions where ER_CMH outlier overlap with the F ST outliers, suggesting convergent signals of selection. The thickness of each vertical line reflects the physical length of the overlap between ER_CMH and local score‐significant regions (see Table 2, for detailed chromosome, coordinates and length). Numbers near each blue peak indicate the count of significant SNPs within each overlapping region. No selection region was shared across pollinator or temperature regimes.
Because each analytical layer captures a different aspect of allele‐frequency change, we summarised all results in three datasets according to increasing stringency (Table 2): (1) F ST‐thresholding filters for shifts unlikely under drift, (2) ER_CMH identifies replicated allele‐frequency shifts, and (3) local score clusters adjacent SNPs with consistent signals into genomic intervals. Candidate intervals that satisfy all three criteria represent the strongest evidence for selection. Eight genomic intervals met all three criteria: two in the ambient‐bumblebee treatment, one in hot‐bumblebee, one in ambient‐butterfly, three in hot‐generalised and one in hot‐hand. All other treatments, including hot‐butterfly treatments, ambient‐generalised, and cold‐hand, showed no significant intervals after drift correction. These outcomes reflect differences in both allele‐frequency trajectories and realised demographics. In the hot‐generalised treatment, moderate N e and consistent replicate shifts produced clear, drift‐filtered intervals. By contrast, bumblebee treatments showed large genome‐wide divergence but few drift‐exceeding loci, a consequence of the small realised N e imposed by the pollination protocol. Hot‐butterfly treatment exhibited allele‐frequency changes that fell entirely within neutral ranges, resulting in no significant intervals.
Directional reversals across temperature regimes (antagonistic pleiotropy) occurred in few SNP‐level counts from F ST‐thresholding filters for shifts unlikely under drift (127 SNPs in bumblebee, five in butterfly, five in generalised, none in hand; Fig. 3; Table S3), but permutation analyses suggested these SNPs were within the threshold of neutral expectations. Thus, although allele‐frequency change was widespread, only a small subset of loci showed evidence for treatment‐specific selection, and these selective responses emerged under particular combinations of pollinator identity, temperature, and realised N e.
Temperature‐dependent allele frequency change reveals distinct patterns of genomic adaptation across pollinator treatments. Each panel shows allele frequency changes (ΔAF) between initial (G1) and evolved populations for different pollinator regimes: (a) bumblebee, (b) butterfly, (c) generalised (bumblebee + butterfly), (d) control. X‐axis represents ΔAF in ambient regime; Y‐axis represents ΔAF in hot regime. Black dashed lines indicate ΔAF = 0 (no change). Each dot represents a single‐nucleotide polymorphism (SNP). Classification: background SNPs (light grey dots) represent SNPs with |ΔAF| < threshold (0.345 for bumblebee, 0.343 for the rest) in both temperature regimes. Global adaptation SNPs to pollinator (green dots): |ΔAF| ≥ threshold in both temperature regimes. Conditional adaptation SNPs (blue dots for ambient‐specific, red dots for hot‐specific, respectively): |ΔAF| ≥ threshold in one condition but not the other, representing the loci responding specifically in temperature × pollinator interactions. Antagonistic pleiotropy SNPs (purple dots): |ΔAF| ≥ threshold in both temperature regimes but in opposite directions of change between temperatures, which are in upper‐left and lower‐right quadrant. This indicates loci where alleles beneficial in one temperature are detrimental in the other. Triangle overlays: SNPs overlapping with selection signals from other analyses (Evolve‐and‐Resequence Cochran–Mantel–Haenszel test and F ST), blue for ambient‐specific while red for hot‐specific, respectively.
Identification of candidate genes
To infer function of targets of selection, we annotated the stringiest genomic regions where independent scans converged: the regions supported by all three tests (Table 2). Across all treatments, 558 genes overlapped with these high‐confidence genomic regions (Table S4). The hot‐generalised and ambient‐bumblebee treatments contributed the largest genomic regions and greatest number of candidates (206 and 190 genes, respectively), whereas hot‐bumblebee treatments, despite exhibiting strong genome‐wide divergence, yielded a single large genomic region (882 kb) surpassing both neutral and empirical thresholds, consisting of 154 genes. Only small regions (0.8 kb and 82 kb consist of 2 and 6 genes, respectively) under selection in ambient‐butterfly and hot‐control treatments, respectively. And no regions were detected in hot‐butterfly or ambient‐generalised treatments.
GO enrichment yielded few FDR‐corrected terms overall (Table S5). Ambient‐bumblebee was the only treatment showing FDR‐significant enrichment, with five biological process terms, all linked to auxin and hormone responses. They are driven by a cluster of small auxin up‐regulated RNA (SAUR)‐like auxin‐responsive genes (Brapa.C00791/92/93/94/95/96/97/99). These results point to hormonal regulation and growth responses as the most coherent signature of selection in this treatment. Other treatments showed no FDR‐significant GO terms. However, several nominally enriched categories (raw P < 0.05) highlighted treatment‐specific tendencies: secondary‐metabolic and membrane‐trafficking processes in hot‐bumblebee populations, stress‐ and temperature‐response terms in the hot‐generalised treatment, and redox and cellular homeostasis in the butterfly treatments (Fig. 4). Given the small number of selected loci, we interpret nominal enrichments cautiously, but together with the candidate‐gene list they provide a functional scaffold for downstream hypotheses.
Gene Ontology (GO) Biological Process enrichment for genes located in selection‐supported genomic regions across treatments. GO enrichment (classic Fisher's exact test) was performed separately for each treatment using genes overlapping Evolve‐and‐Resequence Cochran–Mantel–Haenszel–local score candidate genomic regions. Circle size indicates the number of genes annotated for each GO term, and fill indicates whether terms remained significant after false discovery rate correction (FDR < 0.05). Only the ambient‐bumblebee treatment showed FDR‐significant enrichment, driven by auxin‐responsive processes. Hot‐bumblebee, hot‐generalised, and ambient‐butterfly treatments exhibited only nominally enriched terms (raw P < 0.05), reflecting secondary metabolism, membrane trafficking, temperature‐response, and cellular homeostasis, respectively. Full GO lists and associated gene sets are provided in Supporting Information Table S5.
Discussion
Ecological interactions generate highly context‐dependent genomic responses
Our evolve‐and‐resequencing experiment revealed treatment‐specific genomic signatures shaped by interactions between biotic (pollinator identity) and abiotic (temperature) conditions. Overall, selection signals varied substantially across treatments, with no universal genomic regions consistently shared by all treatments or even within broader groupings based on either pollinator identity or temperature alone. Rather, genomic responses were distinctly contingent upon specific combinations of pollinator identity and temperature, underscoring the critical role of ecological interactions in shaping adaptive genomic trajectories.
Standing genetic variation and demographic constraints set the evolutionary baseline
Adaptation in short‐term experimental evolution depends fundamentally on both the amount of standing genetic variation and the demographic conditions under which selection operates. Our experiment began with a genetically diverse starting population generated from 98 full‐sib families, reflected in a genome‐wide nucleotide diversity estimate π = 0.0086. This is closely matching values reported for natural B. rapa populations (π ≈ 0.0096; Franks et al., 2016). This confirms that our starting population retained natural levels of polymorphism, providing sufficient standing variation to respond to selection (Hermisson & Pennings, 2005, 2017; Barrett & Schluter, 2008).
The pollination treatments were designed to impose pollen limitation, a widespread feature of natural plant populations (Ashman et al., 2004; Knight et al., 2005). Bumblebees were given restricted foraging periods to maintain variation in male reproductive success, whereas butterflies naturally provide lower pollen transfer efficiency and work fewer flowers in one plant visit. As a consequence, only a subset of plants contributed seeds each generation (Traine et al., 2024), producing treatment‐specific realised effective population sizes. Such variation in N e is expected in both controlled and natural systems, in which unequal reproductive success, phenological mismatch, and stochastic pollinator visitation routinely lower N e relative to census size (Willi et al., 2007). These demographic filters shape the background variance in allele‐frequency change (Wright, 1931; Charlesworth, 2009) and therefore influence how readily selection can generate detectable genomic signals over six generations. Recognising these baseline constraints is essential: the genomic signatures we recover reflect not only the strength and direction of selection but also the opportunity for selection to overcome drift under each ecological scenario.
Temperature modulates the strength, detectability, and genomic architecture of pollinator‐mediated selection
Temperature changed both the strength and the resolution of pollinator‐mediated selection. These thermal effects acted through shifts in pollinator behaviours, community composition, and realised effective population size. Pollinator taxa differ strongly in their thermal tolerance and behavioural responses to warming. In our system, bumblebee visitation remained stable, whereas butterfly visitation increased sharply at higher temperatures (Traine et al., 2024, 2025; Traine, 2025). This variation reflects patterns documented across natural communities (Creux et al., 2021; Moss & Evans, 2022), where warming reshapes interaction timing, foraging frequency, and network structure in species‐specific ways. Such heterogeneity alters the direction and strength of selection. Some plant–pollinator links weaken when thermal stress disrupts synchrony or reduces reward quality (Descamps et al., 2021). Other interactions intensify because warming promotes activity in certain insect groups (Rojas et al., 2024).
Bumblebee pollination has been shown to exert strong directional selection on B. rapa's floral traits and lead to rapid evolution (Gervasi & Schiestl, 2017; Ramos & Schiestl, 2019; Dorey et al., 2024; Frachon & Schiestl, 2024). Our genomic results are consistent with strong bumblebee‐mediated selection, yet the extent to which these signals are detectable depends strongly on both temperature and resolution afforded by the sequencing approach. Compare to the ambient regime, the plants under warming yields a genome‐wide differentiation. Yet in the bumblebee‐only treatments, the small realised population size generated substantial genome‐wide drift. This inflated background noise allowed only a subset of truly selected loci to exceed our conservative, drift‐based thresholds. However, this reduced detectability does not necessarily indicate weak selection but rather reflects the limits of pool‐sequencing for resolving locus‐specific effects in the presence of strong drift. As suggested in the phenotypic analyses, Traine et al. (2024, 2025) show that bumblebees impose strong, multivariate selection across environments. By contrast, studies using individually sequenced plants (e.g. Dorey et al., 2024) can identify many more candidate loci because genotype–phenotype associations provide direct evidence of fitness effects, enabling detection of selection even when drift is expected to be substantial. Thus, the smaller number of high‐confidence regions in our bumblebee treatments reflects methodological stringency rather than weaker selection and should be interpreted as a conservative genomic footprint that remains after accounting for demographic noise and replicate consistency.
Even under these conservative criteria, a small subset of loci (127 SNPs) displayed opposite allele‐frequency shifts between temperatures. Although these counts did not exceed permutation‐based expectations, the pattern is qualitatively consistent with temperature‐dependent antagonistic pleiotropy. Such environmentally inverted allele effects are well‐documented. For example, HSP101 enhances thermotolerance but reduces fruit set in benign conditions (Qin et al., 2021), MAF2–5 modulates floral traits through temperature‐dependent splicing (Wiszniewski et al., 2022), and anthocyanin‐pathway genes produce attractive pigmentation at ambient temperatures but reduced colour under heat (Alcantud et al., 2023). These mechanisms illustrate how warming can reverse fitness consequences of the same allele and provide a plausible basis for the subtle opposing trajectories we observe. Importantly, phenotypic outcomes mirror this genomic interpretation: plants evolving under bumblebee‐pollination maintained fruit and seed production under heat, whereas hand‐pollinated controls suffered pronounced fertility loss in hot conditions (Traine et al., 2025). Thus, bumblebee visitation led to adaptive evolution buffering negative effects of warm temperature, even though demographic constraints limited our ability to detect the full genomic footprint of selection.
In the butterfly pollination treatment, the genomic response was strikingly weak despite strong directional phenotypic selection documented in the same experimental system. Phenotypic analyses showed that butterflies imposed clear positive directional selection on multiple floral and vegetative traits at both temperatures, with temperature shifting the specific trait targets (e.g. leaf number under heat) rather than reducing selection strength (Traine, 2025; Traine et al., 2025). Yet, despite this consistent phenotypic selection, no genomic regions exceeded our drift‐corrected thresholds in hot environments.
This disconnect suggests that selection in butterfly‐pollinated populations was diffuse, polygenic, or acting through regulatory pathways not detectable as strong allele‐frequency shifts over six generations. The dual role of P. rapae as both pollinator and herbivore likely amplified this complexity: Warming increased oviposition and larval feeding, creating a mixed mutualistic–antagonistic regime that can weaken or diversify genomic responses. Supporting this, previous work in B. rapa shows that herbivory can induce heritable epigenetic changes in floral traits without accompanying DNA‐sequence evolution (Kellenberger et al., 2016, 2018). Such mechanisms offer a plausible explanation for why phenotypic evolution was evident, but allele frequencies remained largely unchanged. Together, these results indicate that butterfly‐mediated selection was strong at the phenotypic level but not expressed as concentrated genomic sweeps, most likely because selection operated on many small‐effect loci, on epigenetic regulation, or on traits whose genetic bases were insufficiently large to exceed drift under the experimental timescale and population sizes (Schmid et al., 2018). Such nonparallel genomic responses despite parallel phenotypic evolution have been documented across diverse experimental evolution systems, including previous work in this B. rapa system (Frachon & Schiestl, 2024) and others spanning Drosophila, marine flies, Arabidopsis, and wild strawberry (Barghi et al., 2019; De Kort et al., 2022; Konečná et al., 2022; Fuhrmann et al., 2023).
In the generalised treatments, in which B. rapa interacted simultaneously with multiple mutualistic and antagonistic partners, warming reshaped the selective landscape in ways not observed in the single‐pollinator regimes. In our experiment, butterflies greatly increased their visitation rates under heat, with warming elevating total floral visits nearly fivefold in the generalised condition (Traine, 2025). This rise increased the number of seeds that reproduced each generation. Although it does not change N e between temperature regimes, the larger N e reduced drift relative to the bumblebee‐only treatment, in which pollen‐limitation controls restricted reproduction to a small subset of plants and drift overwhelmed locus‐specific signals. Importantly, this demographic shift clarifies why strong genomic signatures appeared in the hot‐generalised regime: the same bumblebee‐mediated selection that was present but masked in the bumblebee‐only treatments became detectable once drift was buffered by community‐level pollination.
This interpretation is consistent with the absence of clear selection peaks in butterfly‐only treatments, in which genomic responses were weak and likely diffuse across many small‐effect or regulatory loci. By contrast, under the community context, bumblebee‐imposed selection could rise above the reduced drift background and produce discrete genomic intervals. Phenotypic analyses from the same experimental system showed that warming also changed the traits under selection in these mixed communities – favouring, for example, increased leaf number and altered volatile emissions rather than classic pollinator attraction traits. The genomic intervals detected only in the hot‐generalised treatment align with these shifts and indicate that elevated temperature, increased butterfly activity, and intensified herbivory together created emergent and detectable selection pressures that were absent in ambient conditions and not predictable from single‐pollinator treatments alone.
Taken together, these results converge on a general principle: the genomic imprint of pollination is shaped not only by pollinator identity and temperature but also by the demographic consequences of their interaction behaviours. Bumblebees are capable of imposing strong directional selection, yet in single‐pollinator treatments the small realised N e caused by pollen‐limitation controls allowed drift to dominate, masking most locus‐specific signatures. Only ecological contexts that maintain larger numbers of reproductive contributors, such as the community‐level treatments where butterfly visitation greatly increased N e, permitted bumblebee‐mediated selection to rise above background noise and become detectable in genomic data. Temperature further modified both the strength and detectability of selection by altering visitation rates, affecting herbivory pressure, and shifting how many plants contributed offspring each generation.
Across treatments, the genomic architecture of adaptation was therefore subtle, diffuse, and highly context‐dependent. This is consistent with theoretical and empirical expectations that rapid evolution in outcrossing plants often proceeds through polygenic and regulatory changes rather than single large‐effect loci (Yeaman, 2015; Hermisson & Pennings, 2017; Barghi et al., 2019; Schlötterer, 2023). This helps explain why phenotypic selection gradients were strong and repeatable across environments, whereas genomic signals were sharply contingent on N e, temperature, and community composition.
Functional insights from candidate genomic regions
In the GO enrichment analysis, although only five GO terms exceeded both drift‐corrected and empirical control‐derived thresholds, the functional patterns emerging from these candidates provide insight into the molecular pathways that may underpin rapid adaptation in this system. The strongest signal came from ambient‐bumblebee treatments, which showed significant enrichment of auxin‐ and hormone‐responsive biological process terms. This signal was driven by a cluster of SAUR‐like auxin‐responsive genes, a gene family widely implicated in growth regulation, floral development, and hormone‐mediated responses to biotic and abiotic cues. Auxin signalling influences several pollinator‐relevant traits, including floral morphology, branching, and resource allocation, suggesting that even under relatively mild thermal conditions, bumblebee pollination can favour regulatory variants that tune developmental processes.
Although other treatments did not retain FDR‐significant GO enrichment, the nominally enriched terms reveal biologically meaningful patterns that connect our genomic signals to known phenotypic responses. In the hot‐bumblebee treatment, enriched categories were dominated by pathways involved in specialised secondary metabolism, including terpenoid and carotenoid biosynthesis, and membrane‐trafficking processes. These processes are directly relevant to floral volatile production and emission, which showed clear phenotypic shifts in the same experimental system (Traine et al., 2025). Among the candidate loci, geranyl diphosphate synthase 1 (GPPS1; Brara.C01749) is particularly notable. GPPS1 encodes geranyl diphosphate synthase, the rate‐limiting enzyme at the entry point of the monoterpene pathway that produces many key floral volatiles (Wang & Dixon, 2009; Muhlemann et al., 2014). Monoterpenes constitute major components of Brassica floral scent (Knudsen et al., 2006) and play important roles in mediating pollinator attraction (Farré‐Armengol et al., 2020). Even though GPPS1 did not surpass the strict FDR threshold, it consistently appeared among SNPs exceeding relaxed drift thresholds and nominal ER_CMH significance. This pattern is consistent with polygenic, small‐effect responses distributed across biosynthetic pathways rather than concentrated selective sweeps at single, large‐effect loci. The presence of GPPS1 within nominally enriched categories therefore provides mechanistic support for the phenotypic changes observed, indicating that warming and pollinator behaviour may shift selection towards the regulation and allocation of floral scent production, even when genome‐wide drift noise limits the detectability of individual loci. These connections illustrate how phenotype‐linked pathways can leave subtle genomic footprints under realistic ecological and demographic conditions.
In the hot‐generalised treatment, nominal enrichment of stress‐ and temperature‐response processes, together with signatures linked to translational capacity, suggests that plants under combined mutualistic and antagonistic pressure may rely on broad stress‐response pathways rather than specialised floral signalling modules. Butterfly‐pollinated populations showed the weakest enrichment, restricted to redox and cellular homeostasis, consistent with our finding that phenotypic shifts in this treatment likely arise through plasticity or regulatory changes that do not generate strong allele‐frequency divergence.
Taken together, these patterns indicate that rapid adaptation in this system acts primarily on small sets of regulatory and metabolic genes rather than broad genomic regions. The functional signatures are ecologically consistent: bumblebee‐mediated selection under benign thermal conditions favours hormonal and developmental regulators, while elevated temperature and community complexity shift selection towards stress physiology and resource allocation processes. Although the limited number of selected loci constrains functional inference, the overlap between candidate genes and biologically meaningful pathways provides a tractable foundation for future mechanistic work, including gene expression profiling, fine‐mapping, and functional assays.
Broader implications for plant adaptation under environmental change
Our findings emphasise that predicting plant adaptation under climate change requires considering not only abiotic stress but also the ecological context in which reproduction occurs. Pollinator identity, pollinator behaviour, and temperature interact in nonadditive ways that shape both the strength and detectability of selection. Demography emerges as a central determinant of whether adaptive responses are captured at the genomic level, suggesting that population size fluctuations in natural systems may profoundly influence evolutionary trajectories. By integrating ecological observations, genomic analyses, and theoretical expectations, our study provides a mechanistic framework for understanding how rapid adaptation unfolds in complex environments. More broadly, these results highlight the importance of factorial and ecologically realistic experiments for forecasting evolutionary outcomes in a changing world.
Competing interests
None declared.
Author contributions
YD and FPS designed the research. YD performed the DNA extraction, statistical analysis, and wrote the manuscript. YD and FPS reviewed and edited the manuscript.
Disclaimer
The New Phytologist Foundation remains neutral with regard to jurisdictional claims in maps and in any institutional affiliations.
Supporting information
Table S1 Realised effective population sizes (N e) across generations and final pool‐sequencing sample sizes for all experimental populations. Table S2 Drift‐based and empirical thresholds for allele‐frequency change and F ST. Table S3 Classification of SNPs by adaptive category based on final drift–control baseline thresholds. Table S4 Candidate genes located within high‐confidence selection intervals. Table S5 Gene Ontology biological process enrichment across treatments.Please note: Wiley is not responsible for the content or functionality of any Supporting Information supplied by the authors. Any queries (other than missing material) should be directed to the New Phytologist Central Office.
The reference list from the paper itself. Each links out to its DOI / PubMed record.
- 1Alcantud R , Weiss J , Terry MI , Bernabé N , Verdú‐Navarro F , Fernández‐Breis JT , Egea‐Cortines M . 2023. Flower transcriptional response to long term hot and cold environments in Antirrhinum majus . Frontiers in Plant Science 14: 1120183.36778675 10.3389/fpls.2023.1120183 PMC 9911551 · doi ↗ · pubmed ↗
- 2Anderson JT , Mitchell‐Olds T . 2011. Ecological genetics and genomics of plant defences: Evidence and approaches. Functional Ecology 25: 312–324.21532968 10.1111/j.1365-2435.2010.01785.x PMC 3082142 · doi ↗ · pubmed ↗
- 3Ashman TL , Knight TM , Steets JA , Amarasekare P , Burd M , Campbell DR , Dudash MR , Johnston MO , Mazer SJ , Mitchell RJ et al. 2004. Pollen limitation of plant reproduction: Ecological and evolutionary causes and consequences. Ecology 85: 2408–2421.
- 4Barghi N , Tobler R , Nolte V , Jakšić AM , Mallard F , Otte KA , Dolezal M , Taus T , Kofler R , Schlötterer C . 2019. Genetic redundancy fuels polygenic adaptation in Drosophila . P Lo S Biology 17: e 3000128.30716062 10.1371/journal.pbio.3000128 PMC 6375663 · doi ↗ · pubmed ↗
- 5Barrett RD , Schluter D . 2008. Adaptation from standing genetic variation. Trends in Ecology & Evolution 23: 38–44.18006185 10.1016/j.tree.2007.09.008 · doi ↗ · pubmed ↗
- 6Bhatia G , Patterson N , Sankararaman S , Price AL . 2013. Estimating and interpreting FST: the impact of rare variants. Genome Research 23: 1514–1521.23861382 10.1101/gr.154831.113PMC 3759727 · doi ↗ · pubmed ↗
- 7Bishop J , Jones HE , O Sullivan DM , Potts SG . 2017. Elevated temperature drives a shift from selfing to outcrossing in the insect‐pollinated legume, faba bean (Vicia faba). Journal of Experimental Botany 68: 2055–2063.27927999 10.1093/jxb/erw 430PMC 5429019 · doi ↗ · pubmed ↗
- 8Bradshaw HD , Schemske DW . 2003. Allele substitution at a flower colour locus produces a pollinator shift in monkeyflowers. Nature 426: 176–178.14614505 10.1038/nature 02106 · doi ↗ · pubmed ↗