An approximate-copula distribution for statistical modeling
Sarah S. Ji, Benjamin B. Chu, Hua Zhou, Kenneth Lange, Michael Sohn, Michael Sohn, Michael Sohn, Michael Sohn, Michael Sohn, Michael Sohn, Michael Sohn

TL;DR
This paper introduces a new probability distribution model for efficiently analyzing complex datasets with mixed types of correlated responses.
Contribution
A new class of approximate-copula distributions is introduced for efficient statistical modeling of mixed-type correlated data.
Findings
The new distribution allows explicit calculation of moments and distributions needed for maximum likelihood estimation.
The model is applied to GWAS data with continuous, binary, and count responses, showing flexibility and scalability.
The approximate-copula model is shown to be computationally efficient in high-dimensional settings.
Abstract
Copulas, generalized estimating equations, and generalized linear mixed models promote the analysis of grouped data where non-normal responses are correlated. Unfortunately, parameter estimation remains challenging in these three frameworks. Based on prior work of Tonda, we derive a new class of probability density functions that allow explicit calculation of moments, marginal and conditional distributions, and the score and observed information needed in maximum likelihood estimation. We also illustrate how the new distribution flexibly models longitudinal data following a non-Gaussian distribution. Finally, we conduct a tri-variate genome-wide association analysis on dichotomized systolic and diastolic blood pressure and body mass index data from the UK-Biobank, showcasing the modeling potential and computational scalability of the new distributional family. Modeling correlated…
Genes, proteins, chemicals, diseases, species, mutations and cell lines named across the full text — each resolved to its canonical identifier and authoritative record.
Click any figure to enlarge with its caption.
 Figure 1
 Figure 2
 Figure 3
 Figure 4
 Figure 5
 Figure 6
 Figure 7
 Figure 8
 Figure 9
 Figure 10
 Figure 11
 Figure 12
 Figure 13
 Figure 14
 Figure 15
 Figure 16
 Figure 17
 Figure 18
 Figure 19
 Figure 20
 Figure 21
 Figure 22
 Figure 23
 Figure 24
 Figure 25
 Figure 26
 Figure 27
 Figure 28
 Figure 29
 Figure 30
 Figure 31
 Figure 32
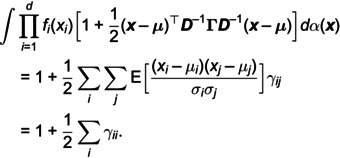 Figure 33
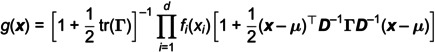 Figure 34
 Figure 35
 Figure 36
 Figure 37
 Figure 38
 Figure 39
 Figure 40
 Figure 41
 Figure 42
 Figure 43
 Figure 44
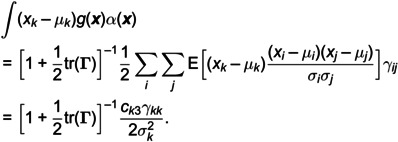 Figure 45
 Figure 46
 Figure 47
 Figure 48
 Figure 49
 Figure 50
Peer Reviews
No public reviews on file for this paper yet. If you reviewed it on a platform where reviews are public (OpenReview, ICLR, NeurIPS, ICML), you can paste yours below so the community can read it here.
Videos
No videos yet. Explain this paper in a talk, walkthrough, or lecture? Add one.
Taxonomy
TopicsStatistical Methods and Inference · Genetic Associations and Epidemiology · Statistical Methods and Bayesian Inference