Application of seasonal-adjusted hybrid models for forecasting Discomfort Index in a heat-prone region of Bangladesh
Amrin Binte Ahmed, Md. Mahin Uddin Qureshi, Mohammad Mahboob Hussain Khan, Adisha Dulmini, Mohammad Ashraful Haque Mollah, Rumana Rois, Dost Muhammad Khan, Anurag Barthwal, Anurag Barthwal

TL;DR
This study uses hybrid machine learning models to forecast thermal discomfort in Rajshahi, Bangladesh, showing rising heat stress and the need for climate adaptation.
Contribution
The novel use of STL-adjusted hybrid models combining traditional and machine learning methods for forecasting thermal discomfort in a heat-prone region.
Findings
The STL-TBATS-LSTM hybrid model outperformed others in forecasting thermal discomfort with low MAE and RMSE values.
Discomfort peaks from June to August, with increasing frequency and intensity of high-discomfort days from 1985 to 2024.
Forecasts predict 39.8% of days in 2025–2027 will be 'High Discomfort' and 1.2% 'Severe Discomfort'.
Abstract
Extreme heat and humidity pose an increasing threat to human health, labor productivity, and overall well-being, particularly in heat-vulnerable and rapidly urbanizing regions such as Rajshahi, Bangladesh. As rising temperatures and elevated humidity levels intensify exposure to heat stress, accurate forecasting has become essential for effective early warning systems and climate-resilient urban planning. However, modeling thermal discomfort is challenging due to the need to analyze long-term, high-frequency meteorological time series data with complex seasonal and nonlinear structures. Therefore, this study applies and evaluates seasonal-adjusted, machine-learning-based hybrid models to forecast thermal discomfort using 40 years (1985–2024) of daily temperature and humidity data. The Thom’s Discomfort Index (DI), a standard measure of thermal stress, was calculated and decomposed using…
Genes, proteins, chemicals, diseases, species, mutations and cell lines named across the full text — each resolved to its canonical identifier and authoritative record.
Click any figure to enlarge with its caption.
 Figure 1
 Figure 2
 Figure 3
 Figure 4
 Figure 5
 Figure 6
 Figure 7
 Figure 8
 Figure 9
 Figure 10
 Figure 11
 Figure 12
 Figure 13
 Figure 14
 Figure 15
 Figure 16
 Figure 17
 Figure 18
 Figure 19
 Figure 20
 Figure 21
 Figure 22
 Figure 23
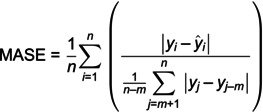 Figure 24
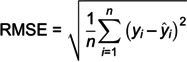 Figure 25
 Figure 26
 Figure 27
 Figure 28
 Figure 29
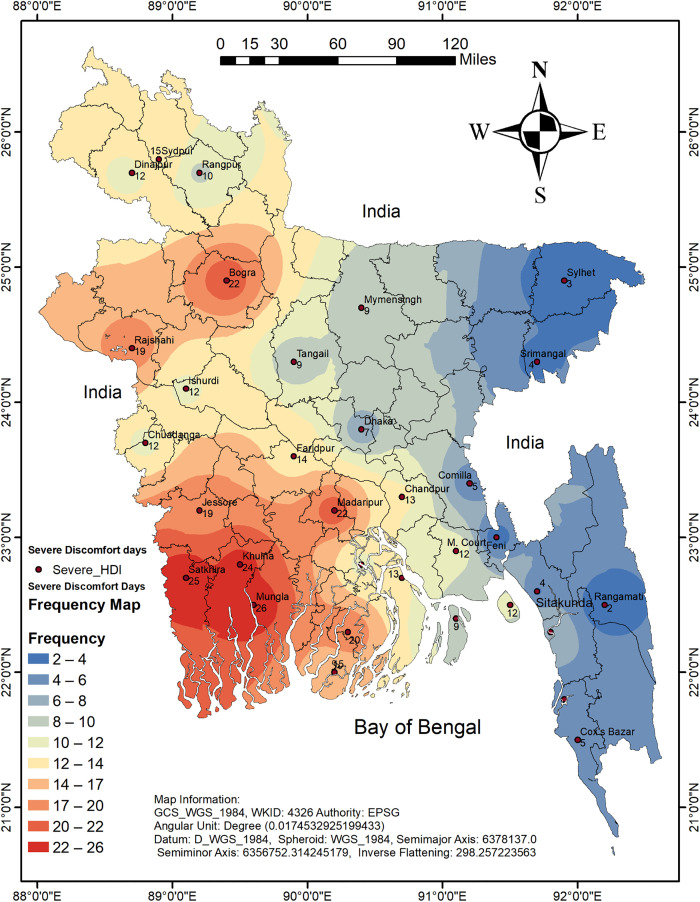 Figure 30
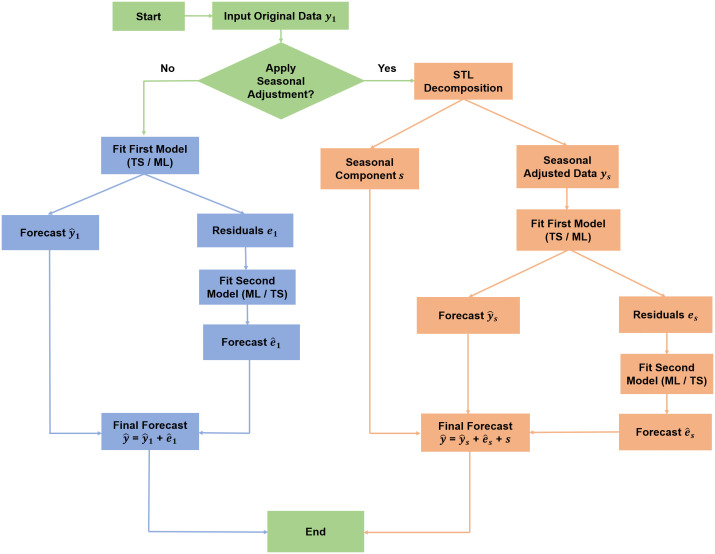 Figure 31
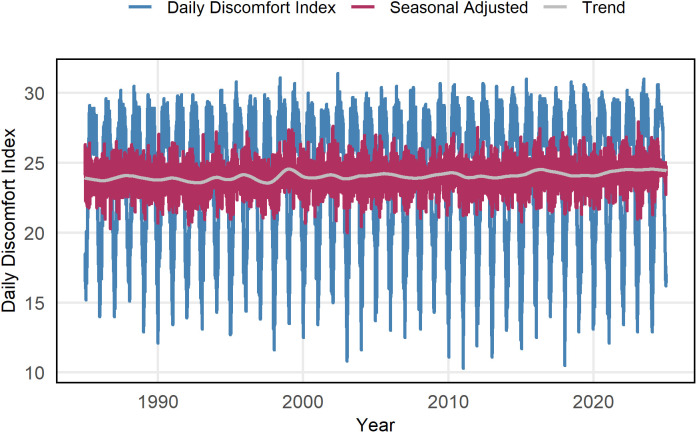 Figure 32
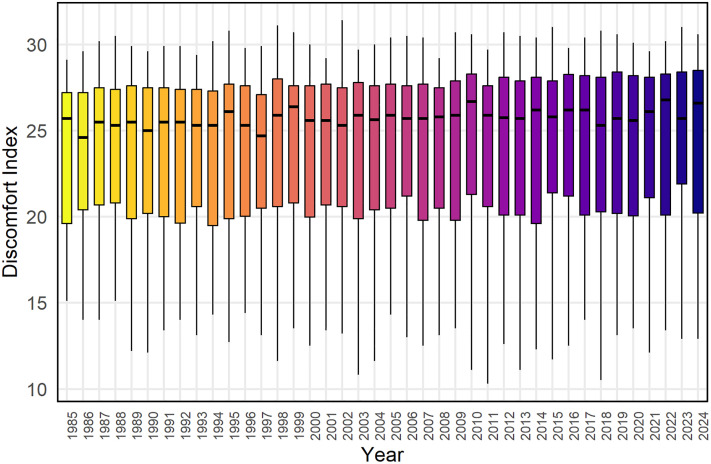 Figure 33
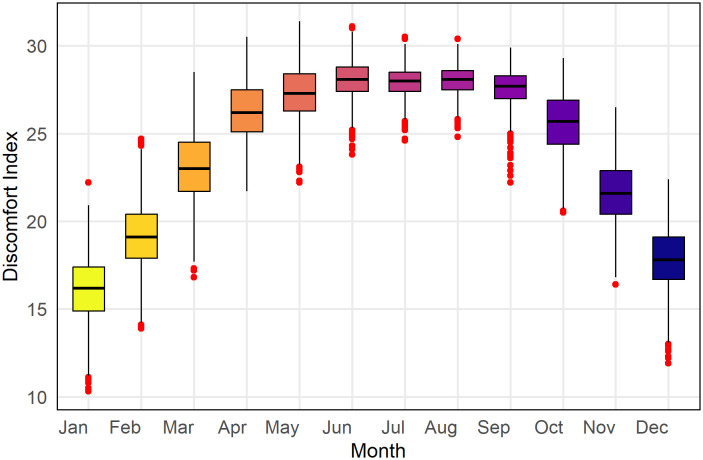 Figure 34
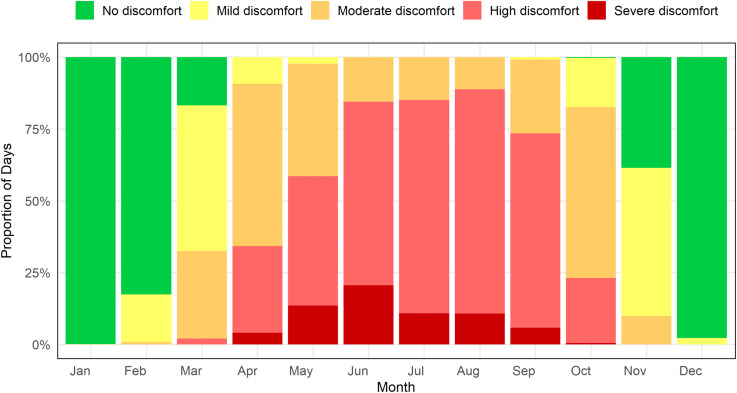 Figure 35
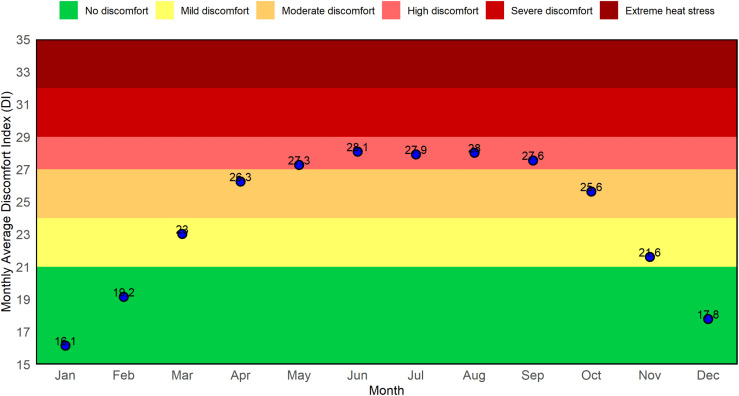 Figure 36
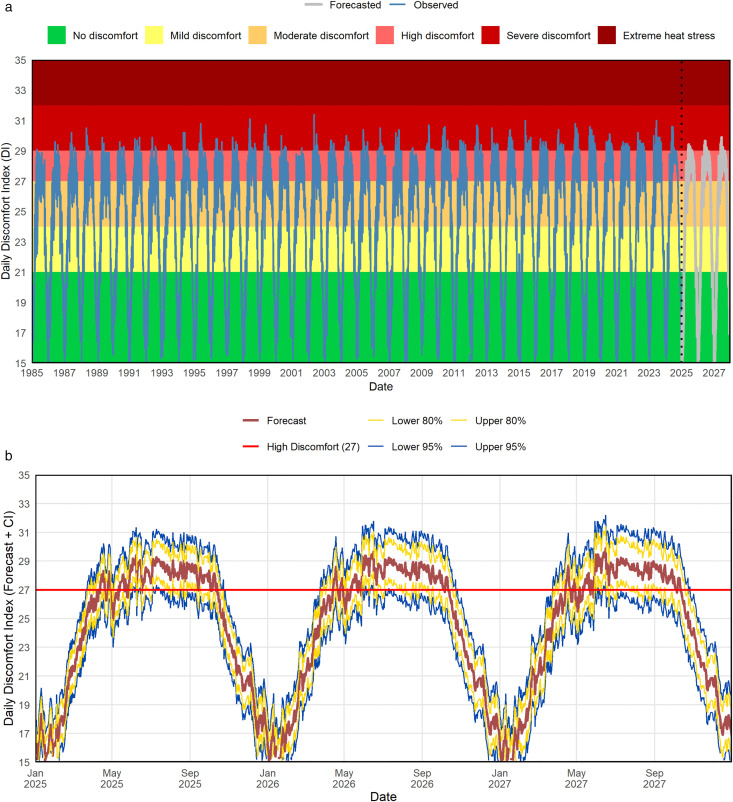 Figure 37
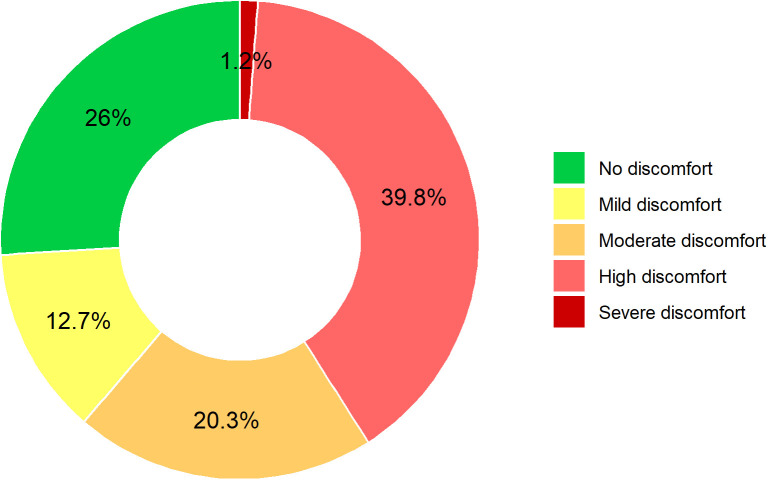 Figure 38
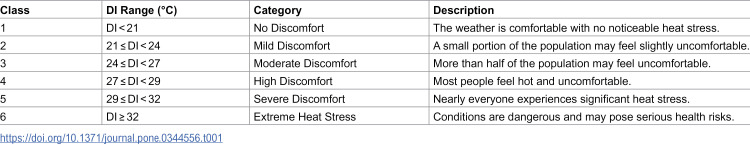 Figure 39
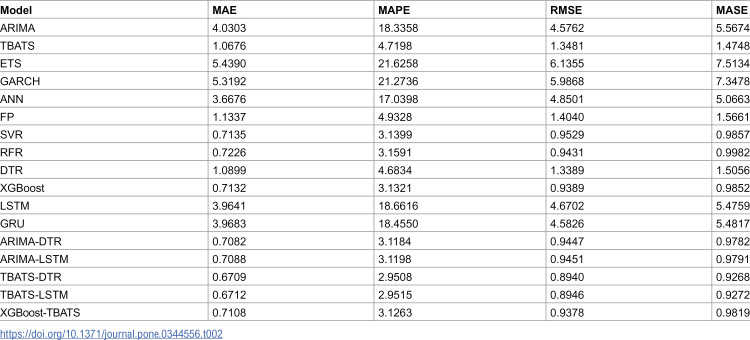 Figure 40
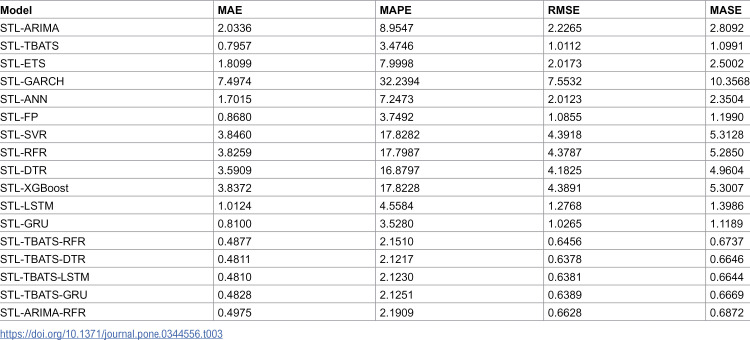 Figure 41
Peer Reviews
No public reviews on file for this paper yet. If you reviewed it on a platform where reviews are public (OpenReview, ICLR, NeurIPS, ICML), you can paste yours below so the community can read it here.
Videos
No videos yet. Explain this paper in a talk, walkthrough, or lecture? Add one.
Taxonomy
TopicsUrban Heat Island Mitigation · Climate Change and Health Impacts · Meteorological Phenomena and Simulations