Spatiotemporal distribution and diversity of pathogenic Vibrio species in estuarine recreational waters of southeast Louisiana
Annika Nelson, Fernanda Mac-Allister Cedraz, Katie Vigil, Joshua Alarcon, Tiong Gim Aw

TL;DR
This study examines the presence and diversity of harmful Vibrio bacteria in Lake Pontchartrain, finding higher concentrations in summer and identifying multiple pathogenic species.
Contribution
The study provides the first detailed spatiotemporal analysis of multiple pathogenic Vibrio species in Lake Pontchartrain using culture and molecular methods.
Findings
Vibrio concentrations were significantly higher in summer (5.2 × 10⁴ CFU/L) compared to winter (3.2 × 10³ CFU/L).
Water temperature and salinity were significant predictors of Vibrio abundance.
41 Vibrio species were identified, with V. cholerae, V. vulnificus, and V. mimicus being most prevalent.
Abstract
Although several studies have reported the occurrence of Vibrio species in the Gulf Coast of the United States (U.S.), relatively little is known about the distribution of multiple pathogenic Vibrio species in Lake Pontchartrain in Louisiana, the second largest estuary in the U.S. In this study, bacterial culture, quantitative PCR (qPCR), and long-read sequencing methods were used to assess the prevalence, distribution, and diversity of Vibrio species in this recreational estuary. Water samples (n = 101) were collected from nine sites over 12 months from November 2023 to November 2024. During the summer months (June, July, and August), the average Vibrio species concentration was 5.2 × 10⁴ CFU/L. While in the winter months (December, January, and February), the average Vibrio concentration was 3.2 × 10³ CFU/L. Likewise, the temperature differed between summer and winter, with the…
Genes, proteins, chemicals, diseases, species, mutations and cell lines named across the full text — each resolved to its canonical identifier and authoritative record.
Click any figure to enlarge with its caption.
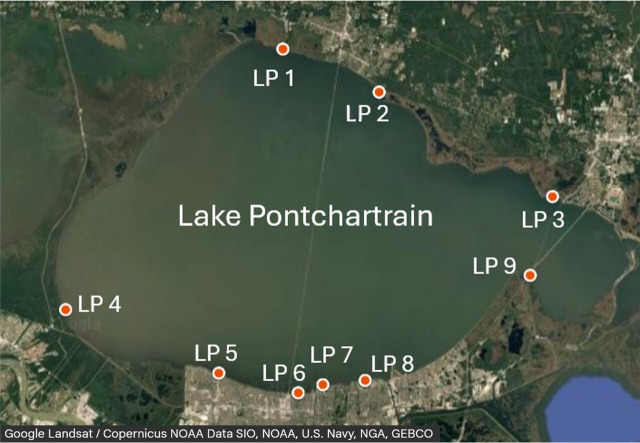 Fig 1
Fig 1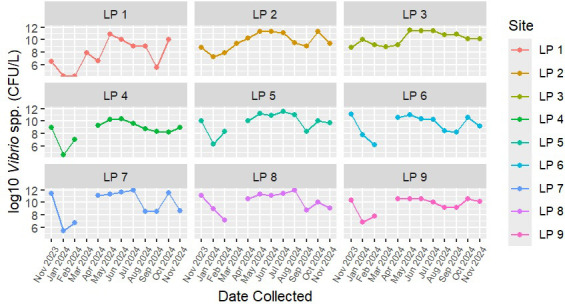 Fig 2
Fig 2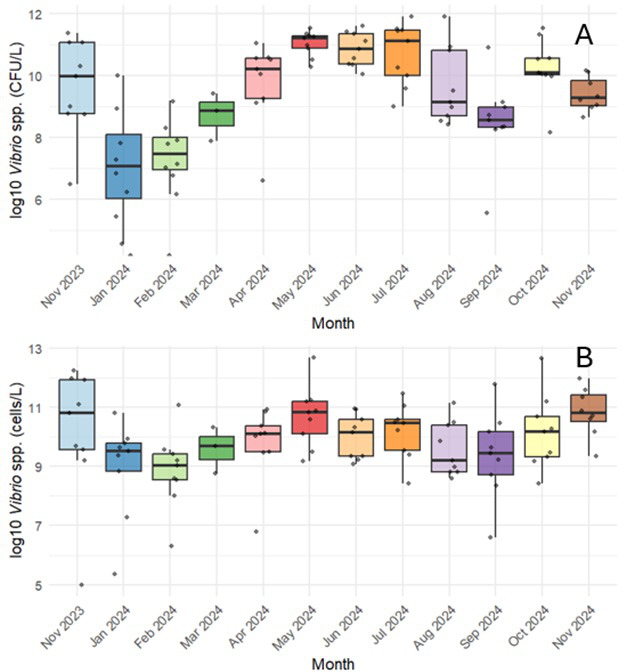 Fig 3
Fig 3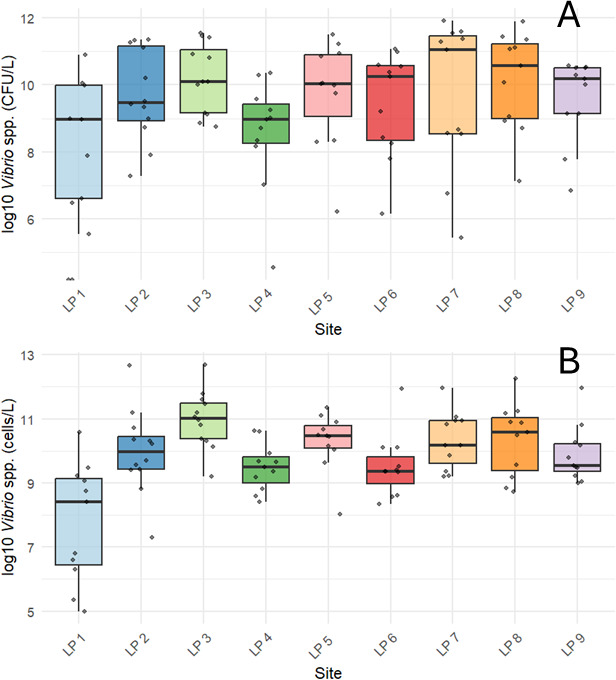 Fig 4
Fig 4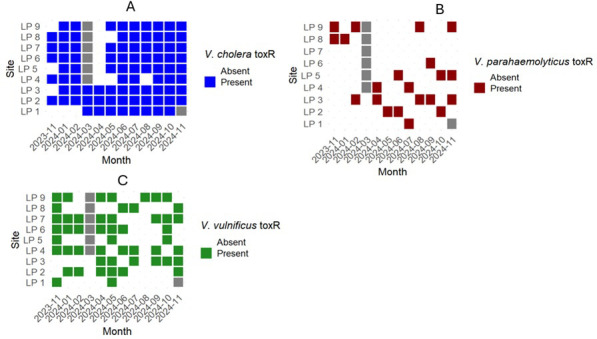 Fig 5
Fig 5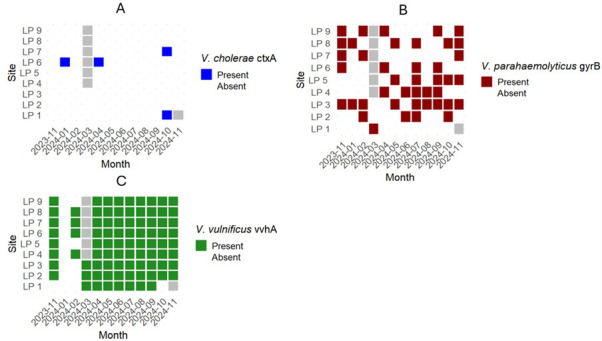 Fig 6
Fig 6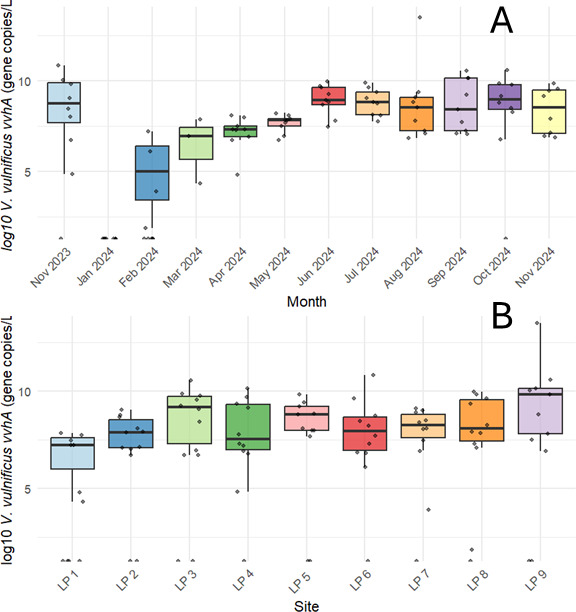 Fig 7
Fig 7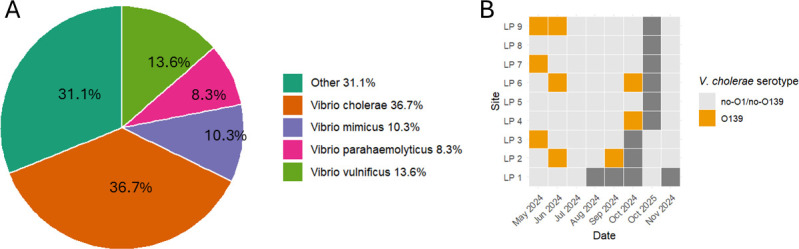 Fig 8
Fig 8| Parameter | Minimum | Maximum | Median |
|---|---|---|---|
| Temperature (°C) | 8.27 | 32.37 | 23.14 |
| Salinity (PSU) | 0.08 | 10.01 | 2.21 |
| Dissolved oxygen (% saturation) | 51.70 | 111.00 | 87.90 |
| 7-Day precipitation (in) | 0.00 | 8.47 | 0.50 |
| Total dissolved solids (mg/L) | 18 | 8484 | 1961.5 |
| <1 | 1732.90 | 24.30 | |
| Enterococci (MPN/100 mL) | 2 | >2419.6 | 79.80 |
| Environmental parameter | Model adjusted | ||
|---|---|---|---|
| Salinity (psu) | 0.005463 | 0.3914 | |
| Temperature (°C) | 5.791 × 10⁻⁹ | ||
| 7-day precipitation (in.) | 0.006542 | ||
| Dissolved oxygen (%) | 0.4570 | ||
| Total dissolved solids (ppm) | 0.5755 | ||
| pH | 0.5946 | ||
| Salinity (psu) | 0.0330 | 0.1401 | |
| Temperature (°C) | 0.02439 | ||
| 7-day precipitation (in.) | 0.7772 | ||
| Dissolved oxygen (%) | 0.7320 | ||
| Total dissolved solids (ppm) | 0.7727 | ||
| pH | 0.8208 |
- —Louisiana Sea Grant, Louisiana State Universityhttp://dx.doi.org/10.13039/100005792
Peer Reviews
No public reviews on file for this paper yet. If you reviewed it on a platform where reviews are public (OpenReview, ICLR, NeurIPS, ICML), you can paste yours below so the community can read it here.
Videos
No videos yet. Explain this paper in a talk, walkthrough, or lecture? Add one.
Taxonomy
TopicsVibrio bacteria research studies · Aquaculture disease management and microbiota · Marine Invertebrate Physiology and Ecology
INTRODUCTION
Of the many species of Vibrio that inhabit water systems around the world, 12 are pathogenic to humans (1). Vibrio species (spp.) that are most commonly associated with human gastrointestinal illness include the three species of concern, V. cholerae, V. vulnificus, and V. parahaemolyticus (2, 3). Vibrio cholerae, specifically in the O1 or O139 serotypes, produces a toxin that causes secretion of water and electrolytes from cells, resulting in potentially-deadly, watery diarrhea (4). These bacteria have been identified as the causative agent of seven pandemics, with one persisting from the 1960s to the present (5). Cases of non-cholera Vibrio spp. (e.g., V. parahaemolyticus, V. alginolyticus, and V. vulnificus) infections are classified as vibriosis, but different species can cause different symptoms or severity of infection (1). V. vulnificus, the leading cause of seafood-associated fatality in the United States (U.S.), has an 80% rate of hospitalization and a case-fatality ratio greater than 30% due to its ability to cause skin necrosis and septicemia (6, 7). From the period of 1996 to 2010, V. parahaemolyticus was the most commonly reported Vibrio spp. infection in the U.S., but it had a case-fatality ratio of less than 1% with most patients experiencing gastrointestinal illness (7). The infectious doses of these bacteria in a healthy host can range from less than 100 cells for V. vulnificus to 1,000 cells for V. parahaemolyticus, but it is important to note that these are opportunistic pathogens that often cause severe infections in immunocompromised individuals (1, 8).
Vibrio spp. are found in a wide range of aquatic environments, from freshwater to marine water (9). These bacteria are known to grow best in slightly salty waters (10–25 parts per thousand or ppt), but due to the diversity of the genus, Vibrio have been found to grow in a wide range of salinities (1–35 ppt) (10, 11). Vibrio cholerae grows optimally in water with lower salinity, from 2 to 8 ppt, V. vulnificus can grow in water with salinity between 5 and 25 ppt, and V. parahaemolyticus prefers water salinity of 25 ppt (11–13). Studies have shown a significant association between temperature and Vibrio spp. growth (9, 14, 15). Warm bodies of water (>15°C) are suitable for Vibrio growth, with the three species of concern reaching ideal growth levels between 25°C and 40°C (16, 17). Due to the impact of temperature on Vibrio growth, most infections are detected in the summer or fall months, when sea surface temperatures are the highest (17). However, these bacteria can persist in water even in months when the temperatures drop. Vibrio spp. can enter a viable but non-culturable (VBNC) state in response to stressful conditions such as temperature fluctuations and other environmental factors (18, 19). Unlike dead cells, VBNC cells maintain low but detectable metabolic activity (18). This state enables Vibrio spp. to persist during colder months, and when conditions become favorable, they can resuscitate, regaining normal metabolic function, culturability, and virulence (18).
Because of the strong correlation between warm temperatures and Vibrio growth, climate change has altered both the spatial and temporal range of the species. Global sea surface temperature has increased by 0.6°C in the past 40 years, and it has been shown that enclosed bodies of water experience a higher rate of warming than the open ocean (17, 20, 21). Within the next century, models have shown Vibrio spp. increasing its range by over 30,000 km, and the amount of time suitable for Vibrio growth rising by more than a month (21). Climate change has also been associated with an increase in heat waves and severe weather events like hurricanes, which are both associated with cases of vibriosis. Cases of vibriosis were associated with floodwaters from Hurricane Katrina and Hurricane Ian, both of which impacted the Gulf of Mexico region of the U.S (17).
The Centers for Disease Control and Prevention (CDC) estimates that there are 80,000 cases of vibriosis in the U.S. each year, but many of these go unreported or misdiagnosed (20). In 2019, there were 2,685 confirmed, non-cholera vibriosis cases and 11 cholera cases in the U.S. Of these, there were 159 cases caused by V. vulnificus, with 52% of those cases being attributed to Gulf Coast states, including 12 cases in Louisiana (22). From January to September 2025, there were 26 reported cases of V. vulnificus in Louisiana, and five deaths from the bacteria. Of those reported cases, 85% of patients reported wound or seawater exposure (23). These case numbers highlight the risk of Vibrio exposure in Louisiana’s coastal waters.
Lake Pontchartrain is an estuarine embayment that borders the northern side of the city of New Orleans and opens into the Gulf of Mexico via Lake Borgne to the east. It is a popular site for swimming, boating, fishing, and other recreational activities. Previous studies in the Gulf of Mexico showed that Vibrios were present in surface waters with fluctuating concentrations based on environmental conditions (24–26). The only study of Vibrio in southern Lake Pontchartrain after two significant hurricanes in 2005 and 2006 showed a positive correlation of Vibrio concentrations with temperature and turbidity (26). Furthermore, in the 20 years since Vibrio spp. were last investigated in Lake Pontchartrain, intense storms and climate fluctuations have affected water systems around the world, and it is important to monitor the changing behavior of these pathogens (15). Therefore, the objectives of this study were to (i) use bacterial culture methods and quantitative PCR (qPCR) to identify the presence of Vibrio spp. of public health concern in a recreational estuary; (ii) determine the correlations between environmental variables (temperature, salinity, dissolved oxygen (DO), fecal indicator bacteria [FBI]) and spatiotemporal distribution of Vibrio spp.; and (iii) use a long-read nanopore sequencing method to identify a wide range of Vibrio beyond those of concern as well as more virulence markers, including genes specific to V. cholerae O139 strains. This is the first study to use multiple methods (bacterial culture, quantitative PCR, and long-read nanopore sequencing) to characterize environmental Vibrio communities in Lake Pontchartrain (26). It is increasingly important to monitor these pathogens in estuaries like Lake Pontchartrain, bear the effects of warming global temperatures and high incidence of Vibrio infections in Louisiana lead to public health concerns (21, 23).
MATERIALS AND METHODS
Site description
Lake Pontchartrain is a brackish estuarine embayment located in southeast Louisiana (Fig. 1; Tables S1). It is the second largest inland estuary in the U.S., covering an area of 630 square miles (1,631 square km). The lake is an important resource, supporting agricultural and aquacultural activities, fishing tourism, and recreation (27). Water samples were collected at nine recreational sites from November 2023 to November 2024. Over the course of the study, 101 surface water samples were collected.
Map showing sampling sites along the shore of Lake Pontchartrain (LP). The LP 1–LP 3 are sites located on the north shore of the lake, and LP 4–LP 9 are the south shore sites.
Sample collection and water quality parameter measurements
During the study period, each site was sampled once a month. Two sampling trips were conducted each month, each trip collecting samples from the north shore of the lake (LP 1–LP 3) and south shore of the lake (LP 4–LP 9). Exceptions included December 2023, when no samples were collected, March 2024, when south shore samples were not collected, and November 2024, when LP 1 was not collected due to flooding (Fig. S1). At the time of sample collection, a multiparameter weatherproof meter (HANNA Instruments, Smithfield, RI) was used to measure pH, DO, salinity, and total dissolved solids (TDSs). Precipitation data were obtained from the United States Geological Survey National Water Information System at station #302415090091500 in Madisonville, Louisiana, U.S. Reported precipitation in inches (in) for the sampling date and 6 days prior were summed to provide a 7-day precipitation measurement. A 1-L grab sample of water was collected from each site using a sterile bottle (Thermo Fisher Scientific, Waltham, MA). Water samples were stored in a cooler with ice packs during transport to the lab, where they were held at 4°C until processing (<48 h). Upon return to the lab, enzyme-based methods were used to assess the presence of FIB. Briefly, the Colilert-18 reagent (IDEXX Laboratories, Westbrook, ME) was added to 100 mL of the sample in a sterile sample vessel and mixed well to dissolve. The mixture was poured into an IDEXX Quanti-tray 2000 and incubated for 18–22 h at 35°C (±0.5°C). Following incubation, wells showing yellow coloration (total coliforms) and fluorescence under 365 nm UV light (Escherichia coli) were counted and interpreted using the IDEXX Most Probable Number (MPN) table, with results reported as MPN/100mL in accordance with the manufacturer’s instructions. Similarly, for enumerating enterococci, 100 mL of sample was mixed with the Enterolert reagent in a sterile sample vessel (IDEXX Laboratories, Westbrook, ME), and incubated for 24–28 h at 41°C (±0.5°C). After incubation, positive wells for enterococci (fluorescent under 365 nm UV light) were counted and interpreted using the IDEXX MPN table, with results reported as MPN/100 mL in accordance with the manufacturer’s instructions.
Enumeration of Vibrio spp. using culture-based assay
Within 48 h of collection, water samples were filtered for use in a bacterial culture-based assay. Water samples were diluted with 1× sterile phosphate-buffered saline (PBS) to get the sample plates within the countable range. For each sample, a 1:10 (vol/vol) and 1:50 (vol/vol) 1× PBS dilution was made to get a total volume of 100 mL for filtration. Both dilutions and 100 mL of the undiluted sample were filtered in duplicate on 0.47 mm diameter mixed cellulose ester gridded filters with 0.45 μm pore size (Pall Corporation, Port Washington, NY). For each filtration, a negative control using 100 mL of sterile 1× PBS was included. Filters were placed on thiosulfate-citrate-bile salts-sucrose (TCBS; Cat. No. 265020, BD Difco) agar and incubated at 37°C for 18–24 h. After incubation, the colonies were counted. The countable range was <200 colonies per plate, and the duplicate plates were averaged. The concentration of Vibrio spp. in the sample measured in colony-forming units per liter (CFU/L) was calculated by multiplying the number of colonies times the dilution factor and dividing by the volume filtered.
TCBS agar is traditionally employed for the enumeration of Vibrio spp. due to its selective properties and ability to differentiate sucrose-fermenting from non–sucrose-fermenting strains. Studies have demonstrated that this medium can also support the growth of non-Vibrio colonies, and culture on this medium does not account for Vibrio cells in a VBNC state (28–30). For this reason, samples within this study were also quantified using qPCR using the 16S rRNA gene, which is highly conserved within the genus, allowing for a higher level of specificity and for quantification of VBNC bacteria (31, 32).
Confirmation of Vibrio species using polymerase chain reaction
The TCBS agar differentiates Vibrio spp. by sucrose fermentation and hydrogen sulfide production, resulting in distinct colony colors and morphologies. V. cholerae formed large yellow colonies, and V. vulnificus formed yellow-green colonies, whereas V. parahaemolyticus produced blue to green colonies. Therefore, yellow and green colonies from TCBS plates were extracted separately. Qualitative PCR assays were performed on five colonies of each color per sampling site to confirm the presence of Vibrio spp. PCR primers targeting the toxR gene of each species, which encodes a protein that regulates the expression of virulence and survival factors, including cholera toxin, outer membrane proteins, and bile resistance (33), were used (Table S2).
For DNA extraction, colonies of the same color (yellow or green) were harvested from a plate and resuspended in 100 μL of nuclease-free water in a 2 mL microcentrifuge tube. The tubes were vortexed for 5 s and then heated to 95°C in a heat block for 5 min. After heating, the tubes were centrifuged for 2 min at 12,000 rpm. The supernatant was placed in a labeled 1.5 mL microcentrifuge tube and stored at −80°C until PCR.
Positive controls for PCR were generated from the American Type Culture Collection (ATCC; Manassas, VA) stock bacteria. For the V. cholerae (ATCC #14033) and V. parahaemolyticus (ATCC # 43996) cultures, 1 mL glycerol stock was placed in 9 mL Difco Nutrient Broth (VWR, Radnor, PA) in a loosely capped 15 mL tube and incubated at 37°C for 24 h. For the V. vulnificus (ATCC #27562) cultures, 1 mL glycerol stock was placed in 9 mL Difco Marine Broth (VWR, Radnor, PA) in a loosely capped 15 mL tube and incubated at 37°C for 24 h. After incubation, 1 mL of broth was pelleted down via centrifugation for 1 min at 13,000 rpm. The supernatant was removed, and the pellet was resuspended in 100 mL nuclease-free water. The heat extraction method described above was used, and the DNA was stored at −80°C until PCR.
A 25 µL reaction was assembled using 12.5 µL AccuStart II PCR Supermix (Quantabio, Beverly, MA), 4 µL of forward primer (10 µM), 4 µL of reverse primer (10 µM), 2.5 mL of nuclease-free water, and 2 µL DNA template. For the non-template control, 2 µL of nuclease-free water was used instead of extracted DNA. Thermocycling conditions can be found in Table S3. Thermocycling was completed on a MyCycler Thermal Cycler (Bio-Rad Laboratories, Hercules, CA). PCR products were visualized on a 1.5% agarose gel with a SYBR Safe DNA Gel Stain (Thermo Fisher Scientific, Waltham, MA). 10 µL of PCR product was loaded with 2 µL 6× Purple Gel Loading Dye (New England BioLabs, Ipswich, MA). A 100 bp DNA ladder (Promega, Madison, WI) was loaded in the same manner and used as a standard to estimate amplicon sizes.
Enumeration of Vibrio spp. using qPCR
An undiluted water sample (100 mL) was filtered through 0.4 μm pore size, 0.47 mm diameter polycarbonate filters (MilliporeSigma, Burlington, MA) for use in qPCR. DNA extraction was performed using the DNeasy PowerLyzer PowerSoil kit (QIAGEN, Hilden, Germany) according to the manufacturer’s instructions. Briefly, bacterial cells collected on the filters were resuspended and homogenized in the Mini-Beadbeater-16 (Biospec Products, Bartlesville, OK) for 45 s. Following this, the sample underwent protein precipitation, inhibitor removal, DNA binding, and wash steps. DNA was eluted in 100 μL of DNase, RNase-free water, and stored at −80°C until the qPCR assay was performed.
A SYBR Green assay with the 16S rRNA gene (Table S1) was used to determine concentrations of Vibrio spp. in water samples. Each 25 µL reaction consisted of 10 µL of 2 × Applied Biosystem PowerUp SYBR Green Master Mix (Thermo Fisher Scientific, Waltham, MA), 1 μL of 10 µM forward primer, 1 μL of 30 µM reverse primer, 4 μL of nuclease-free water, and 4 μL of sample or standard DNA. Thermocycling conditions are in Table S2. Thermocycling and data collection were completed on the QuantStudio 3 Real-Time PCR System (Thermo Fisher Scientific, Waltham, MA). To develop standard curves for qPCR, a gBlock gene fragment (Integrated DNA Technologies, Coralville, IA) was designed to cover the 16S rRNA region of Photobacterium angustum. The gBlock was diluted 10-fold using nuclease-free water with concentrations ranging from 10^7^ to 10 gene copies/5µL. Additionally, each plate included non-template controls. All samples and standards were run in triplicate on a 0.2 mL, 96-well plate. The efficiency percentage and r^2^ values were computed for each standard curve, with acceptable values between 90% and 110% for efficiency and ≥0.980 for r^2^. In this study, qPCR efficiency ranged from 93.3% to 95.9%, and r^2^ ranged from 0.996 to 1. Since Vibrio spp. contain between 9 and 14 copies of the 16S rRNA gene per cell, the number of presumed cells in each sample was calculated by dividing the gene copy number by 9.1. This number, 9.1, is the average number of 16S rRNA gene copies across Vibrio species (25).
qPCR was also used to quantify the Vibrio spp. of concern (V. cholerae, V. vulnificus, and V. parahaemolyticus) using primers, probes, and gblocks as listed in Table S2. For specific Vibrio spp. qPCR assays, 20 mL reactions consisted of 10 mL 2× PerfeCTa qPCR Toughmix Low ROX (Quantabio, Beverly, MA), 1 mL of 10 µM forward primer, 1 mL of 10 µM reverse primer, and 0.2 mL of 10 µM probe, 3.8 mL of nuclease-free water, and 4 mL of extracted DNA sample or standard DNA. Thermocycling conditions differed for each of the three species (Table S2). Thermocycling and data collection were completed on the QuantStudio 3 Real-Time PCR System (Thermo Fisher Scientific, Waltham, MA). All samples and standards were run in triplicate on a 0.2 mL, 96-well plate.
The detection rate for qPCR and PCR samples was calculated as follows:
Genomic sequencing for culturable Vibrio spp. and bioinformatics
To determine the diversity of Vibrio spp. isolated from the estuary, bacterial colonies were harvested from TCBS Agar plates by using 1 mL of Luria-Bertani (LB) Broth (Thermo Fisher Scientific, Waltham, MA) and a sterile L-shaped loop to dislodge colonies from the filter. Broth with suspended colonies was pipetted into a 1.5 mL cryotube, and 150 μL autoclaved glycerol was added to make a 15% glycerol stock. Tubes were vortexed and stored at −80°C. This process was completed in duplicate for each sample site.
For DNA extraction, the preserved cells from each site were pooled in 2 mL tubes and spun down for 5 min at 5,000 rpm. The supernatant was discarded, and the pellet was resuspended in ZymoBIOMICS DNA/RNA Shield solution (Zymo Research, Orange, CA). DNA was extracted according to the ZymoBIOMIC DNA/RNA Miniprep Kit DNA Purification protocol. In this study, 75 μL of the ZymoBIOMICS Microbial Community Standard was also extracted using the same protocol as a positive control.
DNA samples were prepared for sequencing with the Native Barcoding Kit NBD114.24 (Oxford Nanopore Technologies, Oxford, UK). For each sequencing, non-template controls and the ZymoBIOMICS Microbial Community Standard (Zymo Research, Orange, CA) as a positive control were also included. Tapestation electrophoresis (Agilent Technologies, Santa Clara, CA) was used to get the average input fragment length (kb) in the DNA library. This fragment length was used to calculate the volume of the library that contained 50 fmol of DNA to load into a PromethION R10.4.1 Flow Cell (Oxford Nanopore Technologies, Oxford, UK) for nanopore sequencing with the MinKNOW v24.11.10 using the “fast” Dorado Basecaller Setting. Samples were sequenced for up to 72 h, the minimum quality score was set to 8, and a minimum read length was set to 1 kb.
Nanopore-generated FASTQ files were concatenated via the command line and uploaded to the IDseq mNGS Nanopore Metagenomic Pipeline v0.7. The pipeline filtered low-quality reads using fastp, removed host and human sequences with minimap2, subsampled to 1 million reads, assembled contigs using metaFlye, and aligned both contigs and unassembled reads to the NCBI nucleotide and protein databases using Minimap2 and DIAMOND (34–37). Output reports included identified taxa, total bases per taxon, percent identity, alignment length, contig counts per taxon, and average E-value. Positive control samples were reviewed to confirm the detection of organisms present in the microbial community standard. The results from the IDseq pipeline were uploaded to R (Version 2024.120 +467) for data visualization. Sequencing reads that aligned with the V. cholerae genome in the IDseq were also uploaded to Cholerae Finder 1.0 (https://cge.food.dtu.dk/services/CholeraeFinder/) for serotyping. Reported species were screened to have more than 1 kilobase (kb) of aligned reads and a percent identity greater than 95%, which shows high alignment with known sequences in the BLAST database.
Statistical analysis
All statistical analyses were performed using R (Version 2024.120 +467). Data were cleaned using the dplyr and lubridate packages. The graphs were generated using ggplot2. A multiple linear regression model was used to assess the relationship between environmental factors (salinity, temperature, precipitation, DO, TDSs, and pH) and Vibrio spp. concentrations collected via bacterial culture (CFU/L) and qPCR (cells/L). Values for bacterial culture concentration, qPCR concentration, and pH were log-transformed for normality. The equation for the linear regressions was as follows: log (Vibrio concentration) = β0 + β1(Salinity) + β2(Temperature) + β3(Precipitation) + β4(Dissolved Oxygen) + β5(log(pH)) + β6(total dissolved solids) + ϵ. The package “lmtest” was used to make linear models, which were assessed for heteroscedasticity of residuals using the Breusch-Pagan test. Significance of environmental parameters on Vibrio spp. concentration was assessed using a type III ANOVA test where a P-value less than 0.05 was determined to be significant. Pairwise comparisons between enumeration and qPCR data for the months of the study and the study sites were performed using the Wilcoxon signed-rank test for non-normal data and the Bonferroni correction for significance from the package “rstatix.”
RESULTS
Water quality and environmental parameters
Table 1 summarizes key water quality parameters of the estuary measured during the study. Water temperature ranged from 8.27°C to 32.37°C, with seasonal variation. Median water temperature during summer months (June, July, and August) was 30.5°C, whereas during winter months (December, January, and February), median water temperature was 13.35°C (Fig. S2). Salinity ranged from 0.08 PSU to 10.01 PSU, which indicated brackish water. The DO percent saturation of water samples ranged from 51.7% to 111%. These values are based on expected solubility for a given salinity and temperature, but they can exceed 100% because of photosynthetic organisms that produce oxygen that do not immediately diffuse to reach equilibrium with the air. The highest precipitation value for the 7-day period before sample collection was 8.47 inches from Hurricane Francine in September 2024. TDSs ranged from 18 to 8,484 mg/L throughout the course of the study. Of the samples that were tested, E. coli was detected in all but one sample, and enterococci were detected in all samples.
Enumeration of Vibrio spp. in an estuarine lake
Using the culture technique, Vibrio spp. were detected in 98% (n = 99) of water samples, with bacterial counts ranging from 30 to 8.65 × 10^4^ CFU/L. Temporal variation in the prevalence of Vibrio spp. was observed over the course of the year (Fig. 2). Concentrations of Vibrio spp. were greater during the summer months (June, July, and August, n = 27), with the geometric mean of the concentrations being 3.2 × 10^4^ CFU/L. In the winter months (January and February, n = 18), the average Vibrio concentration was 3.1 × 10^1^ CFU/L. A two-tailed t-test showed a significant difference between these seasons (P = 3.7 × 10^−6^). Comparisons between individual months found that Vibrio spp. concentrations in January and February were significantly different from concentrations in May, June, and July (Table S5). Additionally, bacterial culture concentrations in October and November of 2024 were significantly different from February of the same year (Table S5). Quantitative PCR results showed a similar temporal pattern, with Vibrio DNA concentrations tending to be higher in water samples during the summer months, but none of these differences were significant with the Wilcoxon signed-rank test (Fig. 3).
Temporal occurrence of Vibrio spp. in nine recreational sites as determined using culture assay with selective media. The y-axis shows the log10 of Vibrio spp. concentrations in CFU per liter. The x-axis shows sampling months, with each dot representing data from individual samples.
Monthly distributions of Vibrio spp. concentrations as determined by (A) bacterial culture methods in CFU/L and (B) qPCR in cells/L. The x-axis shows the months when the samples were collected. Each dot represents an individual sample. Box boundaries represent the lower (Q1) and upper (Q3) quartiles, and whiskers extend to the minimum and maximum non-outlier values. Temporal differences in Vibrio spp. concentrations were statistically significant for bacterial culture methods, with January and February showing significant differences from some spring, summer, and fall months (Table S5).
The prevalence of Vibrio spp. also varied spatially in Lake Pontchartrain (Fig. 4). For example, the sampling sites LP 1 and LP 4 had consistently lower geometric means of Vibrio spp., while sites LP 3 and LP 8 both had geometric means greater than 2.0 × 10^4^ CFU/L (Fig. 4). The site LP 3 had the highest concentration of Vibrio DNA, which matched the trend for culturable Vibrio. Furthermore, qPCR data revealed that LP 1 had a significantly different number of Vibrio spp. cells compared to LP 3, LP 5, and LP 7 (Table S6).
Spatial distributions of Vibrio spp. concentrations as determined by (A) bacterial culture methods in CFU/L and (B) qPCR in cells/L. Vibrio spp. concentrations varied within the north shore and south shore sites. The x-axis shows each sampling site. The LP 1–LP 3 are sites located on the north shore of the lake, and LP 4–LP 9 are the south shore sites. Each dot represents an individual sample. Box boundaries represent the lower (Q1) and upper (Q3) quartiles, and whiskers extend to the minimum and maximum non-outlier values. Pairwise comparison of Vibrio spp. (cells/L) measured by qPCR was found to be significantly different between site LP 1 and LP 3, LP 5, and LP 7 over the course of the study (Table S6). Additionally, detected Vibrio spp. for sites LP 3 and LP 4 were statistically different (Table S6).
Correlations between the occurrence of Vibrio spp. and water quality
FIB, such as E. coli and enterococci, are commonly used as an indicator for fecal contamination in recreational water. In this study, the Pearson correlation test found only a very weak correlation (r < 0.2) between FIB and the detection of Vibrios in water samples. The months when average FIB concentrations were at their peak (March 2024, April 2024, and October 2024) were not the same months when Vibrio spp. concentrations were highest (May 2024, June 2024, and July 2024) (Table S4; Fig. 3).
The linear models between Vibrio concentrations and environmental factors showed that salinity and temperature were significant predictors of Vibrio concentrations from both bacterial culture and direct qPCR methods (Table 2). Additionally, precipitation was a significant predictor for culturable Vibrio spp. in this study (Fig. S2). The model for bacterial culture concentration had a higher adjusted r^2^ value compared to the qPCR model (0.3914 and 0.1401, respectively), meaning that concentrations from bacterial culture methods were better predicted by environmental factors. Furthermore, a Pearson correlation test shows that Vibrio concentrations as determined using the culture method and direct qPCR were weakly correlated with an r^2^ value of 0.2585.
Additional temporal analysis focused on samples collected from the south shore sites (LP 4–LP 9) in September 2024, the week following Hurricane Francine, revealed that several environmental parameters were significantly different compared to samples collected at the same sites later in Fall 2024. Specifically, salinity, rainfall, and temperature differed significantly between September and the months of October and November 2024 (P < 0.05). However*, Vibrio* spp. concentrations, as measured by both bacterial culture and qPCR methods, were not significantly different across these time points (P > 0.05). In contrast, a parametric t-test showed a significant difference in culturable Vibrio concentrations when comparing water samples collected in November 2024 to those collected in November 2023, a period when no named storms impacted the New Orleans area. Average Vibrio spp. concentrations measured by culture were 5.1 × 10⁴ CFU/L in November 2023 and 1.2 × 10⁴ CFU/L in November 2024, a statistically significant difference (P = 0.047).
Presence of Vibrio species of concern
Conventional PCR targeting the toxR gene, a transcriptional regulator of virulence and survival genes, was used to confirm and identify culturable Vibrio species of concern. Among the samples collected (n = 101), 85.2% (n = 86) contained at least one colony that tested positive for V. cholerae toxR gene, 20.8% (n = 21) for V. parahaemolyticus toxR gene, and 50.5% (n = 51) for V. vulnificus toxR gene (Fig. 5; Table S7). Notably, nine samples (8.9%) contained at least one colony that was positive for the toxR gene of all three species of concern. In June, July, September, and October 2024, all sampling sites contained at least one colony positive for the V. cholerae toxR gene (Fig. 5).
Vibrio spp. toxR genes were detected in every sampling month over the course of the study. Spatiotemporal variability of culturable (A) V. cholerae, (B) V. parahaemolyticus, and (C) V. vulnificus in an estuary as confirmed using conventional PCR targeting the toxR gene. Gray squares represent time periods when samples were not collected.
Quantitative PCR assays were also used for the direct detection of Vibrio species of concern, using DNA extracted from filters without any culture steps (Table S7). In contrast to the detection of the toxR gene, the V. cholerae ctxA gene, which codes for the A subunit of the cholera toxin, was only found in four samples (3.9%), with concentrations ranging from 33.24 to 105.8 gene copies per liter (GC/L) (Fig. 6; Table S7). The V. parahaemolyticus gyrB gene, which encodes this species’ DNA gyrase and appears a single time in the genome of each organism, was detected in 41.6% of samples, with concentrations ranging from 12.28 to 1.28 × 10^4^ GC/L. With direct qPCR, there was no clear trend in times of year or specific sites where V. parahaemolyticus gyrB gene was more prevalent (Fig. 6; Table S7).
Genes essential for toxin production V. cholerae ctxA and V. vulnificus vvhA were detected in water samples from Lake Pontchartrain. Spatiotemporal variability of (A) V. cholerae ctxA gene, (B) V. parahaemolyticus gyrB gene, and (C) V. vulnificus vvhA gene in an estuary as confirmed by qPCR. Gray squares represent time periods when samples were not collected.
Direct qPCR revealed a high prevalence of the single-copy V. vulnificus vvhA gene, which encodes a hemolysin protein associated with pathogenicity. The gene was detected in 84.2% (n = 85) of samples, with concentrations ranging from 6.49 to 7.21 × 10⁵ GC/L (Fig. 6; Table S7). Temporal patterns were evident: no vvhA gene was detected in January 2024, while all samples from April through September 2024 were tested positive (Fig. 6). The highest concentrations occurred from June to September, ranging from 9.23 × 10^2^ to 7.21 × 10⁵ GC/L (Fig. 7A; Table S7). The only months that there were not significant differences in vvhA concentrations between January 2024 were February and March 2024 (Fig. 5 and 6; Table S9). Significant differences were also seen between February 2024 and July, August, and September 2024 (Table S9). Spatially, the highest concentrations were observed at sites LP 4, LP 6, LP 7, and LP 8—all located on the south shore of Lake Pontchartrain (Fig. 7B; Table S6).
Vibrio vulnificus hemolysin (vvhA) gene showed significant temporal variation across the study months. The concentration of V. vulnificus vvhA gene in an estuary. Quantitative PCR showing (A) temporal and (B) spatial distributions of the gene. Each dot represents an individual sample. Box boundaries represent the lower (Q1) and upper (Q3) quartiles, and whiskers extend to the minimum and maximum non-outlier values. Pairwise comparisons showed significant differences between vvhA gene copies/L in winter months (January and February) and spring, summer, and fall (Table S9).
Diversity of Vibrio spp. in an estuarine lake
Four sequencing libraries were created from the 60 different samples that were barcoded for long-read nanopore sequencing. For sequencing runs that failed before 72 h, the same library was run again to generate more sequencing reads. In total, 7 runs were used in this study, with a total of 146 million reads generated and 534.86 Gb of DNA sequenced (Table S11). The N50 values for the reads ranged from 4.89 to 8.31 kb.
Sequencing bacterial colonies pooled from 60 sample culture plates and comparing them to known sequences in the NCBI GenBank database revealed that the majority of the reads aligned with V. cholerae genomes (Fig. 8). Of the total nucleotides sequenced, 36.7% were identified as V. cholerae, followed by V. vulnificus with 13.6%, and V. mimicus with 10.3%. The “Other” category contains those species that contributed less than 1% of the sequenced nucleotides, which includes over 37 other known Vibrio species (Fig. 8; Table S12). Of the pooled isolate samples (n = 60), nine samples contained reads that aligned with the wbf gene cluster, indicative of the O139 serotype (Fig. 8).
Bacterial isolate sequencing revealed that V. cholerae, V. vulnificus, V. mimicus, and V. parahaemolyticus made up the majority of Vibrio spp. communities in the estuary, with the presence of V. cholerae O139 serotype. (A) Pie chart showing the proportion of sequenced nucleotides that corresponds to Vibrio spp. in the samples. Species that made up <1% of total nucleotides were placed in the “Other Vibrio spp.” category. (B) Heatmap showing sampling dates and sites when V. cholerae O139 was detected from pooled isolate samples. Gray squares represent instances when samples were not sequenced.
DISCUSSION
Previous reports in Louisiana have focused on the surveillance of Vibrio infections (38) and culturable Vibrio spp. in oysters from the Gulf of Mexico (39). One previous study in Lake Pontchartrain focused on Vibrio concentrations in offshore and canal sampling sites, following major hurricanes (26). This study instead focused on the occurrence and diversity of Vibrio spp. in brackish water from Lake Pontchartrain, specifically in recreational areas. At these sites, the mean culturable Vibrio spp. concentrations were found to be highest during the months of May, June, and July, which aligns with results from the linear model comparing these concentrations and environmental factors. The linear model showed that temperature, salinity, and precipitation were significant predictors of culturable Vibrio concentration. This is in line with other studies of environmental Vibrio that have noted a linear relationship between temperature and Vibrio concentrations (9, 40, 41).
Similarly, a linear model showed that both temperature and salinity were significant predictors of Vibrio 16S rRNA gene concentrations. However, the r^2^ values for these models show that all environmental factors included in the model explained about 39% of the culturable Vibrio spp. variation and only about 14% of the qPCR Vibrio concentration. It is possible that gene concentrations would be less correlated with environmental factors, as Vibrio spp. can exist in a dormant, nonculturable state when environmental conditions fluctuate and can still be detected by qPCR (19). Vibrio spp. can survive at temperatures as low as 4°C by entering this dormant state, but optimum growth occurs at temperatures between 25°C and 30°C. It is possible that this VBNC state contributed to the lower r^2^ value for the qPCR model, as this method would account for bacteria in a metabolically dormant state during the winter months (10). This is further evidenced by the significant differences in Vibrio spp. abundance between January and February 2024 and May, June, and July 2024 for cultured colonies, but not concentrations as determined by qPCR, showing that fluctuations in culturable Vibrio spp. concentrations do not directly reflect changes in the total amount of Vibrio genes. Even with all six environmental factors included in the model (salinity, temperature, precipitation, DO, TDSs, and pH), less than half of the fluctuation in culturable Vibrio spp. concentrations was explained. These results show the importance of monitoring Vibrio spp. in recreational waters throughout the year, as environmental factors alone are insufficient for predicting potential risk of exposure to recreators.
The Louisiana Department of Health (LDH) monitors 23 beaches across the state, including one site on the northern Lake Pontchartrain, for enterococci as indicators for fecal contamination, while the Louisiana Department of Environmental Quality (DEQ) continuously monitors a site in the center of the lake for fecal coliforms (Louisiana BEACH Grant Report 2024 Swimming Season, 2024; Louisiana Water Quality Inventory: Integrated Report, 2024). The LDH and DEQ use these measures to make advisories about beach safety, but neither entity conducts any water testing for Vibrio in Louisiana beaches because Vibrio are naturally present in warm coastal water. In this study, many recreational sites were tested for FIB and held to the EPA recommendation of less than 35 Enterococci per 100 mL and less than 126 E. coli per 100 mL of water sample. Even when FIB levels were below these limits, pathogenic Vibrio spp. were detected in water samples. For water samples that exceeded the EPA standard levels for FIB, there was a very weak correlation between Vibrio concentrations and FIB. Studies on the correlation between FIB and Vibrio abundance have shown mixed results, with some showing increased counts of Vibrio near sources of fecal contamination and others showing no correlation between the two types of bacteria (42, 43). This again underscores the need for Vibrio testing, as environmental factors or FIB presence cannot fully predict the variability of these bacteria in coastal recreational waters.
In addition to normal seasonal variations in environmental parameters, Hurricane Francine impacted the city of New Orleans during September 2024. This event caused significant differences between salinity, rainfall, and temperature for this month compared to other samples collected during the Fall of 2024. A comparison between November 2024, after this extreme weather event, and the previous November, when New Orleans experienced no named tropical disturbances, shows that the Vibrio spp. was significantly lower in November 2024. This differs from a study conducted after Hurricane Ian made landfall in Florida in 2022, which showed that environmental changes due to the storm made the waters more favorable for Vibrio spp. growth (44). However, it is not possible to compare Vibrio spp. concentrations from September 2023 to determine whether Vibrio spp. concentrations may have been higher immediately following Hurricane Francine. While in this study, comparison could only be made 2 months after the hurricane, it is important to continue to study how these extreme weather events can influence Vibrio spp. populations.
For the samples collected in this study, V. cholerae toxR gene was present in most samples, followed by V. vulnificus toxR gene, and finally V. parahaemolyticus toxR gene. This is corroborated by past research on water samples from Lake Pontchartrain and the Gulf of Mexico, where these three species of Vibrio were present (25, 26). However, epidemiological data suggest that V. parahaemolyticus is the most commonly reported cause of vibriosis in Louisiana and the U.S. (7, 22, 45), but V. parahaemolyticus toxR gene was only present in 14% of samples. This could be attributed to the fact that V. parahaemolyticus tends to be more associated with shellfish, particularly oysters, while V. cholerae is found more often in the water column (16). While V. parahaemolyticus was found in fewer water samples, its association with seafood could explain the higher rates of infection.
Quantitative PCR results for specific toxin genes of V. cholerae and V. vulnificus, cholera toxin, and V. vulnificus hemolysin, respectively, show that these are not directly correlated to the presence of the toxR gene in either of these species. In this study, the cholera toxin gene (ctxA), which encodes the cholera toxin responsible for potentially deadly diarrhea and epidemics around the world (46, 47), was only found in 4% of samples. However, in 128 samples collected in Lake Pontchartrain between 2005 and 2006, none tested positive for the ctxA gene (26). This could be due to changing conditions in the lake or because, in this study, the ctxA gene was identified using qPCR, which can identify the gene even if the bacteria are in a VBNC state. The ctxA gene is essential for expression of the cholera toxin protein, and this gene has been associated with all forms of pandemic V. cholerae (47). Although cholera incidence in the U.S. has remained low in recent decades, environmental shifts that have the potential to affect the ecology of Vibrio cholerae underscore the need for continued monitoring of this pathogen in coastal waters (22, 48).
While both the V. vulnificus hemolysin gene and the Vibrio 16S rRNA concentrations peaked during summer months, they did not peak at the same time. This could mean that the risk of interaction with toxigenic Vibrio spp. persists in months when total Vibrio populations are lower. Even in times when there are lower concentrations of Vibrio bacteria in the water, recreators still interface with toxin-producing species. Additionally, the site with the highest concentration of both culturable Vibrio spp. and Vibrio 16S rRNA genes, LP 3, did not contain the highest concentration of V. vulnificus hemolysin genes. This shows that the spatial distribution of pathogenic Vibrio could differ from the overall distribution of Vibrio species. Although long-read nanopore sequencing has recently been used to study organismal isolates, this is the first time it has been implemented as a continuous surveillance tool across recreational water sites (49, 50). Analysis of sequences revealed that the V. cholerae made up the largest proportion of culturable Vibrio spp. in collected samples, and the O139 serotype was present at sampling sites. This strain emerged in the 1990s and has been responsible for global epidemic outbreaks of V. cholerae (51). Cholera infections make up a very small proportion of total reported Vibrio infections in the U.S (22), and there has only been one confirmed V. cholerae O139 case in Louisiana since 1988 (45). Furthermore, sequencing of the pooled Vibrio colonies revealed 41 species of Vibrio, including V. mimicus, which is very similar to V. cholerae and can contain the genes for the cholera toxin (52, 53). While much of the work on Vibrio spp. focuses on the three species of concern, V. cholerae, V. vulnificus, and V. parahaemolyticus, there is a large diversity of bacteria in this genus, and it could be important to look at the dynamics between different species beyond those most commonly studied. Identifying other Vibrios that infect humans, including V. fluvialis and V. mimicus, which were both detected by bacterial isolate sequencing, can be important in assessing the risk of vibriosis in recreational waters (1). Moreover, analysis of these complex bacterial populations could reveal relationships between different Vibrio species that could be used to further understand the spatiotemporal dynamics of pathogenic species.
One advantage of bacterial isolate genome sequencing is that it does not require primer design like target-specific PCR. This allows for the detection of all Vibrio spp. and serotypes in a sample, not just the pre-defined species of concern (35). Furthermore, the use of nanopore long-read sequencing allows for the identification of specific virulence genes, like the wbz gene specific to the V. cholerae O139 serotype, that can help in understanding the Vibrio spp. community beyond the species level. However, this method is relatively costly and time-consuming compared to more rapid detection with PCR methods. Although culture methods have long been considered the gold standard for pathogen detection, they require incubation times between 24 and 48 h, which can hinder rapid detection of Vibrio spp. in recreation waters. Since qPCR can be run without growing the bacteria, it can get faster results, but it tests for the presence of DNA rather than viable cells (54). This means that the qPCR technique can quantify all living Vibrio in a sample, even if they are metabolically dormant, but it also quantifies genetic material present in dead cells. These approaches all have their advantages and disadvantages, but they can be used together to get a comprehensive understanding of microbial communities in recreational water (54). For example, continuous monitoring of Vibrio concentrations and the presence of infectious Vibrio using a combination of culture- and molecular-based methods would facilitate more accurate assessment of the exposure risk posed to recreators in coastal water environments.
Conclusion
Vibrio spp. concentrations were found to be highest in recreational water of Lake Pontchartrain in the summer, with a moderate correlation between water temperature and culturable Vibrio spp., but the bacteria persisted throughout the year. Furthermore, PCR and genome sequencing revealed the presence of V. cholerae, including the O139 serotype, V. vulnificus, V. parahaemolyticus, V. mimicus, and 37 of other species in these samples. It would be valuable for future studies to determine other environmental parameters that influence the variation in Vibrio spp. populations and the interactions between the different bacterial species that make up the Vibrio community in these waters. This study has broader public health and environmental implications as future climate scenarios suggest that summers will become longer and warmer, increasing the exposure risk of pathogenic Vibrio during recreational activities (15, 40, 48).
The reference list from the paper itself. Each links out to its DOI / PubMed record.
- 1Baker-Austin C, Oliver JD, Alam M, Ali A, Waldor MK, Qadri F, Martinez-Urtaza J. 2018. Vibrio spp. infections. Nat Rev Dis Primers 4:8. doi:10.1038/s 41572-018-0005-830002421 · doi ↗ · pubmed ↗
- 2Robert-Pillot A, Copin S, Himber C, Gay M, Quilici M-L. 2014. Occurrence of the three major Vibrio species pathogenic for human in seafood products consumed in France using real-time PCR. Int J Food Microbiol 189:75–81. doi:10.1016/j.ijfoodmicro.2014.07.01425128747 · doi ↗ · pubmed ↗
- 3Jones JL. 2014. VIBRIO | introduction, including Vibrio parahaemolyticus, Vibrio vulnificus, and other Vibrio species, p 691–698. In Batt CA, Tortorello ML (ed), Encyclopedia of food microbiology, 2nd ed. Academic Press, Oxford.
- 4Vanden Broeck D, Horvath C, De Wolf MJS. 2007. Vibrio cholerae: cholera toxin. Int J Biochem Cell Biol 39:1771–1775. doi:10.1016/j.biocel.2007.07.00517716938 · doi ↗ · pubmed ↗
- 5Morris JG Jr. 2011. Cholera—modern pandemic disease of ancient lineage. Emerg Infect Dis 17:2099–2104. doi:10.3201/eid 1711.11110922099113 PMC 3310593 · doi ↗ · pubmed ↗
- 6Heng SP, Letchumanan V, Deng CY, Ab Mutalib NS, Khan TM, Chuah LH, Chan KG, Goh BH, Pusparajah P, Lee LH. 2017. Vibrio vulnificus: an environmental and clinical burden. Front Microbiol 8:997. doi:10.3389/fmicb.2017.0099728620366 PMC 5449762 · doi ↗ · pubmed ↗
- 7Newton A, Kendall M, Vugia DJ, Henao OL, Mahon BE. 2012. Increasing rates of vibriosis in the United States, 1996-2010: review of surveillance data from 2 systems. Clin Infect Dis 54:S 391–S 395. doi:10.1093/cid/cis 24322572659 PMC 4604744 · doi ↗ · pubmed ↗
- 8Stavric S, Buchanan B. 1997. Does Vibrio vulnificus present a health threat to Canadians? Can J Infect Dis 8:279–285. doi:10.1155/1997/75675422346524 PMC 3250891 · doi ↗ · pubmed ↗