Investigation of the presence of human adenovirus, norovirus, and rotavirus in tap water in Marrakech, Morocco
Nouhaila Elfellaki, Salma Berrouch, Houda Rafi, Simeon Goïta, Hibatallah Lachkar, Jamal Eddine Hafid

TL;DR
This study found high levels of human adenovirus and other viruses in tap water in Marrakech, highlighting the need for better water monitoring and treatment to protect public health.
Contribution
This is the first study to investigate enteric viruses in tap water in Marrakech, Morocco, providing critical baseline data for the region.
Findings
Human adenovirus was detected in 92.15% of tap water samples.
Human norovirus genogroup II and group A rotavirus were also frequently detected.
Human norovirus genogroup I was not found in any samples.
Abstract
Given the significant role played by human pathogenic viruses in causing waterborne diseases, the necessity of monitoring viral contamination in drinking water is paramount for public health. The prevalence of enteric viruses in drinking water remains under-researched in Morocco, with a paucity of data on the issue. The present study, therefore, sought to assess the presence of enteric viruses, namely, human adenovirus (HAdV), human norovirus genogroup I (HNoV-GI) and genogroup II (HNoV-GII), and group A rotavirus (RVA) in tap water in Marrakech. A total of 102 tap water samples were collected, with virus concentration carried out using an internally validated method based on electronegative membranes. The application of quantitative PCR and reverse transcription-quantitative PCR techniques enabled the detection of HAdV in 92.15% of the samples, HNoV-GII in 48.03%, and RVA in 43.13%. It…
Genes, proteins, chemicals, diseases, species, mutations and cell lines named across the full text — each resolved to its canonical identifier and authoritative record.
Click any figure to enlarge with its caption.
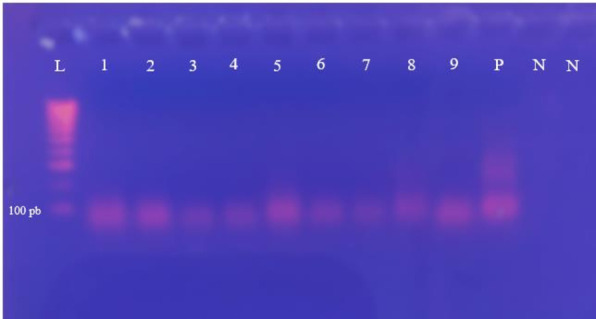 Fig 1
Fig 1| Assay | Target gene | Primer or probe sequence (5′–3′) | Amplification conditions | Reference(s) |
|---|---|---|---|---|
| HAdV qPCR | Hexon gene | P: FAM- | 3 min at 95°C | ( |
| HNoV-GII RT-qPCR | ORF2 | P: FAM-AGC ACG TGG GAG GGC GAT CG-TAMRA | 30 min at 50°C | ( |
| HNoV-GI RT-qPCR | Capsid | P: FAM- | 30 min at 50°C | ( |
| RVA RT-qPCR | Gene NSP3 | P: FAM- | 30 min at 48°C | ( |
| Physicochemical parameter | Overall mean ± SD |
|---|---|
| Temperature ( | 20.71 ± 5.55 |
| pH | 7.53 ± 0.25 |
| Conductivity (µS/cm) | 947.50 ± 415.41 |
| Turbidity (NTU) | 1.03 ± 0.53 |
| Dissolved oxygen (mg/L) | 8.76 ± 0.20 |
| Sample date (mo-yr) | HAdV | HAdV/Hu-NoV:GII | HAdV/RVA | Hu-NoV:GII | Hu-NoV:GII/RVA | RVA | HAdV/Hu-NoV:GII/RVA | Total positive samples |
|---|---|---|---|---|---|---|---|---|
| Feb-24 | 0/9 | 0/9 | 0/9 | 0/9 | 0/9 | 0/9 | 9/9 | 9/9 |
| Mar-24 | 0/7 | 0/7 | 1/7 | 0/7 | 0/7 | 0/7 | 6/7 | 7/7 |
| Apr-24 | 0/9 | 0/9 | 0/9 | 0/9 | 1/9 | 0/9 | 8/9 | 9/9 |
| May-24 | 1/9 | 6/9 | 0/9 | 0/9 | 0/9 | 0/9 | 2/9 | 9/9 |
| June-24 | 0/8 | 2/8 | 3/8 | 0/8 | 0/8 | 0/8 | 3/8 | 8/8 |
| July-24 | 5/8 | 3/8 | 0/8 | 0/8 | 0/8 | 0/8 | 0/8 | 8/8 |
| Sept-24 | 9/9 | 0/9 | 0/9 | 0/9 | 0/9 | 0/9 | 0/9 | 9/9 |
| Oct-24 | 9/9 | 0/9 | 0/9 | 0/9 | 0/9 | 0/9 | 0/9 | 9/9 |
| Nov-24 | 8/8 | 0/8 | 0/8 | 0/8 | 0/8 | 0/8 | 0/8 | 8/8 |
| Dec-24 | 8/9 | 0/9 | 0/9 | 0/9 | 0/9 | 0/9 | 0/9 | 8/9 |
| Jan-25 | 6/9 | 0/9 | 1/9 | 0/9 | 1/9 | 0/9 | 1/9 | 9/9 |
| Feb-25 | 0/8 | 0/8 | 0/8 | 0/8 | 4/8 | 1/8 | 3/8 | 8/8 |
| Total | 46/102 | 11/102 | 5/102 | 0/102 | 6/102 | 1/102 | 32/102 | 101/102 |
| Virus | No. of positive samples/total analyzed samples (mean Cq ± SD) | Total positive samples/total analyzed samples | ||||
|---|---|---|---|---|---|---|
| Winter 2024 | Spring 2024 | Summer 2024 | Autumn 2024 | Winter 2025 | ||
| HAdV | 14/14 (28.91 ± 1.20) | 25/26 (29.26 ± 4.54) | 16/16 (35.94 ± 0.51) | 25/26 (35.99 ± 0.70) | 14/20 (35.62 ± 0.58) | 94/102 |
| HNoV-GII | 13/14 (28.82 ± 2.42) | 24/26 (25.63 ± 1.74) | 3/16 (30.33 ± 1.79) | 0/26 | 9/20 (26.17 ± 1.85) | 49/102 |
| RVA | 14/14 (30.31 ± 1.11) | 17/26 (29.50 ± 0.91) | 2/16 (28.18 ± 0.18) | 0/26 | 11/20 (31.19 ± 1.10) | 44/102 |
| Physicochemical parameter | HAdV | HNoV-GII | RVA |
|---|---|---|---|
| Temperature ( | |||
| Mean (+) | 21.11 ± 5.57 | 19.44 ± 4.87 | 18.11 ± 3.83 |
| Mean (−) | 16.00 ± 2.39 | 21.88 ± 5.92 | 22.68 ± 5.87 |
| | 0.010 | 0.040 | <0.001 |
| pH | |||
| Mean (+) | 7.52 ± 0.24 | 7.57 ± 0.25 | 7.59 ± 0.23 |
| Mean (−) | 7.62 ± 0.31 | 7.49 ± 0.24 | 7.49 ± 0.25 |
| | 0.337 | 0.113 | 0.035 |
| Conductivity (µS/cm) | |||
| Mean (+) | 948.60 ± 424.73 | 643.14 ± 374.51 | 607.55 ± 397.11 |
| Mean (−) | 934.62 ± 304.95 | 1,228.89 ± 194.22 | 1,205.40 ± 172.98 |
| | 0.407 | <0.001 | <0.001 |
| Turbidity (NTU) | |||
| Mean (+) | 1.03 ± 0.54 | 1.07 ± 0.59 | 1.05 ± 0.57 |
| Mean (−) | 1.08 ± 0.40 | 1.00 ± 0.46 | 1.02 ± 0.49 |
| p-value | 0.328 | 0.707 | 0.727 |
| Dissolved oxygen (mg/L) | |||
| Mean (+) | 8.76 ± 0.20 | 8.75 ± 0.22 | 8.78 ± 0.22 |
| Mean (−) | 8.71 ± 0.18 | 8.77 ± 0.18 | 8.74 ± 0.19 |
| | 0.403 | 0.709 | 0.270 |
- —Fondation OCPhttp://dx.doi.org/10.13039/501100016150
Peer Reviews
No public reviews on file for this paper yet. If you reviewed it on a platform where reviews are public (OpenReview, ICLR, NeurIPS, ICML), you can paste yours below so the community can read it here.
Videos
No videos yet. Explain this paper in a talk, walkthrough, or lecture? Add one.
Taxonomy
TopicsViral gastroenteritis research and epidemiology · Fecal contamination and water quality · Child Nutrition and Water Access
INTRODUCTION
Access to safe and easily accessible drinking water is essential for public health. Its availability depends on existing water resources and is strongly influenced by climate change, population growth, social transformations, and urbanization. The World Health Organization (WHO) (1) reported that in 2020, 5.8 billion people had access to drinking water, meeting essential criteria: protection from pollution, availability on-site, accessibility when needed, and absence of contamination, while two billion people still lacked these conditions and were therefore at risk of exposure to unsafe water. Even treated drinking water may pose health risks due to potential pollution that can compromise its quality. Between 1971 and 2006, 780 outbreaks linked to contaminated drinking water were reported in the United States, affecting 577,094 people (2). In Europe, numerous episodes have also been documented; for instance, Spain reported 413 outbreaks between 1999 and 2006, affecting 23,642 individuals (3). Of the 117 outbreaks with a confirmed etiology, most (95.72%) were caused by infectious agents. Among the 48 viral outbreaks, norovirus was the most frequently detected pathogen (54.16%), followed by hepatitis A virus (29.16%) and rotavirus (12.5%) (3).
Enteric viruses are therefore a major concern for public health due to their ability to cause widespread infections (1). Human adenovirus (HAdV) is recognized as a potential contaminant of drinking water (4), while human noroviruses (HNoVs) are responsible for millions of cases of non-bacterial acute gastroenteritis worldwide (5). Group A rotavirus (RVA), the leading cause of severe gastroenteritis in infants, remains a significant contributor to child morbidity and mortality (6, 7). Following WHO recommendations, the Ministry of Health of Morocco introduced the monovalent rotavirus vaccine, Rotarix, into the national vaccination program in 2010 to reduce the high burden of rotavirus disease in the country (8).
This underscores the imperative for vigilant monitoring and control of pathogens in water, especially in regions exhibiting high vulnerability.
The presence of these viruses in drinking water remains a significant public health concern, as even at low concentrations, they can cause illness after ingestion (9). In this context, numerous techniques have been developed since the 1960s for various types of water (10). Among these approaches, the use of a magnesium chloride (MgCl_2_) pretreatment followed by filtration through electronegative membranes, combined with molecular methods, has emerged as a commonly employed strategy (11–19). These methodological advancements signify a pivotal stage in the evaluation of the viral risks associated with drinking water. In a previous stage of this study, several concentration methods were evaluated. Among these, a method based on preconditioning with MgCl_2_, followed by filtration through an electronegative membrane and elution with sodium hydroxide, proved to be effective for the simultaneous recovery of HAdV, human norovirus genogroup I (HNoV-GI)/genogroup II (HNoV-GII), and RVA from tap water (20).
Globally, numerous studies have focused on the detection of enteric viruses in water samples, covering various types of water sources. A meta-analysis revealed a global prevalence of AdV in water of 59.28% (95% confidence interval [CI]: 54.46–64.02), with variations depending on the water matrix; for drinking water, the prevalence was 22.70% (95% CI: 12.61–34.53) (21). HNoV has also been reported worldwide, with a prevalence of 31.7% (95% CI: 25.1–38.5), although this varied according to the type of water source. The meta-analysis indicated the highest HNoV prevalence in Africa, at 55.9% (95% CI: 28.2–81.9) (22). For RVA, another meta-analysis estimated the global prevalence of RVA in water environments at 40.86% (95% CI: 34.04–47.85). The prevalence in drinking water was lower, at 9.46% (95% CI: 3.71–17.18). In Africa, the prevalence was notably higher, reaching 51.75% (23).
In Morocco, no studies to date have specifically addressed the prevalence of enteric viruses in surface waters or in water intended for human consumption. Existing research has primarily focused on the detection of these viruses in marine environments, particularly in mussels and other shellfish, which are known bioaccumulators of waterborne pathogens (24, 25).
In this context, an in-depth study was conducted to assess water quality and detect the presence of HAdV, HNoV-GI/HNoV-GII, and RVA in Marrakech by applying a sensitive concentration method in water, using quantitative real-time PCR and RT-PCR.
MATERIALS AND METHODS
Sample collection
A total of 102 2 L samples were collected over a 1-year period, from February 2024 to February 2025, except in August 2024, with two samples collected per week from the laboratory of Bioresources and Food Safety at the Faculty of Science and Technology in Marrakech. The laboratory is supplied by the municipal water treatment plant managed by the National Office of Electricity and Potable Water, which relies on 93% surface water and 7% groundwater as its sources. It applies a conventional treatment procedure including coagulation–flocculation, sedimentation, sand filtration, and disinfection by chlorination.
The collected samples were stored at 4°C, filtered, and analyzed within 24 h of sampling.
Physicochemical parameters of water samples
In order to assess water quality and identify potential PCR inhibitors, we measured physicochemical parameters, namely, temperature, pH, turbidity, conductivity, and dissolved oxygen, using a portable analysis kit (multi-parameter portable meter MultiLine).
Virus concentration method
The water samples were processed using an adsorption–elution method with membrane filtration, as previously described (20). First, anhydrous MgCl_2_ was added to the water samples to achieve a final concentration of 25 mM. This created the necessary conditions to promote the adsorption of viruses onto the negatively charged membranes. The samples were then filtered through negatively charged nitrocellulose membranes (47 mm diameter, 0.45 μm pore size; Sartorius). This type of membrane is commonly used to trap viruses in water samples. To remove any remaining cations on the membrane, 200 mL of a 0.5 mM H_2_SO_4_ solution (pH 3.0) was passed through the filter. This step is crucial for neutralizing the cation charges and facilitating the release of the captured viruses. Next, the virus elution was performed by adding 5 mL of 1.0 mM NaOH (pH 10.8), which alters the pH of the solution and allows the viruses to be eluted from the membrane. The solution was agitated at 120 rpm for 30 min, followed by three 1-min vortex cycles to ensure uniform distribution of the viruses in the solution. The resulting supernatant was collected in a tube containing 50 μL of 100 mM H_2_SO_4_ and 100 μL of 100 mM Tris-EDTA, which serve as neutralization buffers to stabilize the viruses. Finally, the supernatant was centrifuged at high speed (10,000 × g) for 45 min to concentrate the virus by reducing the volume to approximately 1 mL. A second centrifugation step was performed at the same speed for 30 min to achieve a final volume of 150 µL.
Positive and negative controls
To ensure the reliability of the analyses, positive and negative controls were prepared. Separate 2 L water samples were heated to 100°C for 30 min and then allowed to cool. After cooling, each sample was spiked with 30 µL of viral suspension containing either HAdV, HNoV-GI, HNoV-GII, or RVA. Viral suspensions were obtained from positive diarrheic stool samples of infected patients, generously provided by the virology laboratories of the University Hospitals of Dijon and Saint-Étienne, France. To determine the quantification cycle (Cq) values for each sample in our laboratory, 30 μL of stool was added directly, without any prior preparation, to 120 μL of ultrapure water. This mixture, with a final volume of 150 μL, was used for nucleic acid extraction. The extracted nucleic acid was then amplified by real-time PCR and RT-PCR. The spiked water samples were homogenized by stirring to ensure even virus distribution before analysis. These samples served as positive controls, essential for detecting potential false negatives. A sterilized, non-spiked sample was used as a negative control to confirm the absence of cross-contamination.
Real-time PCR and real-time RT-PCR settings
Nucleic acid extraction was performed using NucleoSpin RNA columns (Macherey-Nagel), following the manufacturer’s instructions. Nucleic acids were eluted in a final volume of 80 μL. PCR conditions were set as described below (Table 1).
The PCR mixtures for the detection of HAdV and HNoV-GII were prepared as previously described in reference 20.
For HNoV-GI, the same one-step RT-PCR mixture as for HNoV-GII was used, with the Sensifast Probe Lo-RoX One-Step kit (Meridian Bioscience) in a 20 μL reaction mixture, which included 4 μL of RNA templates, 16 μL of master mix containing 400 nM of each primer, 100 nM of probe, and RNase-free water up to the final volume.
For RVA detection, the RNA extracts were denatured for 5 min at 97°C, followed by cooling on ice for 5 min to separate the double-stranded RNA. Real-time RT-PCR assays were performed using the 4× CAPITAL 1-Step qRT-PCR Probe Master Mix (biotechrabbit) in a 20 μL reaction mixture containing 5 μL of RNA templates, 15 μL of master mix with 400 nM of each primer, 100 nM of probe, and RNase-free water up to the final volume.
All PCR analyses were performed using a MyGo Pro Real-Time PCR instrument. PCR reactions were conducted in duplicate, and the Cq values were averaged (Cq ≤40 were considered positive).
For each water sample, 10 µL of PCR product was collected and analyzed as follows.
Gel electrophoresis analysis
PCR products were analyzed by a 2% agarose gel electrophoresis containing 5 µL of ethidium bromide (0.3 µg/mL). Each sample was mixed with 2 µL of loading dye (biotechrabbit) and loaded onto the gel alongside a 100 bp molecular weight marker (DNA Ladder with 6× Loading Dye, biotechrabbit) and positive and negative controls. The gel was then immersed in 1× TBE buffer (Tris-borate-EDTA, pH 8.0) and electrophoresed at 120 V for 40–45 min. After electrophoresis, the amplified products were visualized under UV light using a UV transilluminator following ethidium bromide staining. Amplicon sizes were determined by comparison with the molecular weight marker and controls (Fig. 1).
Visualization of PCR products for HAdV-positive tap water samples by gel electrophoresis. Lane L,100 bp marker; Lane P, positive control; Lane N, negative control; Lanes 1, 2, 3, 4, 5, 6, 7, 8, and 9, positive tap water samples for HAdV.
Statistical analysis
All statistical analyses were performed using R software (version 4.4.1). The impact of seasonality on the prevalence of each virus was assessed using Fisher’s exact test.
To determine whether the prevalence was influenced by physicochemical parameters (temperature, pH, dissolved oxygen, conductivity, and turbidity), Mann–Whitney tests were conducted to compare the distribution of each parameter between virus-positive and virus-negative samples.
RESULTS
Physicochemical parameters of water samples
The physicochemical properties of the majority of water samples collected across a year demonstrated overall stability, except for temperature and conductivity. Recorded pH averaged 7.53 ± 0.25 (7.03–8.01), indicating near-neutral to slightly alkaline conditions. Water temperature averaged 20.70°C ± 5.55°C (11.5 °C–37 °C), reflecting seasonal variation. The average electrical conductivity was 940.62 ± 419.22 μS/cm. The high variation may reflect a large variability between samples, likely due to seasonal variation and water supply interruptions during the sampling period. Dissolved oxygen (DO) levels averaged 8.76 ± 0.20 mg/L. Turbidity values remained low in all samples, with a mean value of 1.03 ± 0.53 nephelometric turbidity unit (NTU), pointing to limited particulate matter and overall water clarity (Table 2).
Study limitations
This study has a few limitations. First, the viral concentration in the samples could not be determined, as quantitative standards were not included, and the limit of detection of the method has not yet been established. In addition, the detection relied on molecular assays, which indicate the presence of viral genomes but do not confirm infectivity. Finally, the sampling strategy may not fully capture the spatial and temporal variability of viral contamination.
Detection of enteric viruses in drinking water samples
PCR and RT-PCR analysis of 102 tap water samples revealed a high occurrence of enteric viruses throughout the year. HAdV was the most frequently detected, with a prevalence of 92.15% (94/102), followed by HNoV-GII at 48.03% (49/102) and RVA at 43.13% (44/102). Notably, NoV-GI was not detected in any of the samples throughout the year. A total of 31.37% (32/102) of the samples were simultaneously positive for all three viruses tested (HAdV, HNoV-GII, and RVA); 10.78% (11/102) were co-positive for HAdV and HNoV-GII; 5.88% (6/102) were co-positive for HNoV-GII and RVA; and 4.90% (5/102) were co-positive for HAdV and RVA (Table 3). All positive samples detected by real-time PCR and RT-PCR were subjected to gel electrophoresis analysis. This method confirmed the results by clearly visualizing the migrated DNA fragments, validating the presence of the viral genome.
The distribution of positive water samples varied by season (Table 4). HAdV was detected consistently throughout the year, indicating a persistent environmental presence independent of seasonal variation. Lower mean Cq values in winter (28.91 ± 1.20) and spring (29.26 ± 4.54) suggest higher viral loads during these periods. In contrast, HNoV-GII and RVA displayed clear seasonality, with the highest detection rates observed in winter (28.82 ± 2.42 and 30.31 ± 1.11, respectively) and spring (25.63 ± 1.74 and 29.50 ± 0.91), and complete absence in autumn. However, the Cq values for RVA remained relatively stable across seasons, indicating that viral concentrations, when present, were relatively consistent. These findings highlighted the seasonal dynamics of HNoV-GII and RVA, in contrast to the more constant year-round detection of HAdV, which may reflect differences in environmental stability or transmission routes.
The influence of seasonality on the presence of viruses was analyzed between February 2024 and February 2025, using the exact Fisher’s test. No significant seasonal effect was observed for HAdV (P = 0.1267). In contrast, a statistically significant association was found between seasonality and the presence of Hu-NoV-GII and RVA (P < 0.0001).
The Mann–Whitney test revealed a significant association between certain physicochemical parameters and the presence of the investigated viruses (Table 5). Temperature significantly affected the presence of all three viruses (P < 0.05). Additionally, pH influenced the presence of RVA (P < 0.05) but had no effect on HAdV or HNoV-GII. Conductivity was also significantly associated with the detection of both HNoV-GII and RVA (P < 0.001), unlike HAdV. In contrast, no statistically significant associations were detected between turbidity or dissolved oxygen and the presence of any of the three viruses (P > 0.05).
DISCUSSION
Surface waters used for drinking water production may contain human pathogenic viruses, which may affect the quality of water intended for consumption. In this study, we evaluated the quality of tap water distributed in Marrakech, Morocco. This is the first report on the presence of HAdV, HNoV GI/HNoV GII, and RVA in tap water, the main source of drinking water in the city. At least one virus was detected in 99% of the analyzed samples. Such results were higher than those generally reported in previous studies (14, 23, 27).
In the literature, few investigations have focused specifically on tap water, although in most works, the term “treated drinking water” consistently refers to potable water that has undergone full treatment at the drinking water treatment plant and is subsequently distributed to households through the municipal network (i.e., tap water). This corresponds exactly to the type of water analyzed in our study. Reported prevalence worldwide nevertheless varies considerably.
For instance, for HAdV, our detection rate, which reached 92.15%, was in the same range as that observed in China, where 100% (24/24) of treated drinking water samples collected from six treatment plants were positive (34). In contrast, in other African countries such as Egypt, a lower prevalence was reported (33%, 8/24) in treated water samples (35), and only (8.9%, 16/1,800) in tap water samples (36). In other countries, such as Pakistan, AdV was reported in 38.94% of drinking water samples (37/95) (37) and 20% of treated water (6/30) (19).
Regarding HNoV-GII, our detection rate of 48.03% was lower than or comparable to that reported in certain countries such as Japan, where rates ranged from 48% to 81% during epidemic periods and from 10% to 24% outside these periods in samples from drinking water treatment plants (38). However, it was higher than those reported in other countries, such as Italy (20%, 1/5) (39), Brazil (7.7%, 2/26) (40), and Slovenia (0/89) (41).
Similarly, the non-detection of HNoV-GI has been reported in several studies on drinking water, such as that in reference 42. This may partly explain the lack of research on this genogroup in these matrices, especially when compared to genogroup II.
Regarding RVA, our study revealed a detection rate of 43.13%, which remained lower than those observed in other geographical contexts. In Japan, for example, rates ranged from 76% to 86% during epidemic periods, and from 67% to 81% during non-epidemic periods in samples collected from drinking water treatment plants (38). In China, 100% of treated water samples collected from six treatment plants tested positive (34). Conversely, lower rates have been reported in other countries: 23% in treated water in Pakistan (7/30) (19), 15.6% in tap water in Egypt (28/100) (36), 7.14% in drinking water in Saudi Arabia (1/14) (43), and only 0.54% in Thailand, also in tap water (2/370) (44).
The variability in virus prevalence rates in water can be attributed to a combination of environmental and social factors, viral structure characteristics, and differences in the technical methods used for water sampling, concentration, and virus detection. Climatic conditions, particularly precipitation, promote the mobilization of fecal contaminants in watersheds, increasing surface water contamination (45). Elevated water flow during these periods may also facilitate the transport of viruses, thereby increasing their detection rates (46). Some enteric viruses, such as Hu-NoV-GII and RVA, exhibit strong seasonal dynamics, with higher prevalence in winter and spring, while HAdV is detected consistently throughout the year due to its environmental stability across a wide range of temperatures (47). Socio-geographical factors, including population density, hygiene practices, and the state of infrastructure, further influence virus prevalence. In developing countries, rapid population growth and inadequate drainage systems exacerbate contamination risks, especially during the rainy season (48).
In addition to environmental and social parameters, differences in technical procedures can also contribute to variability across studies. Reference 45 highlighted that factors such as water quality and sample volume significantly affect recovery and detection efficiency. Physicochemical properties of viruses, including their isoelectric point, influence adsorption behavior and recovery rates. Moreover, reference 49 highlighted the importance of interactions between the virus type and the water matrix, suggesting that factors affecting virus recovery, such as pH during concentration, should be carefully adjusted to optimize detection. As a result, differences in sampling strategies, concentration protocols, and detection methods (e.g., sensitivity of molecular assays) can contribute to variability and discrepancies observed between studies.
The high prevalence of these viruses in tap water in Marrakech could be explained by several interdependent factors. First, this frequent detection was likely due to persistent water contamination, suggesting insufficient water treatment, particularly during the disinfection stage. This stage relies on chlorination for its bactericidal effect, but enteric viruses are more resistant to chlorine inactivation (1). Nevertheless, some studies have demonstrated the effectiveness of combined water treatment systems, which included polypropylene yarn filtration, granular activated carbon, and ultraviolet post-treatment (19). In addition to the quality of water treatment at pumping stations, the water supply system could also be a contributing factor. Leaks in pipes or defective water tanks can provide additional sources of contamination (19). Moreover, rapid population growth and a lack of urban planning place considerable pressure on drainage systems, especially during the rainy season, increasing the risk of surface water contamination (48).
Furthermore, our previous study on the prevalence of parasites in tap water in Marrakech between October 2016 and January 2018 has revealed an overall contamination rate of 67.3% (70/104) for protozoa, with 35 samples positive for Giardia duodenalis, 18 for Toxoplasma gondii, and 17 for both parasites (50). Our findings highlighted the contamination of water, often of fecal origin, from human or animal sources, indicating the presence of viruses and parasites in drinking water.
Our study revealed a significant seasonal effect on the presence of HNoV-GII and RVA, with higher detection rates in winter and spring, whereas HAdV was consistently detected throughout the year. The increased prevalence of HNoV-GII and RVA during colder months may be explained by the well-documented influence of temperature on viral persistence, as lower temperatures slow viral degradation and enhance environmental stability (51, 52). In contrast, the constant detection of HAdV aligns with its strong environmental resilience, which enables it to remain stable across a broad temperature range (47), a pattern also reported in other studies showing no seasonal variation in HAdV prevalence (51, 52).
Temperature is widely recognized as a major determinant of viral inactivation in the environment (53). High temperatures can alter viral proteins or nucleic acids, accelerating inactivation, while the extent of this effect depends on virus-specific thermal sensitivities and the physicochemical characteristics of the water matrix. These combined factors likely contribute to the observed differences between viruses in their seasonal detection patterns.
pH also played a role in our findings, but its effect was limited to RVA. Viral detection in this study relied on nucleic acid-based assays, meaning that measured “presence” reflects genetic material rather than infectious viral particles. RVA detection was significantly influenced by pH values between 7.03 and 8.01, which is consistent with studies showing that rotaviruses can remain stable in neutral to slightly alkaline conditions, while extreme pH values can inactivate the virus by altering structural proteins (54, 55). This sensitivity may also be modulated by interactions with other water quality parameters, such as organic matter or ion content (56). Additionally, our concentration protocol, which involves pH reduction, addition of multivalent cations, and alkaline elution, may have contributed to variations in RVA recovery. In contrast, HAdV and HNoV-GII are known to withstand a wide pH range (57–59), which may explain the absence of a detectable pH effect and their higher prevalence in our samples. Furthermore, the observed inverse relationship between water conductivity and the detection of HNoV and RVA may be attributed to the physicochemical characteristics of these viruses. Both HNoV and RVA are non-enveloped viruses with capsid surface charges that are sensitive to environmental ionic strength. Studies have shown that HNoV virus-like particles possess isoelectric points (pI) around pH 5.0–6.0, and their net surface charge becomes more negative as the pH increases above the pI. At higher ionic strengths, the electrostatic repulsion between particles is screened, promoting aggregation and adsorption to surfaces, which can reduce their mobility and detectability in water samples (60). Similarly, RVA particles exhibit a negatively charged outer surface, which may enhance their propensity to aggregate or adhere to surfaces under conditions of elevated ionic strength (61).
In contrast, HAdV, particularly enteric types like HAdV-41, displays unique physicochemical properties that confer greater stability across varying ionic conditions. The capsid proteins of HAdV-41 have higher predicted pI values, with the short fiber protein exhibiting a pI of approximately 9.13, indicating a more positive surface charge at neutral pH. This positive charge may reduce the tendency of HAdV-41 to aggregate or adsorb to negatively charged surfaces in high-conductivity environments, thereby maintaining its detectability in water samples (62).
In our study, the mean turbidity of positive and negative samples was approximately 1 NTU, which represents a narrow range of turbidity values. Although higher turbidity levels were typically associated with increased concentrations of organic matter and suspended particles that can adsorb viral particles, potentially affecting their persistence in water (63), the low turbidity variation in our samples may have masked any potential effects.
These combined factors explain the high prevalence of viral contamination in tap water in Marrakech, thus highlighting the public health challenges associated with managing drinking water in rapidly growing urban environments.
To complement molecular detection of viral genetic material, future studies should incorporate methods capable of assessing the actual infectivity of viruses in water. Although PCR and quantitative PCR are widely used due to their speed, sensitivity, and ability to detect viruses that are difficult to culture (64, 65), these approaches do not distinguish infectious from inactivated particles, limiting the accurate assessment of public health risk (66). Recent advances, such as digital PCR, provide absolute quantification and greater tolerance to inhibitors commonly present in environmental samples (67), yet they remain insufficient for evaluating infectivity. Integrated approaches combining cell culture and molecular amplification, such as ICC-PCR, allow for the specific detection of replicating viruses and overcome the limitations of purely culture-based methods (68–70). Additional techniques, including the detection of viral replication intermediates or enzymatic/chemical treatment of viral capsids prior to RT-PCR, can further refine assessments of infectivity (71).
Moreover, expanding sampling across multiple points within the water distribution network would provide a more comprehensive characterization of spatial contamination patterns and a representative assessment of overall water quality. Such an approach would enhance the relevance and applicability of the findings for informed water management and public health interventions.
Conclusion
Regular surveillance of enteric viruses in drinking water is a critical component in the prevention of waterborne viral infections and potential epidemics. The results of this study highlighted a concerning level of viral contamination, underscoring the need for additional research focusing on viral viability, infectivity, and genotypic diversity to accurately evaluate the health risks faced by exposed populations. Given the potential for exposure through contaminated water, it is imperative to reinforce both treatment protocols and quality control measures throughout the water distribution process.
The reference list from the paper itself. Each links out to its DOI / PubMed record.
- 1WHO. 2022. Guidelines for drinking-water quality
- 2Craun GF, Brunkard JM, Yoder JS, Roberts VA, Carpenter J, Wade T, Calderon RL, Roberts JM, Beach MJ, Roy SL. 2010. Causes of outbreaks associated with drinking water in the United States from 1971 to 2006. Clin Microbiol Rev 23:507–528. doi:10.1128/CMR.00077-0920610821 PMC 2901654 · doi ↗ · pubmed ↗
- 3Granado AM, Martínez MC, Frías A T,V, Banegas O, Sánchez EV. 2008. Red Nacional de Vigilancia epidemiológica. Vigilancia epidemiológica de brotes de transmisión hídrica en españa. 1999-2006. Bol epidemiol Semanal 16
- 4Jiang SC. 2006. Human adenoviruses in water: occurrence and health implications: a critical review. Environ Sci Technol 40:7132–7140. doi:10.1021/es 060892 o 17180959 · doi ↗ · pubmed ↗
- 5Glass RI, Parashar UD, Estes MK. 2009. Norovirus gastroenteritis. N Engl J Med 361:1776–1785. doi:10.1056/NEJ Mra 080457519864676 PMC 3880795 · doi ↗ · pubmed ↗
- 6Parashar UD, Gibson CJ, Bresee JS, Glass RI. 2006. Rotavirus and severe childhood diarrhea. Emerg Infect Dis 12:304–306. doi:10.3201/eid 1202.05000616494759 PMC 3373114 · doi ↗ · pubmed ↗
- 7Sanchez-Padilla E, Grais RF, Guerin PJ, Steele AD, Burny M-E, Luquero FJ. 2009. Burden of disease and circulating serotypes of rotavirus infection in sub-Saharan Africa: systematic review and meta-analysis. Lancet Infect Dis 9:567–576. doi:10.1016/S 1473-3099(09)70179-319695493 · doi ↗ · pubmed ↗
- 8Benhafid M, Rguig A, Trivedi T, Elqazoui M, Teleb N, Mouane N, Maltouf AF, Parashar U, Patel M, Aouad RE. 2012. Monitoring of rotavirus vaccination in Morocco: establishing the baseline burden of rotavirus disease. Vaccine (Auckl) 30:6515–6520. doi:10.1016/j.vaccine.2012.08.05822959990 · doi ↗ · pubmed ↗