Effects of task-oriented circuit class training on walking ability after stroke: a meta-analysis
Lin Chen, Xiuli Wei, Shenshen Zheng

TL;DR
Task-oriented circuit class training improves walking ability after stroke, with better results when training is more frequent or longer.
Contribution
A meta-analysis showing specific benefits of task-oriented CCT on gait outcomes in stroke patients.
Findings
Task-oriented CCT significantly improves 6-min walk distance, gait speed, and Timed Up-and-Go test performance.
Higher training frequency (≥3 times/week) benefits patients within 3 months post-stroke.
Longer session duration (≥1 hour) improves outcomes in patients more than 3 months post-stroke.
Abstract
Task-oriented circuit class training (CCT) is increasingly used in the rehabilitation of post-stroke gait dysfunction; however, current research findings remain inconsistent. This study aimed to further investigate its therapeutic efficacy. Randomized controlled trials (RCTs) evaluating task-oriented CCT in stroke patients were identified through a systematic search of PubMed, the Cochrane Library, and EMBASE, covering the period from database inception to February 25, 2025. Studies were included if they assessed lower limb functional outcomes. Only publications in English were considered. Two independent reviewers conducted literature screening, data extraction, and risk-of-bias assessment. Meta-analysis was performed using Review Manager 5.4 and Stata 18.0 software. Twelve RCTs comprising 652 patients were included. Meta-analysis demonstrated significant, homogeneous effect sizes in…
Genes, proteins, chemicals, diseases, species, mutations and cell lines named across the full text — each resolved to its canonical identifier and authoritative record.
Click any figure to enlarge with its caption.
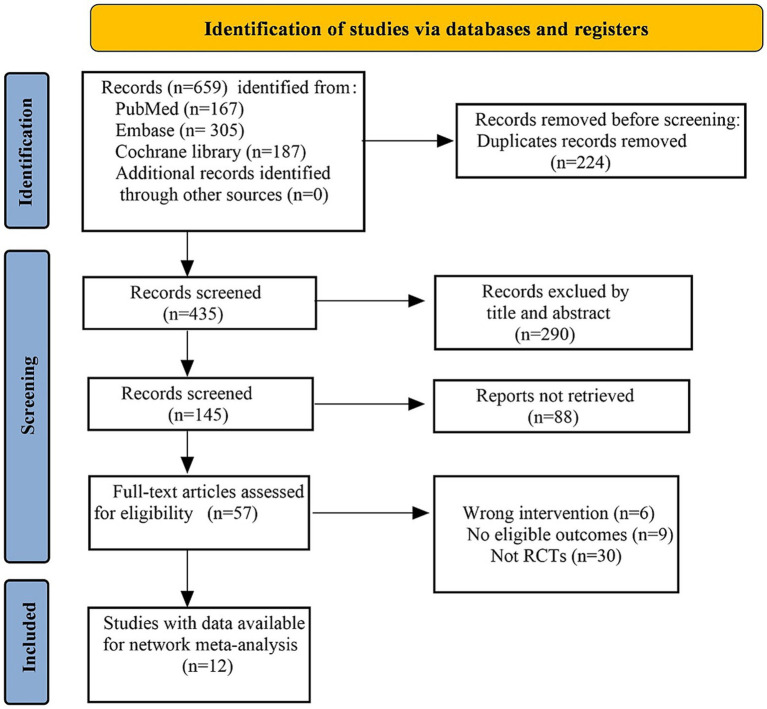 Figure 1
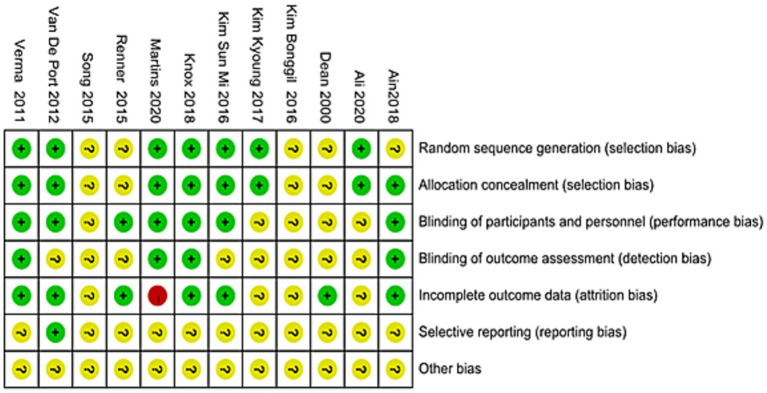 Figure 2
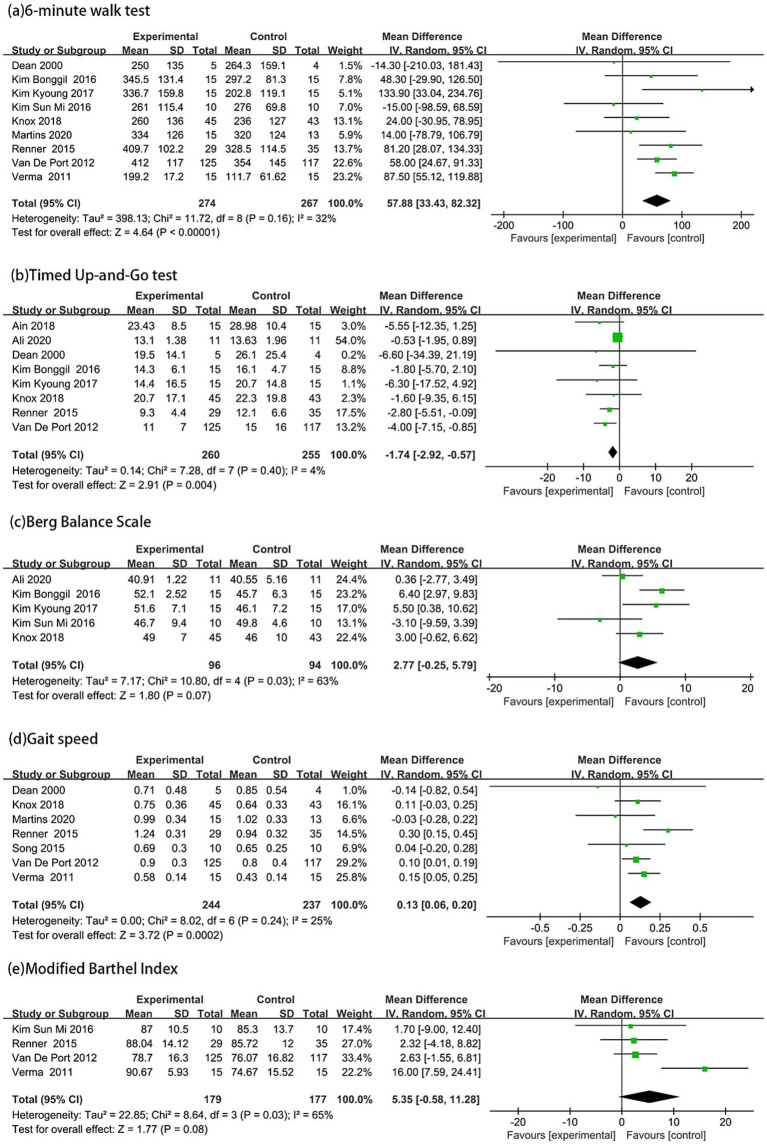 Figure 3
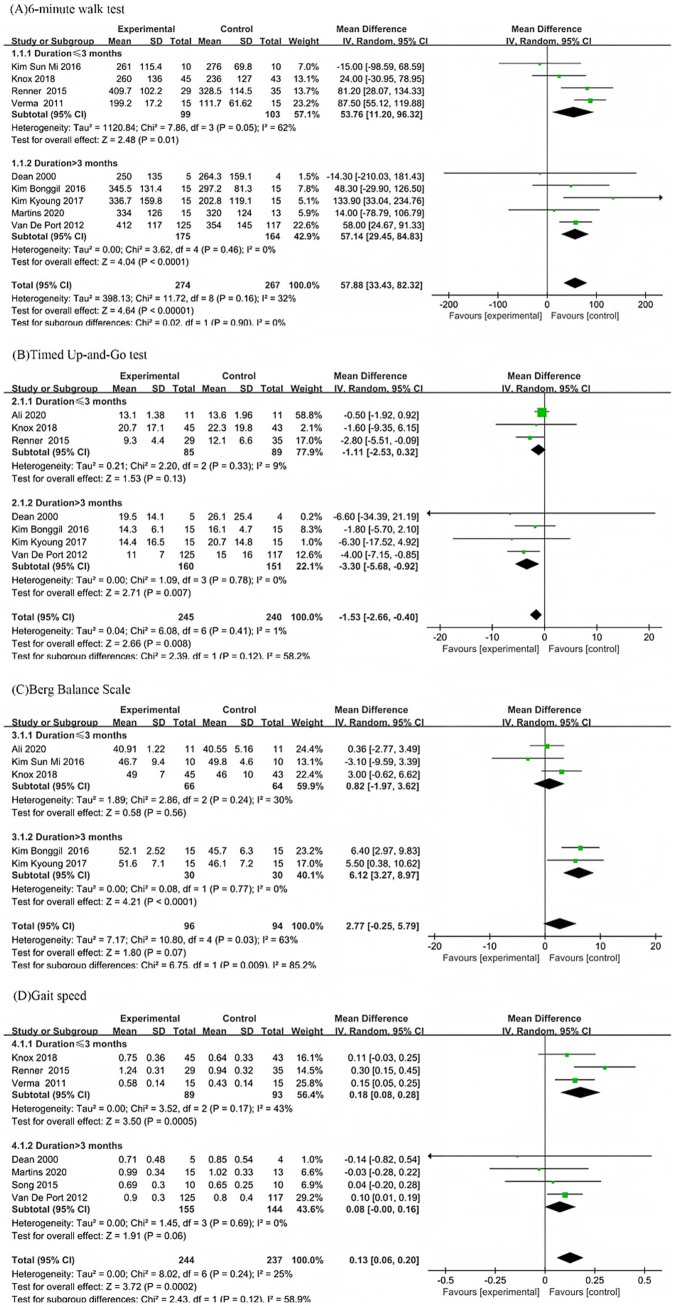 Figure 4
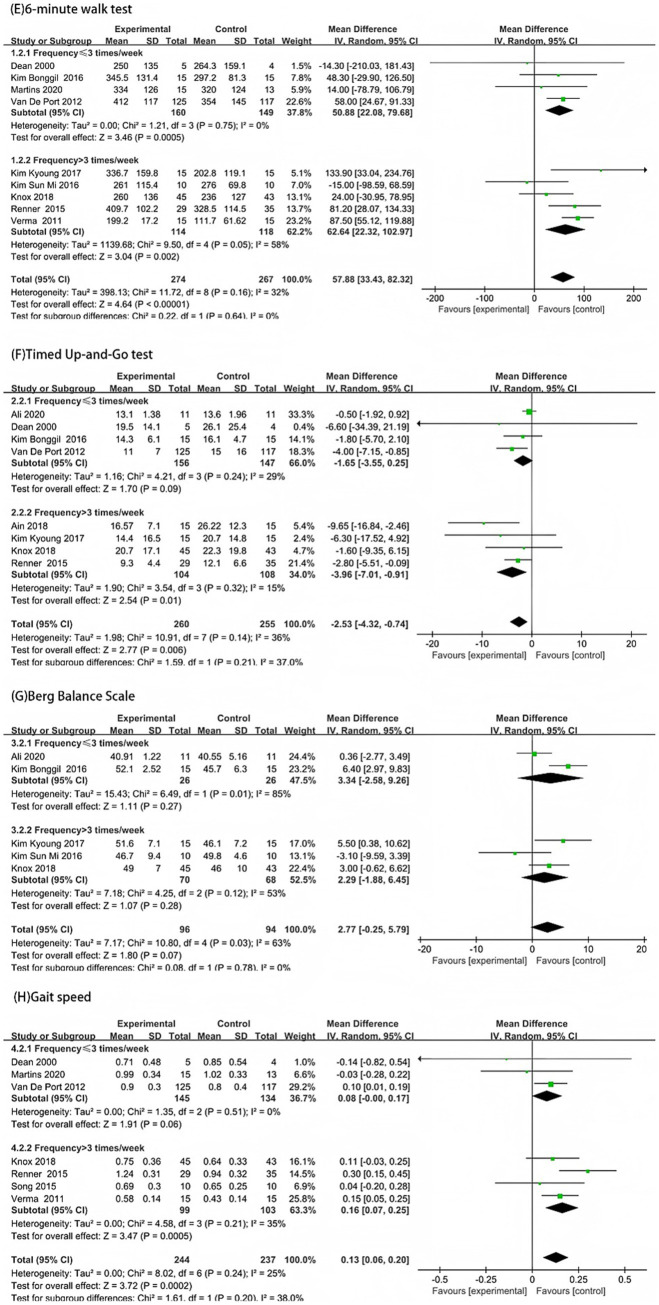 Figure 5
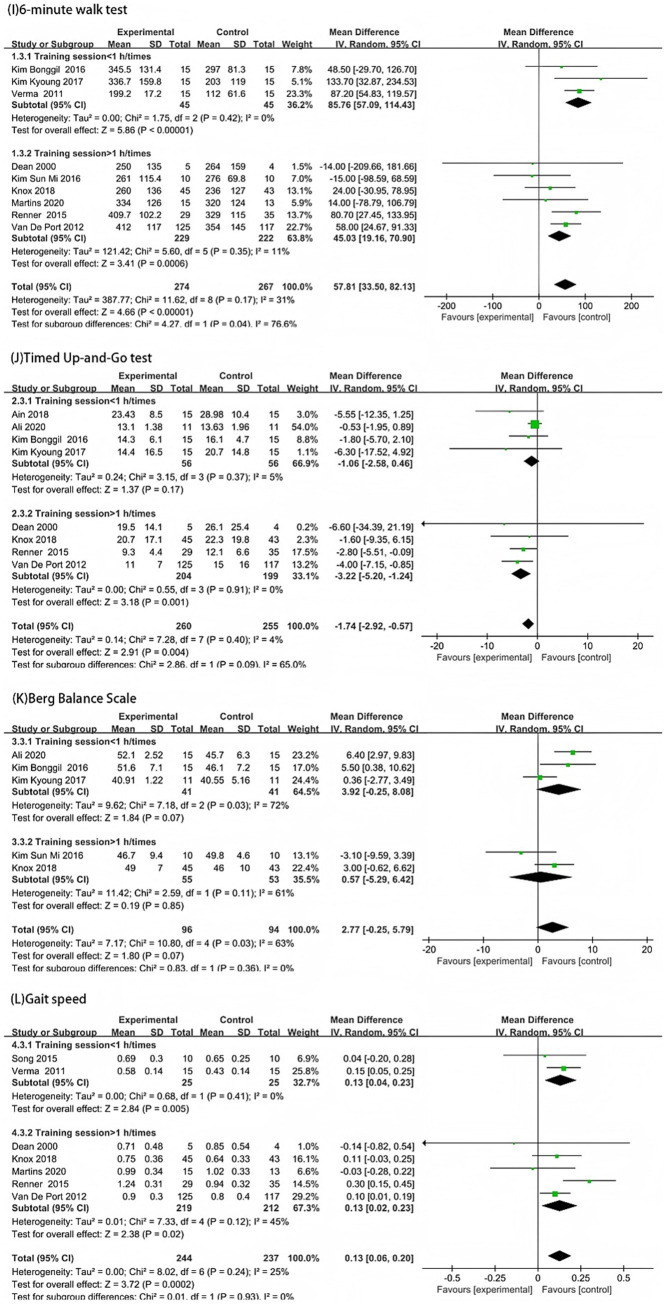 Figure 6
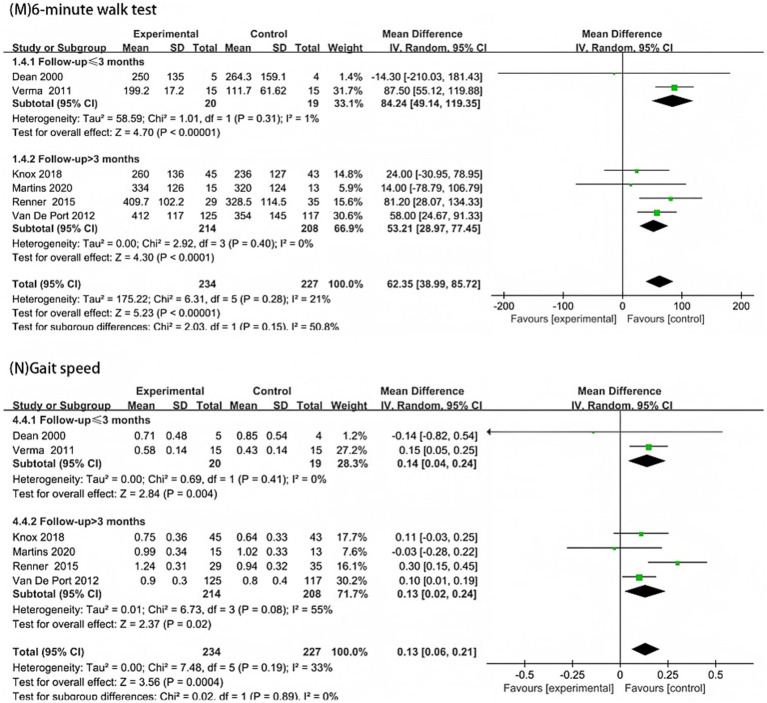 Figure 7
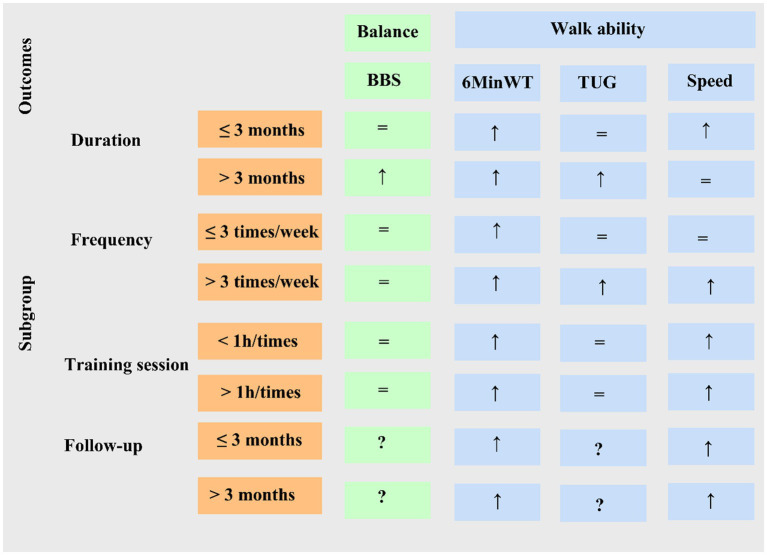 Figure 8
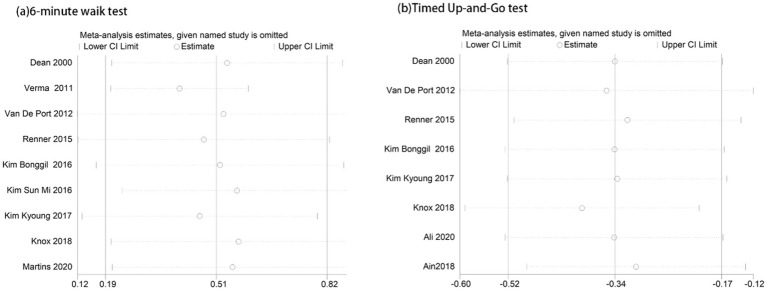 Figure 9
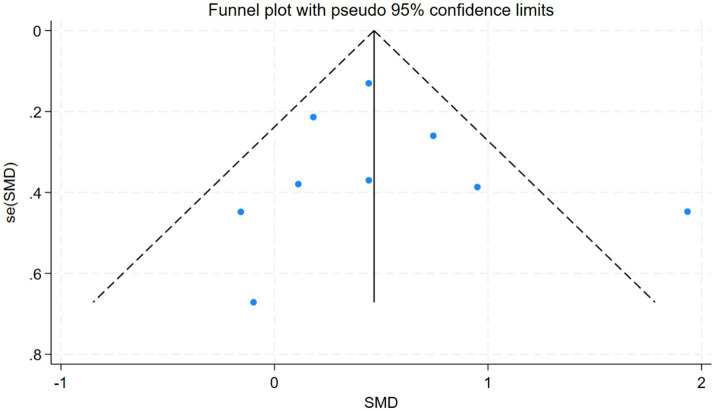 Figure 10
| No. | First author, year | Treatment group | Control group | ||||||||||||
|---|---|---|---|---|---|---|---|---|---|---|---|---|---|---|---|
|
| (M/F) | Age (years) | Stroke side (L/R) | Stroke type (H/I) | Duration | N | (M/F) | Age (years) | Stroke side (L/R) | Stroke type (H/I) | Duration | Follow-up | Outcomes | ||
| 1 | Dean et al. (2000) ( | 6 | 3/3 | 68.8 ± 4.7 | 3/3 | NR | 2.1 ± 0.5 y | 6 | 4/2 | 64.8 ± 3.3 | 2/4 | NR | 1.7 ± 0.9 y | 8 W | ②④⑤ |
| 2 | Verma et al. (2011) ( | 15 | 10/5 | 53.27 ± 8.5 | 7/8 | 3/12 | 6.07 ± 3.30 w | 15 | 12/3 | 55.07 ± 6.8 | 8/7 | 4/11 | 6.60 ± 3.20 w | 6 W | ①②⑤ |
| 3 | van de Port (2012) ( | 126 | 82/65 | 56 ± 10 | NR | 23/103 | 91 ± 42 d | 124 | 80/44 | 58 ± 10 | NR | 24/100 | 103 ± 51 d | 24 W | ①②④⑤ |
| 4 | Song et al. (2015) ( | 10 | NR | 59.28 ± 5.2 | NR | NR | 27.66 ± 19.35 m | 10 | NR | 64.10 ± 8.6 | NR | NR | 30.70 ± 14.68 m | No | ⑤ |
| 5 | Renner et al. (2015) ( | 34 | 22/12 | 56 ± 10 | 19/15 | 12/22 | 39 ± 25 d | 39 | 29/10 | 55 ± 10 | 17/22 | 8/31 | 32 ± 11 d | 24 W | ①②④⑤ |
| 6 | Kim et al. (2016) ( | 15 | 8/7 | 50 ± 9.5 | NR | NR | ≥6 months | 15 | 10/5 | 54 ± 7.1 | NR | NR | ≥6 months | No | ②③④ |
| 7 | Kim et al. (2016) ( | 10 | 6/4 | 65.6 ± 9.2 | 6/4 | 2/8 | ≤3 months | 10 | 7/3 | 65.6 ± 9.2 | 5/5 | 2/8 | ≤3 months | No | ①②③ |
| 8 | Kim et al (2017) ( | 15 | 10/5 | 57.3 ± 12.3 | 8/7 | 9/6 | 3.3 ± 1.3 m | 15 | 9/6 | 54.0 ± 11.8 | 10/5 | 8/7 | 4.4 ± 1.6 m | No | ②③④ |
| 9 | Knox et al. (2018) ( | 51 | 25/26 | 51 ± 15 | 26/25 | NR | 10 ± 8 w | 48 | 28/26 | 48 ± 14 | 25/23 | NR | 8 ± 7 w | 24 W | ②③④⑤ |
| 10 | Ain et al. (2018) ( | 15 | 8/7 | 52.26 ± 10.1 | 8/7 | 5/10 | NR | 15 | 8/7 | 54.10 ± 10.1 | 7/8 | 5/10 | NR | No | ④ |
| 11 | Ali et al. (2020) ( | 11 | 7/4 | 50–70 | 4/7 | 4/7 | ≤3 months | 11 | 6/5 | 50–70 | 7/4 | 2/9 | ≤3 months | No | ③④ |
| 12 | Martins et al. (2020) ( | 18 | 8/10 | 56 ± 17 | 8/10 | NR | ≥6 months | 18 | 8/10 | 55 ± 13 | 9/9 | NR | ≥6 months | 16 W | ②⑤ |
| No. | Study (year of publication) | Patients per group | No. of therapists attending | Intensity (I) | Workstations applied in the experimental group (E), |
|---|---|---|---|---|---|
| 1 | Dean (2000) ( | 6 | 2 physiotherapists | I: 4 weeks; 3 times a week; 60 min | E: (1) Sitting at a table and reaching in different directions for objects located beyond arm’s length to promote loading of the affected leg and activation of affected leg muscles; |
| 2 | Verma et al. (2011) ( | ≤4 | 1 physiotherapist | I: 2 weeks; 7 times a week; 40 min | E:(1) Balance control; |
| 3 | van de Port (2012) ( | 2 | 1 physiotherapist | I: 12 weeks; 2 times a week; 90 min | E:(1) Standing and reaching; |
| 4 | Song et al. (2015) ( | NR | 2 physiotherapists | I: 4 weeks; 5 times a week; 30 min | E: (1) Sitting in chair and walking; |
| 5 | Renner et al. (2015) ( | 2 | 1 physiotherapist or 1 sports therapists | I: 6 weeks; 5 times a week; 90 min | E: (1) Standing and reaching; |
| 6 | Kim et al. (2016) ( | 2–3 | 1 physiotherapist | I: 6 weeks; 3 times a week; 50 min | E:(1) Straight leg raise; |
| 7 | Kim et al. (2016) ( | ≥ 2 | 1 physiotherapist | I: 4 weeks; 5 times a week; 90 min | E: (1) Sit to stand; |
| 8 | Kim et al. (2017) ( | 2–3 | 2 physical therapists | I: 4 weeks; 5 times a week; 50 min | E: (1) Sit to stand; |
| 9 | Knox et al. (2018) ( | 4–6 | 1 physiotherapist | I: 12 weeks; 6 times; 90 min | E: (1) Improving strength; |
| 10 | Ain et al. (2018) ( | NR | 1 physiotherapist | I: 6 weeks; 4 times a week; 40–50 min | E: (1) walk; |
| 11 | Ali et al. (2020) ( | ≥ 2 | 1 physiotherapist | I:6 weeks; 3 times a week; 50 min | E: (1) Sit to Stand training; |
| 12 | Martins et al. (2020) ( | 2–6 | 1 physiotherapist | I: 12 weeks; 3 times a week; 60 min | E: (1) Reaching; |
Peer Reviews
No public reviews on file for this paper yet. If you reviewed it on a platform where reviews are public (OpenReview, ICLR, NeurIPS, ICML), you can paste yours below so the community can read it here.
Videos
No videos yet. Explain this paper in a talk, walkthrough, or lecture? Add one.
Taxonomy
TopicsStroke Rehabilitation and Recovery · Balance, Gait, and Falls Prevention · Motor Control and Adaptation
Introduction
1
The most recent epidemiological studies on stroke indicate that among non-communicable diseases (NCDs), stroke ranks as the third-leading cause of death and disability worldwide, measured by disability-adjusted life years lost (DALYs), exceeding 160 million DALYs annually (1). The World Stroke Organization/Lancet Neurology Stroke Commission projects that by 2050, the global number of stroke survivors will surpass 200 million, with annual DALYs approaching 300 million (2). Stroke is the leading cause of long-term neurological disability worldwide (3).
About 80% of stroke survivors experience walking problems (4), and achieving safe, independent, effective, and efficient walking is a top priority for improving their quality of life (5). About 75% of patients consider the capacity to engage in community activities is importance (6). Nevertheless, about one-quarter of stroke survivors cannot walk independently within 3 months post-stroke (7). Persistent gait abnormalities, including reduced gait speed and endurance, combined with not enough rehabilitation intensity, significantly limit ability recovery after stroke. Rehabilitation training plays a crucial role in improving limb ability, particularly about lower limb rehabilitation (8).
Task-oriented circuit class training (CCT) is a task-oriented intervention in which participants receive physical rehabilitation treatment in a group setting, typically with at least two participants per therapist (9). The program emphasizes repetitive practice of numerous function- and activity-related tasks under the supervision of a physical therapist (10). Based on current knowledge in neuroscience and stroke research, effective recovery requires task-specific practice, sufficient repetition, and high-intensity training sessions (11, 12). Kelly et al. (13) developed a task-oriented circuit training program termed intermittent functional training (IFT) and compared its initial effects with those of constant-load endurance treadmill training (CET). Their findings indicated that task-oriented circuit training enables individuals with chronic hemiparetic stroke to sustain comparable levels of aerobic exercise intensity during training relative to conventional force-measured exercise protocols. Similar to individual training, task-oriented CCT is equally effective in improving balance and ambulation (14). In a large randomized controlled trial (RCT) involving 250 patients, the intervention group underwent 12 weeks of task-oriented CCT, while the control group underwent 12 weeks conventional physical therapy. At 12 weeks, the intervention group demonstrated significantly greater improvements in gait speed and walking distance than the control group (15). In addition, growing evidence suggests that intensive, task-oriented practice can produce greater improvement in walking competency than usual practice (10, 16, 17).
A 2017 systematic review published in the Cochrane Database of Systematic Reviews analyzed 17 randomized controlled trials encompassing 1,297 participants, comparing circuit training rehabilitation with conventional care or sham interventions. The review provided moderate-quality evidence that circuit training is more effective than alternative approaches in improving walking distance, independent ambulation, gait speed, and, to some extent, balance confidence and postural stability. Notably, benefits were observed regardless of time since stroke onset—patients more than 1 year post-stroke experienced improvements comparable to those within the first year, indicating that functional gains may extend well beyond the early recovery period (9). However, the review did not evaluate the impact of stroke type, severity, specific circuit training protocols, or training intensity on outcomes. Given the growing global burden of stroke and recent advances in neurorehabilitation, a comprehensive update of the current evidence is warranted to address these unresolved issues. In this study, we conducted a meta-analysis to assess the efficacy and safety of task-oriented CCT on lower limb ability post-stroke.
Methods
2
Study registration
2.1
This review adhered to the Preferred Reporting Items for Systematic Reviews and Meta-Analyses (PRISMA) and Cochrane Collaboration guidelines for conducting and reporting systematic reviews and network meta-analyses (NMAs) (Appendix 1) (18). The protocol for this research was previously registered with PROSPERO (registration number CRD420250652683).
Search strategy
2.2
A systematic literature search was conducted in PubMed, Embase, and the Cochrane Central Register of Controlled Trials from inception to February 25, 2025, focusing on group circuit training for lower limb rehabilitation in stroke patients. The following medical subject headings (MeSH) and keywords were used: “stroke,” “cerebrovascular accident,” “cerebrovascular disease,” “hemiplegia,” “paresis,” “brain injuries,” “circulatory training,” “circulatory courses,” “exercise,” “task-oriented,” “gait,” “walking,” “lower limb,” and randomized controlled trials (“RCTs” OR “trial” OR “trials”). The detailed search strategy is provided in Appendix 2. Additionally, references from review articles, empirical studies, and conference abstracts were screened. References of the retrieved articles were also reviewed to identify other relevant trials meeting the inclusion criteria. All searches were limited to RCTs conducted in humans.
Inclusion and exclusion criteria
2.3
Studies were eligible for inclusion if they met the following criteria: (1) Study subjects: adult stroke patients (≥18 years) as defined by the World Health Organization, with lower limb functional impairments, capable of walking at least 10 meters with or without assistive devices (functional ambulation category ≥2); randomized clinical trials must have evaluated task-oriented interventions targeting the lower extremities in a group setting, with at least one outcome related to gait. (2) Types of studies: RCTs published in English with extractable outcome data. (3) Intervention measures: the experimental group received task-oriented CCT focusing on the lower limbs with at least two participants per group, while the control group received one-to-one traditional training or no treatment or other forms of treatment. Studies were excluded if: (1) the intervention included additional therapeutic approaches, such as motor imagery or mirror therapy; (2) the outcomes were unrelated to lower limb function or data were incomplete; (3) the publication was a review, conference proceeding, experience report, or case study; or (4) the study was a duplicate publication.
Study selection and data extraction
2.4
Two independent reviewers (Xiuli Wei and Lin Chen), blinded to study details, used Endnote software to perform systematic screening, including title and abstract review followed by full-text assessment. Discrepancies identified during the title/abstract screening were advanced to full-text review, and disagreements during full-text review were resolved through consensus. Extracted data included author, publication year, allocation concealment method, random sequence generation technique, blinding procedures, sample sizes for both experimental and control groups, intervention and control details, study characteristics, follow-up duration, and functional outcome scores. The Cochrane Risk of Bias Tool version 2.0 (19) was employed to assess study quality, evaluating random sequence generation, allocation concealment, blinding of participants/personnel, blinding of outcome assessment, incomplete outcome data, selective reporting, and other potential biases. Studies were categorized as having low, moderate, or high risk of bias based on the Cochrane Risk of Bias 2.0 guidance. The primary outcomes were the 6-min walking test distance and the Timed Up-and-Go test score. Secondary outcomes included the Berg Balance Scale, gait speed, and the Modified Barthel Index. Data were extracted for measurements taken before, during, and after treatment.
Data analysis
2.5
Literature quality assessment
2.5.1
Review Manager 5.4 was used for conventional meta-analysis, and forest plots were generated. All outcome measures were continuous variables, effect estimates were presented as mean differences (MD) and 95% confidence intervals (CIs). Statistical heterogeneity was assessed using the chi-squared test and I^2^ statistic. Heterogeneity across studies with different outcome measures was quantitatively assessed using the I^2^ statistic. An I^2^ ≤ 50% and a p ≥ 0.1 were interpreted as indicating low heterogeneity, in which case a fixed-effect model was applied for analysis; otherwise, a random-effects model was employed. Subgroup and sensitivity analyses were conducted to explore potential sources of heterogeneity.
Sensitivity analysis
2.5.2
Sensitivity analysis was further used to evaluate the influence of individual studies on the overall effect estimate and to assess the robustness of the pooled effect size (20, 21).
Publication bias
2.5.3
To evaluate potential publication bias in the study outcomes, we generated funnel plots using Stata 18.0 software. Visual inspection of funnel plot symmetry was used to judge the presence of publication bias: approximate symmetry suggested no substantial publication bias, whereas asymmetry indicated a possible risk of bias (22). Due to expected variability in study design, outcome measures, and sample sizes, a random-effects model was applied. Analysis of publication bias in the 6-min walking test score in this study.
Subgroup analysis
2.5.4
To investigate the effects of task oriented CCT on outcome indicators and evaluate its long-term efficacy, subgroup analysis was conducted on disease duration, weekly training frequency, single training time, and follow-up time, and these results can be obtained from the study.
Results
3
Results of studies selection
3.1
A total of 659 studies were initially identified. After removing duplicate publications, 435 studies remained for further screening. Following evaluation of titles and abstracts, an additional 290 studies that failed to meet the inclusion criteria were excluded. Among the remaining 145 studies, conference abstracts and clinical trial registrations were further excluded. A total of 57 full texts were evaluated for eligibility. Among them, 30 were excluded as non-RCTs, 6 due to intervention measures not meeting the pre-defined criteria, and 9 because of unidentifiable or incomplete outcome data. Ultimately, 12 RCTs were included in the final analysis (14–17, 23–30) (Figure 1).
Flow diagram of study selection.
Characteristics of included studies
3.2
The 12 included studies encompassed a total of 652 stroke patients, of whom 390 were male and 242 were female (a study (17) did not report the male-to-female ratio). Regarding age, 11 studies provided mean values and standard deviations, while one lacked precise data (30). A total of 326 cases were assigned to the experimental group and 326 to the control group for statistical analysis. The mean ± standard deviation of age was 55.3 ± 11.87 years in the experimental group and 55.79 ± 11.47 years in the control group, with no statistically significant difference between groups. Two articles included three control groups (18, 29), whereas the remaining 10 each had two control groups (15, 17, 24–28, 30, 31). Regarding stroke type, there were 121 cases of hemorrhagic stroke and 362 cases of ischemic infarction. Four studies did not specify stroke subtype (17, 24, 25, 28). Concerning hemiplegia laterality, 179 cases involved left-sided paralysis and 173 involved right-sided paralysis; however, three studies did not report this information (15, 17, 25). In terms of post-stroke intervention timing, five articles described interventions initiated within 3 months post-stroke (14, 27–30), while six reported interventions starting at 3 months or later (15–17, 24–26); one study did not specify the timing (23). Follow-up data were absent in six articles (17, 23, 25–27, 30) and available in the remaining six (14–16, 24, 28, 29), with a total of 434 cases followed up and 69 dropouts recorded. Among the studies with follow-up, two reported outcomes at 1–2 months (24, 30), and four provided 3-month follow-up data (15, 16, 28, 29). Outcome measures included the 6-min walk test (reported in 9 studies) (15, 16, 24–30), the BBS (5 studies) (14, 25–28), the Modified Barthel Index (MBI) (4 studies) (15, 27, 29, 30), the TUG test (8 studies) (14, 15, 23–26, 28, 29), and gait speed (7 studies) (15–17, 24, 28–30) recorded a comfortable walking speed of 10 meters without external support. None of the included studies reported on limb spasticity or adverse treatment reactions. Baseline activity levels showed no significant differences between the experimental and control groups across all studies. Detailed information is provided in Tables 1, 2.
Results of risk of bias
3.3
Among the 12 included studies, 7 described the random sequence generation method (14–16, 26–28, 30), indicating a low risk of selection bias, the remaining studies did not report the randomization procedure (17, 23–25, 29). Seven studies reported blinding of participants (15, 16, 23, 26–28, 30), whereas the others lacked clear descriptions (14, 17, 24, 25, 29). Four studies explicitly stated that outcome assessments were free from measurement bias (16, 23, 28, 30), while the remainder did not address this aspect (14, 15, 17, 24–27, 29). One study (16) showed a substantial reduction in end-stage cases, exceeding 20% of the original sample, and was therefore classified as high risk of attrition bias. The other studies did not provide adequate follow-up data (14, 17, 25, 26), leading to an unclear risk. None of the included studies provided adequate information to assess the presence of other potential sources of bias. Further details are presented in Figure 2.
Details of assessment result of risk of bias.
Outcomes
3.4
The primary outcome
3.4.1
Nine articles (15, 16, 24–30) used the 6-min walk test to assess walking distance. The experimental group walked an average of 57.88 meters farther than the control group (MD = 57.88, 95% CI: 33.43 to 82.32, p < 0.00001, I^2^ = 32%) (Figure 3A). The TUG test was measured in eight studies (14, 15, 23–26, 28, 29). The experimental group was 1.74 s faster than the control group (MD = −1.74, 95% CI: −2.92 to −0.57, p = 0.004, I^2^ = 4%) (Figure 3B).
Forest plot analysis of outcome measures across the following assessments: (a) 6-Minute Walk Test; (b) Timed Up-and-Go Test; (c) Berg Balance Scale; (d) Gait Speed; and (e) Modified Barthel Index.
The secondary outcome
3.4.2
Five articles (14, 25–28) used the BBS to assess balance ability. Showing a mean difference of 2.77 points in favor of the experimental group (MD = 2.77, 95% CI: 0.25 to 5.79, p = 0.07, I^2^ = 63%) (Figure 3C). Preferred comfortable gait speed was assessed in seven studies (15–17, 24, 28–30). With results indicating that the experimental group walked 0.13 m/s faster than controls (MD = 0.13, 95% CI: 0.06 to 0.20, p = 0.0002, I^2^ = 25%) (Figure 3D). The MBI was measured in four studies (15, 27, 29, 30). The experimental group scoring 5.35 points higher on average (MD = 5.35, 95% CI: 0.58 to 11.28, p = 0.08, I^2^ = 65%) (Figure 3E).
Subgroup outcomes
3.5
Subgroup analyses of different post-stroke durations
3.5.1
The subgroup analysis based on stroke duration showed that in the 6-min walk test, the experimental group performed better than the control group in both subgroups. In the subgroup with disease duration ≤3 months, heterogeneity was relatively high (MD = 53.76, I^2^ = 62%), while in the subgroup with disease duration > 3 months, heterogeneity was relatively low (MD = 57.14, I^2^ = 0%). There was no statistically significant difference in effect size between the two subgroups (p = 0.90) (Figure 4A). In the TUG test, in the subgroup with disease duration ≤3 months, there was no significant difference between the experimental group and the control group (MD = −1.11, p = 0.13, I^2^ = 9%). In the subgroup with disease duration > 3 months, the experimental group was on average 3.30 s faster than the control group, with a significant difference and low heterogeneity (MD = −3.3, p = 0.007, I^2^ = 0%). There was no statistically significant difference in effect size between the two subgroups (p = 0.12) (Figure 4B).
Forest plot subgroup analysis by time since stroke: (A) 6-Minute Walk Test; (B) Timed Up-and-Go Test; (C) Berg Balance Scale; and (D) Gait Speed.
In the BBS, in the subgroup with disease duration ≤3 months, there was no significant difference between the experimental group and the control group (MD = 0.82, p = 0.56, I^2^ = 30%). In the subgroup with disease duration > 3 months, the experimental group performed better than the control group (MD = 6.65, p < 0.0001, I^2^ = 0%). There was a statistically significant difference in effect size between the two subgroups (p = 0.009) (Figure 4C). In gait speed, in the subgroup with disease duration ≤3 months, the experimental group performed better than the control group with moderate heterogeneity (MD = 0.18, p = 0.0005, I^2^ = 43%). In the subgroup with disease duration > 3 months, there was no statistically significant difference between the experimental group and the control group (p = 0.06, I^2^ = 0%). There was no statistically significant difference in effect size between the two subgroups (p = 0.12) (Figure 4D).
Subgroup analyses of training frequency
3.5.2
The subgroup analysis based on training frequency showed that in the 6-min walk test, the experimental groups in both subgroups performed better than the control groups (p < 0.05). The high frequency group (>3 times/week) had a higher heterogeneity (MD = 62.64, I^2^ = 58%), while the low-frequency group (≤3 times/week) had a lower heterogeneity (MD = 50.88, I^2^ = 0%). There was no statistically significant difference in effect size between the two subgroups (p = 0.64) (Figure 5E). In the TUG test, there was no statistically significant difference between the experimental and control groups in the low-frequency group (≤3 times/week) (p = 0.09, I^2^ = 29%), while in the high-frequency group (>3 times/week), the experimental group performed better than the control group (p = 0.01, I^2^ = 15%). There was no statistically significant difference in effect size between the two subgroups (p = 0.21, I^2^ = 37%) (Figure 5F).
Forest plot subgroup analysis by training frequency: (E) 6-Minute Walk Test; (F) Timed Up-and-Go Test; (G) Berg Balance Scale; and (H) Gait Speed.
In the BBS, there was no statistically significant difference between the experimental and control groups in both subgroups (p < 0.05). There was no statistically significant difference in effect size between the two subgroups (p = 0.78) (Figure 5G). In gait speed, there was no statistically significant difference between the experimental and control groups in the low-frequency group (≤3 times/week) (p = 0.06). In the high-frequency group (>3 times/week), the experimental group performed significantly better than the control group (p = 0.0005, I^2^ = 35%). There was no statistically significant difference in effect size between the two subgroups (p = 0.20) (Figure 5H).
Subgroup analyses of single training time
3.5.3
The subgroup analysis based on single training session duration showed that in the 6-min walk test, the experimental groups in both subgroups performed better than the control groups (p < 0.05). The heterogeneity was lower in the short-duration training group (<1 h/session) (MD = 85.76, p < 0.00001, I^2^ = 0%), and lower in the long-duration training group (≥1 h/session) (MD = 45.03, p < 0.0006, I^2^ = 11%). The difference in effect size between the two subgroups was statistically significant (p = 0.04) (Figure 6I). In the TUG test, the difference between the experimental and control groups was not significant in the short-duration training group (<1 h/session) (p = 0.17, I^2^ = 5%). In the long-duration training group (≥1 h/session), the difference was significant (MD = −3.22, p = 0.001, I^2^ = 0%). The difference in effect size between the two subgroups was not statistically significant (p = 0.09) (Figure 6J).
Forest plot subgroup analysis by single-session training duration: (I) 6-Minute Walk Test; (J) Timed Up-and-Go Test; (K) Berg Balance Scale; and (L) Gait Speed.
In the Berg BBS, there was no statistically significant difference between the experimental and control groups in both subgroups (p > 0.05), and the difference in effect size between the two subgroups was also not statistically significant (p = 0.36) (6 K). In gait speed, the experimental groups in both subgroups performed better than the control groups (p < 0.05). The heterogeneity was lower in the short-duration training group (<1 h/session) (MD = 0.13, p = 0.005, I^2^ = 0%), and lower in the long-duration training group (≥1 h/session) (MD = 0.13, p = 0.02, I^2^ = 45%). The difference in effect size between the two subgroups was not statistically significant (p = 0.93) (Figure 6L).
Subgroup analyses of different duration of follow-up
3.5.4
The subgroup analysis based on follow-up duration showed that in the 6-min walk test, the experimental group performed better than the control group (p < 0.05), and the heterogeneity of both subgroups was relatively low (I^2^ < 50%). There was no statistically significant difference in effect size between the two subgroups (p = 0.15) (Figure 7M). About gait speed, the experimental group performed better than the control group (p < 0.05). The heterogeneity was low in the group with a follow-up time of ≤3 months (I^2^ = 0%), while it was high in the group with a follow-up time of > 3 months (I^2^ = 55%). There was no statistically significant difference in the effect size between the two subgroups (p = 0.89) (Figure 7N).
Forest plot subgroup analysis by follow-up duration: (M) 6-Minute Walk Test; and (N) Gait Speed.
Sensitivity analysis and publication bias
3.6
Subgroup analysis results are summarized (Figure 8). Due to the limited number of studies for each intervention, sensitiv¬ity analysis was performed only for the 6-min walk test and the TUG test to explore the stability of the meta-analysis, results were stable (Figure 9). Evaluation of publication bias for studies including 6-min walk test scores showed a funnel plot with near symmetry. The Egger test (p = 0.721 > 0.05) showed no significant publication bias (Figure 10).
Summary of found evidence for subgroups. (↑) Beneficial effect, p < 0.05; (=) the same effect, p > 0.05; (?) unknown effect. BBS, Berg Balance Scale; 6MinWT, 6-min walk test; TUG, Timed Up-and-Go test.
Sensitivity analysis results: (a) 6-Minute Walk Test; and (b) Timed Up-and-Go Test (Appendix 3).
Funnel plot of publication bias for 6-minute walk test score (Appendix 3).
Discussion
4
This meta-analysis demonstrates that task-oriented CCT significantly increases the distance covered during the 6-min walk test, confirming its efficacy in improving walking endurance. The reduced time required to complete the TUG indicates enhanced functional mobility. In stroke patients with lower limb dysfunction, task-oriented CCT leads to significantly greater improvements in walking speed compared to conventional training, although no significant differences were observed in BBS or MBI scores.
Subgroup analysis further revealed that, compared with early intervention within 3 months, delivering task-oriented CCT to individuals with a disease duration exceeding 3 months—particularly at a higher training frequency (≥3 times/week) and with individual sessions lasting ≤60 min—resulted in more pronounced improvements in walking endurance, as measured by the 6-min walk test. These benefits were most evident during the 3-month follow-up period and persisted over the long term, albeit with a gradually diminishing rate of improvement. Higher training frequency (>3 times/week) or longer session duration (≥1 h) was associated with greater gains in mobility (TUG), especially among patients with prolonged post-stroke duration (>3 months). For balance (BBS), patients with a longer post-stroke interval (>3 months) showed greater responsiveness, whereas neither training frequency nor session duration had a significant influence. Improvements in walking speed were primarily driven by higher training frequency (≥3 times/week) and were more substantial in individuals with a shorter disease duration (≤3 months).
For stroke patients, balance is often impaired, resulting in increased postural sway amplitudes and altered weight distribution patterns (31–33). Dynamic balance plays a critical role in mobility, and balance disorders are closely associated with an elevated risk of falls among stroke survivors (34–37). Although many stroke patients may regain the ability to walk, their walking endurance is frequently limited, even in those with relatively high functional capacity. Both dynamic balance and walking endurance are significantly correlated with health-related quality of life and participation levels in stroke survivors (38). Riech et al. (39) conducted a systematic review of training methods for standing and walking in adult stroke patients and first recommended repetitive task-specific interventions delivered in a group setting, as this approach demonstrated the largest statistically significant and clinically meaningful improvements in walking ability.
Task-oriented CCT simulates real-life environments through repetitive tasks, such as obstacle crossing and turning exercises, to enhance sensory-motor integration and cortical reorganization, thereby promoting neuroplasticity. It addresses multiple components of gait rehabilitation within a single session, including strength training, balance improvement, and steady-state walking practice. Task-oriented CCT incorporates at least three key principles essential for effective and efficient rehabilitation: First, exercises conducted at different stations allow stroke patients to engage in progressive, individualized programs tailored to their specific needs (10). Second, each therapist can supervise 2–3 patients simultaneously, reducing dependence on one-on-one therapist support (33, 40) and enabling increased treatment intensity and repetition without requiring additional human resources. Third, task-oriented CCT is delivered in a group setting, which facilitates observational learning—where participants observe others relearning motor tasks—and encourages social interaction among patients. Circuit training programs have been shown not only to improve motor function in stroke survivors (30, 41–43) but also to benefit cardiovascular fitness, muscle strength, and endurance and may exert a positive effect on post-stroke depression (44). Stroke patients can enhance their physical performance by integrating task-specific exercises into structured circuit training protocols (9, 24, 45). The Dutch Physical Therapy Association (KNGF) guidelines recommend this training method, as it has been demonstrated to enhance walking distance and speed, walking ability, sitting balance, and general health (Grade 1) (46).
McEwen et al. (47) analyzed 16 RCTs on cyclic exercise protocols for post-stroke survivors. However, due to generally poor reporting quality, an optimal standardized cyclic training protocol for post-stroke rehabilitation could not be identified. While individualized training protocols remain crucial for addressing the diverse needs of stroke survivors, there is a clear need to develop a unified foundational protocol to support broader implementation and consistency across clinical settings. Such a standardized protocol should specify multiple training stations, the type of exercise performed at each station, the duration and intensity of each exercise component, as well as the specific functional or physiological goals expected.
Four systematic reviews and one Cochrane review indicate that increasing the intensity and/or duration of exercise therapy can lead to small to moderate improvements in activities of daily living, walking ability, and walking speed (8, 11, 48, 49). Research has identified a clear dose–response relationship, where higher treatment doses are associated with clinically meaningful gains (12, 50). It is essential to individualize training intensity and duration according to specific rehabilitation goals. This study has several limitations: First, the relatively small number of included studies limits the generalizability of the findings. Second, the included studies exhibit clinical heterogeneity in terms of participant characteristics (including stroke type and stage), intervention protocols (such as dosage, intensity, and frequency), and outcome measures related to balance. This variability may affect the validity of pooled results in meta-analyses, thereby influencing the robustness of the conclusions. Third, only English-language literature was searched, introducing language bias and potentially excluding relevant non-English studies. Fourth, only five representative outcome indicators were analyzed, with limited consideration of emotional or psychological factors in patients, potentially leading to an incomplete understanding of the intervention’s overall impact. Fifth, some studies have small sample sizes, inadequate descriptions of interventions that hinder replication, and high heterogeneity among outcome indicators, which prevent meaningful statistical pooling through meta-analysis. Sixth, the Modified Barthel Index was included as an outcome measure; however, MBI is not specific to lower limb function and also encompasses assessments of upper limb function and activities of daily living. Finally, many studies lack long-term follow-up data, making it difficult to assess the sustained effects of group-based training on lower limb functional impairments in stroke survivors.
This meta-analysis suggests that task-oriented CCT may offer potential benefits in improving lower limb function following a stroke compared with traditional interventions. However, there is currently a paucity of studies evaluating the long-term health economic outcomes associated with task-oriented CCT versus traditional one-on-one treatment. Furthermore, future large-scale, multicenter, RCTs are necessary to compare the effects of various training components—such as content, intensity, session duration, and timing of intervention—on post-stroke walking function. Additionally, the potential synergistic effects of integrating task-oriented CCT with emerging technologies, such as robot-assisted therapy or brain-computer interface systems, warrant further investigation.
The reference list from the paper itself. Each links out to its DOI / PubMed record.
- 1Feigin VL Brainin M Norrving B Martins SO Pandian J Lindsay P . World stroke organization: global stroke fact sheet 2025. Int J Stroke. (2025) 20:132–44. doi: 10.1177/1747493024130814239635884 PMC 11786524 · doi ↗ · pubmed ↗
- 2Feigin VLA Abate YH. Global, regional, and national burden of stroke and its risk factors, 1990-2021: a systematic analysis for the global burden of disease study 2021. Lancet Neurol. (2024) 23:973–1003. doi: 10.1016/s 1474-4422(24)00369-7, 39304265 PMC 12254192 · doi ↗ · pubmed ↗
- 3Kim J Thayabaranathan T Donnan GA Howard G Howard VJ Rothwell PM . Global stroke statistics 2019. Int J Stroke. (2020) 15:819–38. doi: 10.1177/1747493020909545, 32146867 · doi ↗ · pubmed ↗
- 4Algurén B Lundgren-Nilsson A Sunnerhagen KS. Functioning of stroke survivors--a validation of the ICF core set for stroke in Sweden. Disabil Rehabil. (2010) 32:551–9. doi: 10.3109/09638280903186335, 20136473 · doi ↗ · pubmed ↗
- 5Moore SA Boyne P Fulk G Verheyden G Fini NA. Walk the talk: current evidence for walking recovery after stroke, future pathways and a mission for research and clinical practice. Stroke. (2022) 53:3494–505. doi: 10.1161/strokeaha.122.038956, 36069185 PMC 9613533 · doi ↗ · pubmed ↗
- 6Lord SE Mc Pherson K Mc Naughton HK Rochester L Weatherall M. Community ambulation after stroke: how important and obtainable is it and what measures appear predictive? Arch Phys Med Rehabil. (2004) 85:234–9. doi: 10.1016/j.apmr.2003.05.002, 14966707 · doi ↗ · pubmed ↗
- 7Kennedy C Bernhardt J Churilov L Collier JM Ellery F Rethnam V . Factors associated with time to independent walking recovery post-stroke. J Neurol Neurosurg Psychiatry. (2021) 92:702–8. doi: 10.1136/jnnp-2020-325125, 33737383 · doi ↗ · pubmed ↗
- 8Veerbeek JM Kwakkel G van Wegen EE Ket JC Heymans MW. Early prediction of outcome of activities of daily living after stroke: a systematic review. Stroke. (2011) 42:1482–8. doi: 10.1161/strokeaha.110.604090, 21474812 · doi ↗ · pubmed ↗