Optimized RTX strategy plus structured glucocorticoid tapering for primary membranous nephropathy: a multicenter propensity score-matched cohort study
Yao Sun, Yuxia Zhang, Jing Liu, Yanting Yu, Min Wu, Qing Yin, Yujia Wang, Ziyu Liang, Biao Huang, Ri-Ning Tang, Hai-ming Xia

TL;DR
A new treatment strategy for kidney disease improved remission and reduced relapse by optimizing drug exposure and glucocorticoid use.
Contribution
An exposure-optimized RTX dosing strategy with structured glucocorticoid tapering improves clinical and immunologic outcomes in primary membranous nephropathy.
Findings
The optimized RTX strategy achieved higher complete remission rates and faster remission onset compared to standard RTX.
The optimized strategy showed deeper immunologic responses and lower relapse rates over follow-up.
In refractory cases, the optimized strategy significantly outperformed standard RTX in achieving remission.
Abstract
Standard rituximab (RTX) regimens for primary membranous nephropathy (PMN) may result in subtherapeutic RTX exposure within 2–3 months due to altered pharmacokinetics, potentially contributing to delayed remission, incomplete immunologic control, and relapse. We evaluated whether an exposure-optimized RTX strategy combined with structured glucocorticoid tapering was associated with improved clinical and immunologic outcomes in PMN. This multicenter retrospective study included 182 PMN patients with nephrotic syndrome (2020–2025). After 1:2 propensity score matching, 75 patients were analyzed: an exposure-optimized strategy group (RTX 375 mg/m2 on days 1, 15, 30, and 120 with structured prednisone tapering, with subsequent TDM-guided redosing when RTX <2 μg/mL) versus standard RTX (RTX 375 mg/m2 weekly ×4 weeks). Median follow-up time was 17.0 (IQR: 12.5–25.6) and 14.8 (IQR: 12.0–27.1)…
Genes, proteins, chemicals, diseases, species, mutations and cell lines named across the full text — each resolved to its canonical identifier and authoritative record.
Click any figure to enlarge with its caption.
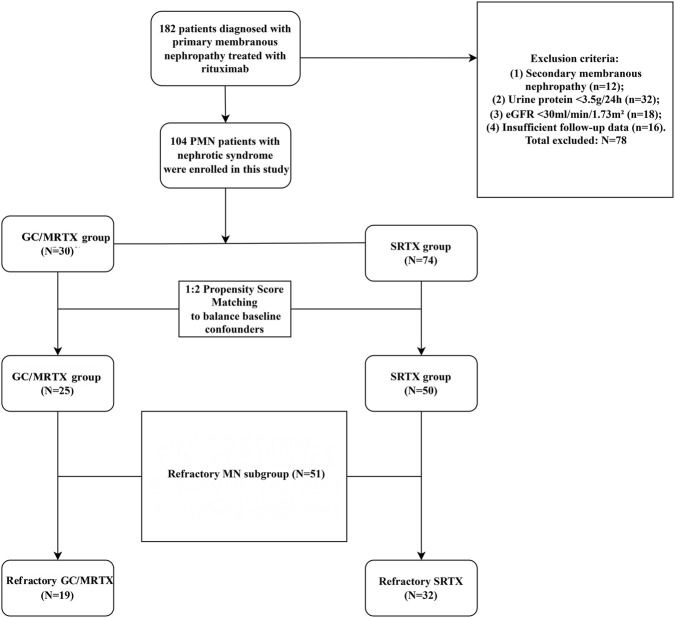 FIGURE 1
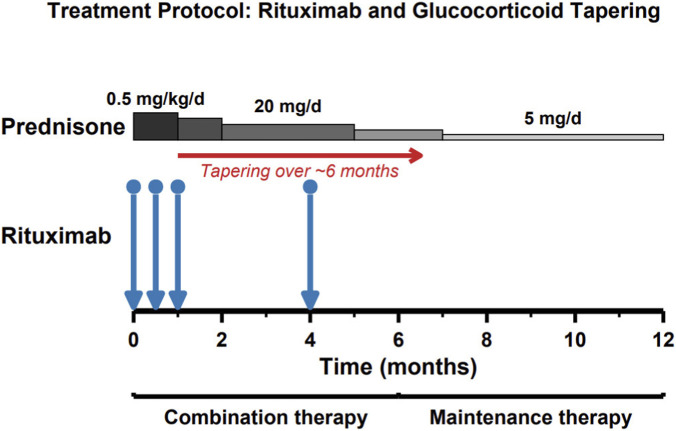 FIGURE 2
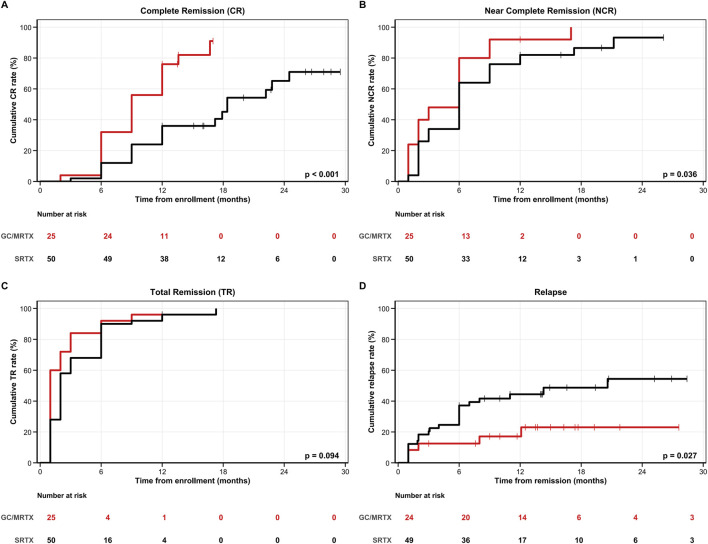 FIGURE 3
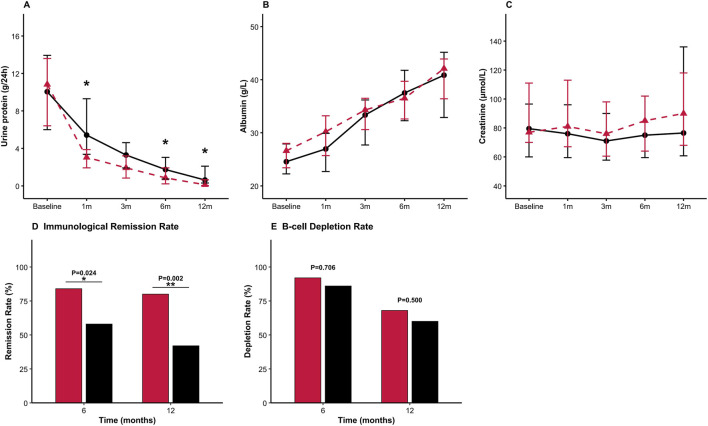 FIGURE 4
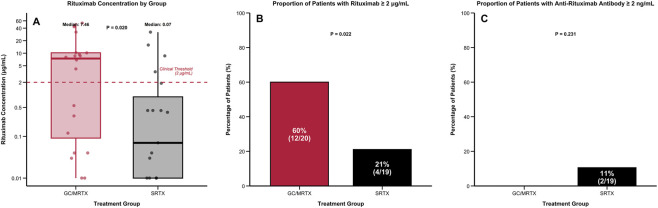 FIGURE 5
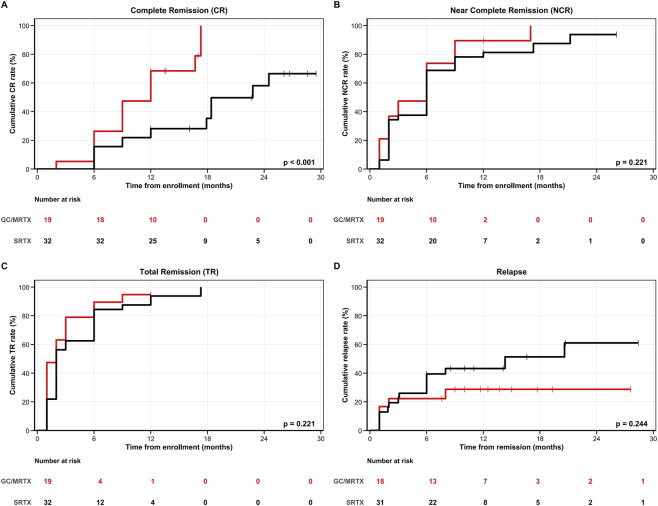 FIGURE 6
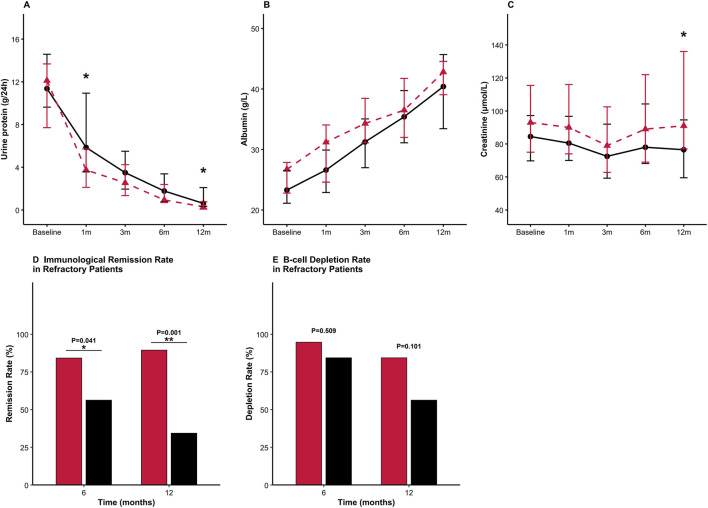 FIGURE 7
| Before PSM | After PSM | |||||
|---|---|---|---|---|---|---|
| Variables | GC/MRTX | SRTX | P Value | GC/MRTX | SRTX | P Value |
| N | 30 | 74 | 25 | 50 | ||
| Demographic | ||||||
| Age (y) | 58.0 (50.0, 66.5) | 56.50 (42.3, 68.5) | 0.664 | 59.0 (50.0, 67.0) | 55.5 (46.3, 66.5) | 0.525 |
| Male (%) | 19 (63.3) | 56 (75.7) | 0.204 | 17 (68.0) | 34 (68.0) | 1.000 |
| BMI (kg/m2) | 24.6 (22.1, 26.2) | 24.2 (21.9, 26.6) | 0.774 | 24.6 (22.0, 26.3) | 24.2 (21.7, 26.9) | 0.740 |
| Medical history | ||||||
| Hypertension (%) | 20 (66.7) | 48 (64.9) | 0.861 | 15 (60.0) | 31 (62.0) | 0.867 |
| Diabetes mellitus (%) | 7 (23.3) | 15 (20.3) | 0.729 | 7 (28.0) | 10 (20.0) | 0.435 |
| Cardiovascular Disease (%) | 1 (3.3) | 5 (6.8) | 0.830 | 1 (4.0) | 2 (4.0) | 1.000 |
| Cerebrovascular Disease (%) | 1 (3.3) | 11 (14.9) | 0.184 | 1 (4.0) | 8 (16.0) | 0.258 |
| Clinical variables | ||||||
| Urine protein (g/24 h) | 11.3 (6.6, 13.7) | 9.3 (6.0, 13.8) | 0.331 | 10.8 (6.4, 13.6) | 10.1 (6.0, 13.9) | 0.783 |
| Albumin (g/L) | 27.0 (23.4, 29.6) | 23.9 (21.0, 27.9) | 0.042* | 26.6 (23.4, 28.0) | 24.6 (22.3, 27.9) | 0.325 |
| Scr (μmol/L) | 76.5 (65.8, 101.0) | 83.2 (60.0, 112.8) | 0.911 | 77.0 (70.0, 111.0) | 79.5 (60.0, 96.5) | 0.345 |
| eGFR (mL/min/1.73 m2) | 87.9 (57.0, 102.5) | 93.5 (63.2, 106.5) | 0.338 | 86.4 (56.7, 102.6) | 90.6 (71.2, 102.6) | 0.455 |
| TG (mmol/L) | 1.7 (1.2, 2.8) | 1.9 (1.6, 2.8) | 0.135 | 1.6 (1.1, 2.0) | 2.0 (1.6,2.8) | 0.054 |
| TC (mmol/L) | 6.6 (5.5, 7.7) | 6.6 (5.4, 8.0) | 0.857 | 7.0 (6.3, 8.2) | 6.8 (5.7,8.8) | 0.796 |
| HDL (mmol/L) | 1.5 (1.2, 1.9) | 1.3 (1.0, 1.6) | 0.015* | 1.6 (1.3, 2.0) | 1.4 (1.0,1.6) | 0.063 |
| LDL (mmol/L) | 3.6 (3.1, 4.2) | 3.6 (2.8, 4.7) | 0.938 | 3.7 (2.8, 4.5) | 3.7 (3.1,4.6) | 0.580 |
| CD3+ T cell (cell/μL) | 998.9 (690.9, 1,527.2) | 1,387.0 (951.4, 1778.1) | 0.032* | 1,222.44 (754.25, 1,554.67) | 1,397.50 (959.30, 1790.46) | 0.126 |
| CD4+ T cell (cell/μL) | 630.5 (453.0, 1,031.0) | 839.0 (593.5, 1,139.0) | 0.184 | 330.69 (211.25, 630.34) | 910.76 (624.00, 1,128.48) | 0.282 |
| CD8+ T cell (cell/μL) | 320.9 (216.4, 516.5) | 480.5 (332.0, 639.2) | 0.031* | 275.42 (169.68, 331.58) | 482.00 (341.72, 639.23) | 0.104 |
| CD19+ B cell (cell/μL) | 274.1 (176.1, 329.4) | 239.1 (169.3, 345.5) | 0.963 | 275.42 (169.68, 331.58) | 248.75 (155.50, 327.11) | 0.822 |
| PLA2R ab* (RU/mL) | 36.2 (13.3, 69.9) | 52.9 (21.9, 129.9) | 0.189 | 36.1 (12.9, 54.5) | 46.6 (13.2, 107.5) | 0.240 |
| PLA2R ab positive (%) | 15 (50.0) | 44 (59.5) | 0.378 | 17 (70.8) | 37 (74.0) | 0.774 |
| Variables | GC/MRTX (n = 25) | SRTX (n = 50) | P Value |
|---|---|---|---|
| Follow-up duration | |||
| Median follow-up (months) | 17.0 (12.5, 25.6) | 14.8 (12.0, 27.1) | 0.310 |
| Range | 12.0–39.7 | 12.0–42.9 | NA |
| Complete remission | |||
| 6 months, n (%) | 7 (28.0) | 6 (12.0) | 0.161 |
| 12 months, n (%) | 16 (64.0) | 11 (22.0) |
|
| End of follow-up, n (%) | 11 (44.0) | 9 (18.0) |
|
| Median time to CR | 9.0 (9.0–12.0) | 18.4 (17.2-NA) |
|
| Near complete remission | |||
| 6 months, n (%) | 19 (76.0) | 26 (52.0) |
|
| 12 months, n (%) | 22 (88.0) | 35 (70.0) | 0.085 |
| End of follow-up, n (%) | 23 (92.0) | 31 (62.0) |
|
| Median time to NCR | 6.0 (2.0–6.0) | 6.0 (6.0–9.0) |
|
| Total remission | |||
| 6 months, n (%) | 23 (92.0) | 41 (82.0) | 0.419 |
| 12 months, n (%) | 24 (96.0) | 42 (84.0) | 0.258 |
| End of follow-up, n (%) | 24 (96.0) | 40 (80.0) | 0.088 |
| Median time to TR | 1.0 (1.0–3.0) | 2.0 (2.0–3.0) | 0.094 |
| Relapse rate | |||
| End of follow-up, n (%) | 0 (0) | 9 (18.4) | 0.026 |
| Median time to relapse | NA | 20.6 (7.0-NA) |
|
| Variables | Univariable analysis | Multivariable analysis | ||
|---|---|---|---|---|
| HR (95% CI) | P Value | HR (95% CI) | P Value | |
| Treatment regimen (GC/MRTX vs. SRTX) | 3.514 (1.859–6.64) |
| 3.451 (1.778–6.697) |
|
| Age (years) | 0.995 (0.976–1.013) | 0.566 | ||
| Sex (female vs. male) | 1.301 (0.715–2.369) | 0.389 | ||
| Body mass index (kg/m2) | 1.012 (0.926–1.106) | 0.791 | ||
| Baseline proteinuria (g/24 h) | 0.936 (0.878–0.998) |
| 0.917 (0.854–0.984) |
|
| Baseline albumin (g/L) | 0.987 (0.932–1.044) | 0.640 | ||
| Baseline creatinine (μmol/L) | 0.991 (0.981–1.001) |
| ||
| eGFR (mL/min/1.73 m2) | 0.999 (0.99–1.009) | 0.902 | ||
| Triglycerides (mmol/L) | 1.11 (0.953–1.285) | 0.183 | ||
| Total cholesterol (mmol/L) | 1.03 (0.906–1.172) | 0.650 | ||
| CD3+ T cell (cell/μL) | 1 (1–1.001) | 0.222 | ||
| CD4+ T cell (cell/μL) | 1.001 (1–1.001) |
| 1.000 (0.999–1.001) | 0.689 |
| CD8+ T cell (cell/μL) | 1 (0.998–1.001) | 0.788 | ||
| CD19+ B cell (cell/μL) | 1.001 (1–1.003) |
| 1.001 (0.999–1.003) | 0.293 |
| Anti-PLA2R antibody | 0.834 (0.438–1.589) | 0.581 | ||
| Hypertension | 0.629 (0.352–1.125) | 0.118 | ||
| Diabetes mellitus | 0.896 (0.461–1.745) | 0.747 | ||
| CardiovascularDisease | 0.789 (0.789–8.425) | 0.117 | ||
| CerebrovascularDisease | 0.305 (0.073–1.27) | 0.103 |
| Variables | GC/MRTX (n = 19) | SRTX (n = 32) | P Value |
|---|---|---|---|
| Demographic | |||
| Age (y) | 57.0 (49.5, 66.0) | 55.5 (48.3, 65.5) | 0.800 |
| Male (%) | 16 (84.21) | 24 (75.00) | 0.674 |
| BMI (kg/m2) | 24.2 (22.4, 26.6) | 24.1 (22.2, 26.6) | 0.812 |
| Medical history | |||
| Hypertension (%) | 13 (68.42) | 20 (62.50) | 0.669 |
| Diabetes mellitus (%) | 4 (21.05) | 4 (12.50) | 0.679 |
| Cardiovascular disease (%) | 0 (0.00) | 1 (3.12) | 1.000 |
| Cerebrovascular disease (%) | 1 (5.26) | 7 (21.88) | 0.238 |
| Clinical variables | |||
| Urine protein (g/24 h) | 12.12 (7.71, 13.68) | 11.37 (9.63, 14.58) | 0.650 |
| Albumin (g/L) | 26.70 (22.80, 27.85) | 23.30 (21.12, 26.50) | 0.144 |
| Scr (μmol/L) | 93.00 (75.00, 115.50) | 84.50 (69.75, 97.25) | 0.170 |
| eGFR (mL/min/1.73 m2) | 72.38 (51.03, 92.44) | 88.65 (72.41, 99.95) | 0.094 |
| CD3+ T cell (cell/μL) | 918.75 (695.54, 1,414.00) | 1,349.24 (893.02, 1,563.72) | 0.180 |
| CD4+ T cell (cell/μL) | 610.66 (454.50, 841.27) | 814.06 (580.65, 1,033.03) | 0.104 |
| CD8+ T cell (cell/μL) | 323.16 (194.06, 665.90) | 462.07 (331.50, 557.66) | 0.324 |
| CD19+ B cell (cell/μL) | 263.76 (155.99, 337.15) | 213.91 (136.13, 316.17) | 0.661 |
| PLA2R ab* (RU/mL) | 30.48 (10.79, 73.20) | 61.72 (19.03, 128.23) | 0.188 |
| PLA2R ab positive (%) | 12 (66.67) | 24 (75.00) | 0.529 |
| Variables | GC/MRTX | SRTX | P Value |
|---|---|---|---|
| Follow-up duration | |||
| Median follow-up (months) | 16.8 (12.00, 22.85) | 12.00 (12.00, 27.17) | 0.632 |
| Complete remission | |||
| 6 months, n (%) | 4 (21.05) | 5 (15.62) | 0.911 |
| 12 months, n (%) | 10 (52.63) | 6 (18.75) |
|
| End of follow-up, n (%) | 7 (36.8) | 4 (12.5) | 0.075 |
| Median time to CR | 12.0 (9.0-NA) | 22.8 (17.9-NA) |
|
| Near complete remission | |||
| 6 months, n (%) | 14 (73.68) | 19 (59.38) | 0.301 |
| 12 months, n (%) | 16 (84.21) | 23 (71.88) | 0.508 |
| End of follow-up, n (%) | 18 (94.7) | 21 (65.6) |
|
| Median time to NCR | 6.0 (2.0–9.0) | 6.0 (3.0–9.0) |
|
| Total remission | |||
| 6 months, n (%) | 17 (89.47) | 24 (75.00) | 0.371 |
| 12 months, n (%) | 18 (94.74) | 26 (81.25) | 0.351 |
| End of follow-up, n (%) | 18 (94.7) | 25 (78.1) | 0.231 |
| Median time to TR | 2.0 (1.0–6.0) | 3.0 (2.0–6.0) | 0.221 |
| Relapse rate | |||
| End of follow-up, n (%) | 0 (0) | 6 (19.4) | 0.073 |
| Median time to relapse | NA | 14.3 (6.0-NA) | 0.244 |
| Variables(N) | GC/MRTX (n = 25) | SRTX (n = 50) | P Value |
|---|---|---|---|
| Total AEs (%) | 5 (20.0) | 11 (22.0) | 0.792 |
| Infections (%) | 5 (20.0) | 6 (12.0) | 0.479 |
| Respiratory tract infection (%) | 3 (12.0) | 3 (6.0) | 0.665 |
| Urinary tract infection (%) | 2 (8.0) | 3 (6.0) | 1.000 |
| Increase of liver enzymes (%) | 0 | 1 (2.0) | 1.000 |
| Leukopenia | 0 (0.0) | 1 (2.0) | 1.000 |
| Diabetes | 0 (0.0) | 2 (4.0) | 0.544 |
| Cardiovascular events | 0 (0.0) | 1 (2.0) | 1.000 |
- —National Natural Science Foundation of China10.13039/501100001809
- —Jiangsu Commission of Health10.13039/100017962
- —Nanjing Drum Tower Hospital10.13039/501100019155
Peer Reviews
No public reviews on file for this paper yet. If you reviewed it on a platform where reviews are public (OpenReview, ICLR, NeurIPS, ICML), you can paste yours below so the community can read it here.
Videos
No videos yet. Explain this paper in a talk, walkthrough, or lecture? Add one.
Taxonomy
TopicsRenal Diseases and Glomerulopathies · Vasculitis and related conditions · Pregnancy and Medication Impact
Introduction
1
Primary membranous nephropathy (PMN), characterized by diffuse thickening of the glomerular basement membrane and subepithelial immune deposits, is a leading cause of nephrotic syndrome in adults (Couser, 2017; Ponticelli and Glassock, 2014). With the discovery of the M-type phospholipase A2 receptor (PLA2R) as the principal autoantigen (Beck et al., 2009), PMN is currently established as an autoimmune disease driven by pathogenic autoantibodies and B-cell dysregulation (van de Logt et al., 2019). Rituximab (RTX), an anti-CD20 monoclonal antibody, depletes B cells and reduces autoantibody production, with its efficacy confirmed in randomized controlled trials (Fervenza et al., 2019; Scolari et al., 2021; Fernández-Juárez et al., 2021). The MENTOR trial demonstrated the superiority of RTX over cyclosporine in achieving sustained remission (Fervenza et al., 2019), leading to its endorsement as first-line therapy in the KDIGO 2021 guidelines (Kidney Disease: Improving Global Outcomes KDIGO Glomerular Diseases Work Group, 2021). Despite this, systematic reviews and real-world studies have revealed suboptimal complete remission (CR) rates with standard RTX (SRTX) monotherapy in PMN patients with nephrotic syndrome (Bomback et al., 2009; Ruggenenti et al., 2012; Huang et al., 2025), suggesting significant room for optimization of dosing regimens and treatment intervals.
A growing body of real-world pharmacokinetic evidence provides insight into these suboptimal outcomes. Several studies have demonstrated that patients with PMN—particularly those with nephrotic-range proteinuria—experience markedly altered RTX pharmacokinetics, including accelerated clearance, shortened half-life, and early decline of serum RTX concentrations to subtherapeutic levels (<2 μg/mL) within 2–3 months after standard weekly ×4 infusions (Dahan et al., 2017; Fogueri et al., 2019; Boyer-Suavet et al., 2019). These abnormalities have been attributed to non-selective urinary immunoglobulin loss associated with heavy proteinuria, altered distribution, and high immunologic target burden. The development of anti-RTX antibodies (ARAs) further accelerates RTX elimination, impairs immunologic control, and increases relapse risk, particularly in patients with low drug exposure (Boyer-Suavet et al., 2019). Collectively, these findings highlight a consistent “pharmacokinetic–immunologic vulnerability window” at approximately 2–3 months post-infusion, during which RTX levels fall below therapeutic thresholds while B-cell reconstitution and PLA2R antibody rebound may occur (Dahan et al., 2017; Fogueri et al., 2019; Boyer-Suavet et al., 2019).
Recent model-informed analyses support exposure-oriented individualization in autoimmune glomerular diseases. In a population pharmacokinetic model, body weight, proteinuria, disease type, treatment duration, and anti-RTX antibody formation were key determinants of RTX exposure; accordingly, dosing schedules (including interval adjustment in high-proteinuria, difficult-to-treat diagnoses such as PMN) were recommended to improve exposure reliability (Hartinger et al., 2024). Real-world therapeutic drug monitoring (TDM) data from regional laboratories in China further show frequent subtherapeutic RTX exposure and anti-RTX antibody formation in PMN (Supplementary Figure 1). Together, these findings highlight the limitations of fixed-interval standard RTX dosing in PMN and support optimized regimens to maintain adequate exposure throughout the vulnerability period (Dahan et al., 2017; Fogueri et al., 2019; Boyer-Suavet et al., 2019; Hartinger et al., 2024).
Another limitation of SRTX monotherapy is delayed clinical response. Whereas B-cell depletion after RTX requires several weeks to translate into clinical improvement, glucocorticoids provide rapid control of proteinuria. Although KDIGO guidelines emphasize minimizing long-term glucocorticoid exposure (Kidney Disease: Improving Global Outcomes KDIGO Glomerular Diseases Work Group, 2021), recent studies demonstrate that structured low-dose glucocorticoid tapering regimens can maintain disease control with improved safety profiles in nephrotic syndrome (Li et al., 2024). The combination of RTX with structured glucocorticoid tapering may therefore yield synergistic effects—providing early disease control while potentially suppressing ARA formation—and limiting steroid-related adverse events.
Informed by these observations, we developed a modified RTX (GC/MRTX) plus glucocorticoid tapering regimen: RTX 375 mg/m^2^ administered on days 1, 15, 30, and 120, with concomitant prednisone initiated at 0.5 mg/kg/day, tapered to 20 mg/day by month 3, gradually reduced to 5 mg/day by month 6, and maintained thereafter. Following this initial course, serum RTX concentrations were monitored every 3 months, with additional infusions administered when drug levels fell below the therapeutic threshold of 2 μg/mL. This pharmacokinetic-guided strategy aims to maintain adequate drug exposure throughout the vulnerability period, prevent premature B-cell reconstitution, and suppress ARA formation (Dahan et al., 2017; Fogueri et al., 2019; Boyer-Suavet et al., 2019; Hartinger et al., 2024). In this study, we compared the efficacy and safety of GC/MRTX versus SRTX in PMN patients with nephrotic syndrome, specifically evaluating clinical remission, immunological remission, relapse rates, RTX pharmacokinetics, and ARA formation.
Materials and methods
2
Study population
2.1
This multicenter retrospective study included patients with PMN who were treated between September 2020 and September 2025 at the Department of Nephrology of Zhongda Hospital, affiliated with Southeast University, and the Department of Nephrology of Nanjing Drum Tower Hospital, affiliated with the Medical School of Nanjing University. Of the 182 patients screened, 104 fulfilled the following inclusion criteria (Figure 1): (1) renal biopsy showing PMN, or aPLA2Rab ≥14 RU/mL; (2) age between 18 and 80 years; (3) nephrotic syndrome at baseline, defined as persistent nephrotic-range proteinuria (24-h urinary protein ≥3.5 g) with serum albumin <30 g/L; (4) receiving either the GC/MRTX or SRTX treatment regimen with completed follow-up; (5) follow-up time ≥12 months. The exclusion criteria were as follows: (1) secondary membranous nephropathy caused by connective tissue disease, malignancy, or hepatitis B; (2) refusal of follow-up. Definition of refractory PMN (RMN subgroup). The prespecified RMN subgroup comprised patients with treatment-resistant and/or relapsing PMN, defined as failure to achieve at least partial remission after an adequate prior course of immunosuppressive therapy, and/or relapse after a documented remission.
Study flowchart of patient selection and matching. This flow diagram shows the screening strategy, inclusion and exclusion criteria, and the 1:2 propensity-score matching procedure. A total of 75 matched primary membranous nephropathy (PMN) patients were included (GC/MRTX, n = 25; SRTX, n = 50). A predefined refractory membranous nephropathy (RMN) subgroup (n = 51) was additionally identified.
This study was approved by the Ethics Committee of Zhongda Hospital, Southeast University (Approval No. 2025ZDSYLL189-P01), and was conducted in accordance with the Declaration of Helsinki (1964 and its later amendments). Given the retrospective nature of the study and the use of de-identified clinical data, the requirement for written informed consent was formally waived by the Ethics Committee of Zhongda Hospital, Southeast University. The ethics committee confirmed that the waiver met national and institutional guidelines and complied with the Declaration of Helsinki.
Treatment regimens
2.2
The exposure-optimized strategy (GC/MRTX) is illustrated in Figure 2 and consisted of RTX 375 mg/m^2^ administered intravenously on days 1, 15, 30, and 120. After completion of the induction course, serum rituximab concentrations were measured every 3 months, and TDM-guided redosing was performed as a single additional infusion of RTX 375 mg/m^2^ when the serum RTX concentration fell below 2 μg/mL. Because a clinically validated TRFIA target concentration has not been established for PMN, this cutoff was used to standardize real-world redosing decisions rather than to represent an evidence-based therapeutic target. Oral prednisone was initiated at 0.5 mg/kg/day, tapered to 20 mg/day by month 3, gradually reduced to 5 mg/day by month 6, and maintained thereafter. The SRTX monotherapy regimen comprised the administration of RTX 375 mg/m^2^ intravenously once weekly for four consecutive weeks without concomitant glucocorticoid therapy. Supportive measures, including renin–angiotensin system inhibitors, anticoagulants, lipid-lowering agents, and infection prophylaxis, were provided as indicated. Retreatment at month 6 consisted of RTX 375 mg/m^2^ per infusion. For partial responders, a single infusion was generally used for consolidation following shared decision-making (including patient preference and treatment affordability). For non-responders, a second infusion 1 week later (weekly ×2) could be administered at the treating physician’s discretion. Owing to the outbreak of the coronavirus disease 2019 in China and the hospitalization-control policies of medical insurance, as well as other factors, including the occurrence of infections and patients’ unwillingness to attend hospital visits, some patients were unable to receive RTX at scheduled timepoints. Consequently, the interval between RTX infusions in some patients with nephrotic syndrome was occasionally brought forward or delayed. For each planned rituximab administration timepoint (GC/MRTX: days 1, 15, 30, and 120; SRTX: weekly ×4), we recorded the planned date and the actual administration date. Timing deviation was defined as (Actual date − Planned date) in days; any non-zero value was considered a deviation (negative = earlier, positive = delayed). Deviations were summarized at both the administration level (by timepoint) and the patient level (any deviation, any earlier, any delay, and maximum absolute deviation across timepoints). Detailed tabulations are provided in the Supplementary Table 1.
Treatment regimens for the modified-interval rituximab (GC/MRTX). The GC/MRTX regimen consisted of rituximab (RTX) 375 mg/m2 administered on days 1, 15, 30, and 120, combined with structured prednisone tapering to 5 mg/day by month 6.
Follow-up and data collection
2.3
Clinical data and laboratory indicators were collected at baseline and during standardized follow-up visits at 1, 2, 3, 6, 9, and 12 months. After 12 months, patients were followed at variable intervals based on clinical status. Median follow-up was 17.0 months (interquartile range [IQR]: 12.5–25.6) in the GC/MRTX group and 14.8 months (IQR: 12.0–27.1) in the SRTX group. For patients who could not attend scheduled hospital visits, information regarding remission status (based on patient-reported outcomes and available local laboratory reports) and relapse was obtained through structured telephone interviews. The CKD-EPI 2009 formula was used to assess the estimated glomerular filtration rate (eGFR). Peripheral blood B lymphocytes were detected using flow cytometry. B-cell depletion was diagnosed based on a CD19^+^ cell count <5 cells/μL. A quantitative enzyme-linked immunosorbent assay was used to detect aPLA2Rab concentrations, with immunological remission defined as aPLA2Rab levels <14 RU/mL and complete immunological remission as aPLA2Rab <2 RU/mL. For each nominal follow-up time point, the closest available CD19^+^ measurement within a ±4-week visit window was used. CR was defined as 24 h urinary protein <0.3 g, serum albumin ≥30 g/L, and an eGFR reduction of <25% compared with baseline. Near-CR (NCR) was defined as a proteinuria reduction of >80% compared with baseline. Partial remission (PR) was defined as proteinuria quantification that decreased by >50% compared with baseline, 24-hour urinary protein excretion <3.5 g, serum albumin concentration ≥30 g/L, and eGFR reduction of <25% compared with baseline. If the above indicators were not met, patients were classified as having no remission. The total remission rate (TR) includes CR or PR. Disease relapse was defined as the recurrence of nephrotic-range proteinuria (≥3.5 g/24 h) after achieving PR or CR. End-stage renal disease was diagnosed based on eGFR <15 mL/min/1.73 m^2^ with uremia, hyperkalemia, or implementation of renal replacement therapy. Severe infection was defined as an infection requiring >24 h hospitalization, requiring intravenous antibiotic therapy, or resulting in death.
Statistical analysis
2.4
Data are expressed as mean ± SD, median (IQR), or frequencies (percentages). Group comparisons were performed using Student’s t-test, Mann–Whitney U test, chi-square test, or Fisher’s exact test, as appropriate. Longitudinal laboratory parameters were summarized at each scheduled visit. Between-group comparisons at each visit were performed using Student’s t-test or Mann–Whitney U test, as appropriate, based on available cases at that time point (no imputation). Kaplan–Meier curves with log-rank tests compared time-to-event outcomes between groups. Cox proportional hazards regression identified independent predictors of CR. Propensity score matching (1:2, caliper 0.2) balanced baseline characteristics. Matching variables included age, sex, 24-h urinary protein, serum albumin, serum creatinine, eGFR, CD19^+^ B-cell count. Analyses were performed using R 4.4.2. P < 0.05 was considered significant. Balance metrics are provided in Supplementary Table 2.
Results
3
Baseline characteristics of the entire cohort
3.1
Baseline characteristics were well balanced after matching (Figure 1; Table 1). The median age was 59.0 years (IQR 50.0–67.0) versus 55.5 years (IQR 46.3–66.5) (p = 0.525). 24-h proteinuria was 10.8 g/24 h (IQR 6.4–13.6) versus 10.1 g/24 h (IQR 6.0–13.9) (p = 0.783). Serum albumin was 26.6 g/L (IQR 23.4–28.0) versus 24.6 g/L (IQR 22.3–27.9) (p = 0.325). eGFR was 86.4 mL/min/1.73 m^2^ (IQR 56.7–102.6) versus 90.6 mL/min/1.73 m^2^ (IQR 71.2–102.6) (p = 0.455), and anti-PLA2R positivity was 70.8% versus 74.0% (p = 0.774). No significant differences were observed in key clinical parameters.
Timing deviations from the planned infusion schedule
3.1.1
Deviations between planned and actual administration dates were observed in both groups and were predominantly delays. In the GC/MRTX cohort (n = 25), deviations increased at later infusions (Infusion 2–4: 64%, 76%, and 92% of administrations with any deviation, respectively), with delays being more common than earlier administrations. At the patient level, 23/25 (92%) had ≥1 deviation, 22/25 (88%) had ≥1 delay, and 6/25 (24%) had ≥1 earlier-than-planned administration; 5/25 (20%) experienced both earlier and delayed administrations across visits. In the SRTX cohort (n = 50), no deviations occurred at Week 1, whereas deviations were observed at Weeks 2–4 (40%, 58%, and 58%); all non-zero deviations were delays with no earlier administrations. The median patient-level maximum absolute deviation was 6 days (IQR 2–8; range 0–15) in GC/MRTX and 1 day (IQR 0–2; range 0–5) in SRTX. Detailed results by timepoint are shown in Supplementary Table 1A, and patient-level summaries are provided in Supplementary Table 1B.
Efficacy comparison between two treatments in PMN
3.2
At 12 months, CR was achieved in 64.0% (16/25) of patients receiving GC/MRTX versus 22.0% (11/50) of those receiving SRTX (absolute risk difference, 0.42; 95% CI, 0.19 to 0.61; OR, 6.29; 95% CI, 2.15 to 18.40; p < 0.001) (Table 2). Median time to CR was significantly shorter in the GC/MRTX group (9.0 months [95% CI: 9.0–12.0] vs. 18.4 months [95% CI: 17.2–not reached], p < 0.001) than in the SRTX group. Kaplan–Meier analysis demonstrated higher cumulative CR in the GC/MRTX group (log-rank p < 0.001) (Figure 3A). NCR at 12 months was 88.0% (22/25) in the GC/MRTX group versus 70.0% (35/50) in the SRTX group (absolute risk difference, 0.18; 95% CI, −0.02 to 0.37; OR, 3.14; 95% CI, 0.85 to 11.59; p = 0.085). Cumulative NCR favored the MRTX group (log-rank p = 0.036) (Figure 3B). TR at 12 months reached 96.0% (24/25) versus 84.0% (42/50) (p = 0.258), with cumulative TR showing a trend toward GC/MRTX (log-rank p = 0.094) (Figure 3C). Relapse occurred in 0% (0/25) of patients receiving GC/MRTX versus 18.4% (9/49) of those receiving SRTX at the end of follow-up (p = 0.026). Kaplan–Meier analysis confirmed lower cumulative relapse risk in the GC/MRTX group (log-rank p = 0.027) (Figure 3D). Multivariable Cox regression identified GC/MRTX treatment as the strongest independent predictor of CR (adjusted HR 3.451, 95% CI 1.778–6.697, p < 0.001) after adjusting for baseline proteinuria (HR 0.917, 95% CI 0.854–0.984, p = 0.017) and other clinical parameters (Table 3).
Kaplan–Meier analyses of clinical outcomes in the overall PMN cohort. (A) Complete remission (CR): The GC/MRTX group achieved significantly higher cumulative CR than the SRTX group (log-rank p < 0.001). (B) Near-complete remission (NCR): GC/MRTX showed superior cumulative NCR (log-rank p = 0.036). (C) Total remission (TR): Both groups had high remission rates, with a trend favoring GC/MRTX (p = 0.094). (D) Relapse-free survival: The GC/MRTX group demonstrated significantly lower cumulative relapse (p = 0.027). Numbers at risk are shown below each plot.
Longitudinal changes and immunological response
3.3
Proteinuria declined faster in the GC/MRTX group throughout the follow-up, with significantly lower levels observed at 1, 6, and 12 months compared with those in the SRTX group (all p < 0.05) (Figure 4A). Serum albumin recovered more rapidly in the GC/MRTX group during the first 3 months, with both groups achieving similar levels by 12 months (Figure 4B). Creatinine levels remained stable throughout the follow-up in both groups (Figure 4C).
*Longitudinal changes in clinical and immunologic indicators. (A) 24-hour urinary protein: Faster and deeper reduction with GC/MRTX at months 1 and 6 (p < 0.05). (B) Serum albumin: Gradual improvement in both groups. (C) Serum creatinine: Stable kidney function throughout follow-up. (D) immunological remission < 14 RU/mL; complete immunological remission < 2 RU/mL: Higher rates in GC/MRTX at 6 and 12 months (p = 0.024, p = 0.002). (E) B-cell depletion (CD19+ <5 cells/μL): Similar depletion rates at 6 and 12 months.
Complete Immunological remission (<2 RU/mL) at 6 months was 84% in the GC/MRTX group and 58% in the SRTX group (p = 0.024), evolving to 80% versus 42%, respectively, at 12 months (p = 0.002) (Figure 4D). B-cell depletion rates at 6 months were similar (92% vs. 82%, p = 0.706), declining to 68% versus 60%, respectively, at 12 months (p = 0.500) (Figure 4E).
At 6 months, median serum rituximab concentration was 7.46 μg/mL (IQR: 0.94–11.77) in the GC/MRTX group versus 0.07 μg/mL (IQR: 0.03–1.07) in the SRTX group (p = 0.020) (Figure 5). Therapeutic concentrations (≥2 μg/mL) were maintained in 60.0% (15/25) versus 21.1% (10/50) of patients receiving GC/MRTX and SRTX, respectively (p = 0.022). In the GC/MRTX group, rituximab trough concentrations were assessed at Months 9 and 12 (Supplementary Figures 3A,B). The median trough RTX concentration was 4.21 μg/mL (IQR 1.87–6.56; n = 23) at Month 9 and 4.12 μg/mL (IQR 2.34–5.12; n = 23) at Month 12. The proportions of patients with trough RTX ≥2 μg/mL were 74% (17/23) and 83% (19/23), respectively. Additional RTX administration during follow-up is summarized in Supplementary Figure 2. In the GC/MRTX group, additional dosing occurred in 0/25 patients at month 6, 6/23 at month 9, and 5/23 at month 12 (n/N; denominators indicate evaluable patients at each time point) (Supplementary Figure 2A). In the SRTX group, retreatment was assessed at month 6, with 17/50 patients receiving retreatment (RTX 375 mg/m^2^ per infusion); no protocol-scheduled retreatment was planned or assessed at months 9 and 12, which is indicated as “–†” (Supplementary Figure 2A). Among SRTX patients who underwent month-6 retreatment (n = 17), all responders (PR, n = 8) received a single-infusion retreatment (8/8), whereas non-responders (NR, n = 9) received either a single infusion (6/9) or weekly ×2 retreatment (3/9), with weekly ×2 retreatment occurring exclusively in non-responders (Supplementary Figure 2B). ARAs were detected only in SRTX patients (11% vs. 0%, p = 0.231).
Serum rituximab exposure and anti-rituximab antibody detection at 6 months. (A) Serum RTX concentrations: Higher drug exposure in the GC/MRTX group (median 7.46 μg/mL vs. 0.07 μg/mL; p = 0.020). (B) Proportion with therapeutic exposure (≥2 μg/mL): 60% vs. 21% (p = 0.022). (C) Anti-RTX antibodies (ARAs): Detected only in SRTX patients (11%).
Comparison of efficacy in refractory PMN (RMN) subgroup
3.4
Baseline characteristics were balanced among the 51 patients with refractory MN (GC/MRTX, n = 19; SRTX, n = 32) (Table 4). At 12 months, the GC/MRTX group achieved higher CR (52.63% vs. 18.75%; absolute risk difference, 0.34; 95% CI, 0.08 to 0.57; OR, 4.87; 95% CI, 1.40 to 16.90; p = 0.012) (Table 5). Median time to CR was 12.0 months (95% CI: 9.0–not reached) and 22.8 months (95% CI: 17.9–not reached) (p < 0.001) in the GC/MRTX and SRTX groups, respectively. Kaplan–Meier analysis demonstrated superior cumulative CR in the GC/MRTX group (log-rank p < 0.001) (Figure 6A).
Kaplan–Meier analyses of clinical outcomes in the RMN subgroup. (A) Complete remission (CR): The GC/MRTX group achieved significantly higher cumulative CR (log-rank p < 0.001). (B) Near-complete remission (NCR): Higher in GC/MRTX but not statistically significant (log-rank p = 0.221). (C) Total remission (TR): No significant difference between groups. (D) Relapse-free survival: Lower relapse tendency in GC/MRTX (log-rank p = 0.244). Numbers at risk are shown below each plot.
NCR in the GC/MRTX and SRTX groups at 12 months was 84.21% versus 71.88% (p = 0.508), respectively, reaching 94.7% versus 65.6% at the end of follow-up (p = 0.020) (Figure 6B). Total remission (TR) over follow-up is shown in Figure 6C. Relapse rates were numerically lower in the GC/MRTX group (0% vs. 19.4%, p = 0.073), although the difference was not statistically significant (log-rank p = 0.244) (Figure 6D).
In the refractory subgroup, the reduction in proteinuria mirrored the pattern observed in the overall cohort, with a steeper decline evident at 1 month in the GC/MRTX group (4 g/24 h vs. 7 g/24 h, p < 0.05) (Figure 7A). Serum albumin improved over time in both groups (Figure 7B), and serum creatinine remained overall stable, with a between-group difference observed at month 12 (Figure 7C). Immunological remission observed in the GC/MRTX group at 12 months was markedly superior (89.47% vs. 34.38%, p = 0.001) (Figure 7D) to that in the SRTX group. B-cell depletion rates were comparable between the two groups (94.12% vs. 84.38% at 6 months, p = 0.609) (Figure 7E).
*Longitudinal clinical and immunologic responses in RMN. (A) Proteinuria: Faster reduction with GC/MRTX at months 1 and 12 (*p < 0.05). (B) Serum albumin: Comparable improvement in both groups. (C) Serum creatinine: Stable overall; significant difference at month 12 (p < 0.05). (D) Immunologic remission: GC/MRTX markedly superior at 6 and 12 months (p = 0.041 and p < 0.001). (E) B-cell depletion: Similar between groups.
Safety and tolerability
3.5
Both treatment regimens were well tolerated. The overall incidence of adverse events was similar between the GC/MRTX group (20% [5/25]) and the SRTX group (22% [11/50], p = 0.792) (Table 6). The most common events were infections (20% vs. 12%, p = 0.479), including respiratory tract infections (12% vs. 6%, p = 0.665) and urinary tract infections (8% vs. 6%, p = 1.000). All infections were mild and resolved with oral antibiotics. Leukopenia was rare, occurring in 0/25 (0%) patients in the GC/MRTX group and 1/50 (2.0%) in the SRTX group (p = 1.000). No serious adverse events occurred in either group.
Discussion
4
In this propensity score–matched multicenter retrospective study, we evaluated an exposure-optimized strategy comprising modified-interval RTX, a structured glucocorticoid taper, and subsequent TDM-guided redosing. This strategy was associated with higher and earlier complete remission, deeper immunologic responses, and lower relapse compared with the standard RTX regimen without concomitant glucocorticoids, with a comparable safety profile. Because multiple components were implemented as a package, the observed benefit should be interpreted at the strategy level, rather than attributed to the initial RTX schedule alone. Conceptually, the strategy was designed to mitigate the early 2–3 months pharmacokinetic vulnerability window by reinforcing and maintaining effective RTX exposure.
RTX has become a central therapy for PMN, yet remission rates across clinical trials and real-world studies remain inconsistent. Even among landmark randomized trials, CR rates varied substantially, ranging from approximately 16% in RI-CYCLO to nearly 60% in MENTOR (Fervenza et al., 2019; Scolari et al., 2021), despite similar diagnostic criteria adopted by the two trials. Our SRTX cohort demonstrated a 12-month CR rate of only 22%, closely mirroring the modest efficacy reported in several real-world studies (Gao et al., 2021; Zhang et al., 2023; Xu et al., 2025) and reinforcing that fixed oncologic dosing may not adequately address the distinctive immunologic and pharmacokinetic context of PMN.
Mechanistic insights increasingly suggest that suboptimal drug exposure may be an important contributor. Accelerated RTX clearance driven by urinary immunoglobulin loss, altered IgG metabolism, and heightened immunologic activity frequently leads to subtherapeutic concentrations within two to three months after infusion (Dahan et al., 2017; Fogueri et al., 2019; Boyer-Suavet et al., 2019; Hartinger et al., 2024). Prospective pharmacokinetic analyses consistently show early B-cell reconstitution and rebounds in anti-PLA2R titers as RTX levels decline (Dahan et al., 2017; Beck et al., 2011; Ruggenenti et al., 2015). Our multicenter pharmacokinetic monitoring corroborates these observations: more than 70% of patients exhibited insufficient RTX exposure, and 25% developed ARAs, with serum levels dropping precisely during the period when immunologic rebound is most likely. These findings highlight a structural vulnerability in SRTX regimens and provide plausible mechanistic context for therapeutic inconsistency (Seitz-Polski et al., 2019; Teisseyre et al., 2021). Real-world evidence from Chinese centers further reflects this heterogeneity, with remission outcomes differing substantially despite similar patient characteristics. Variability across centers was closely linked to differences in dosing intensity and baseline immunologic burden (Gao et al., 2021; Zhang et al., 2023; Xu et al., 2025), supporting the concept that inconsistent RTX exposure, rather than intrinsic drug resistance, largely determines treatment outcome. Collectively, these observations underscore the need for exposure-optimized RTX strategies that align more closely with the pharmacokinetic behavior of the drug in PMN.
The GC/MRTX regimen was therefore designed to reinforce RTX exposure during the early pharmacokinetic vulnerability window through an intensified initial course (days 1, 15, 30, and 120) followed by pharmacokinetic-guided maintenance dosing based on serum RTX monitoring every 3 months, with additional infusions administered when concentrations fell below 2 μg/mL. This exposure-optimized approach was integrated with short-term glucocorticoid tapering to enhance early disease control (Li et al., 2024). In this multicenter propensity-matched cohort, GC/MRTX achieved substantially higher and earlier remission than SRTX. At 12 months, CR was 64% with GC/MRTX—nearly threefold higher than that achieved with SRTX and exceeding the CR rates reported in most major RTX trials (Fervenza et al., 2019; Scolari et al., 2021; Fernández-Juárez et al., 2021). Immunologic remission occurred earlier and more consistently with GC/MRTX, demonstrating that maintaining adequate RTX exposure is consistent with improved suppression of anti-PLA2R antibodies and durable immunologic control. Peripheral B-cell depletion assessed by a dichotomized CD19^+^ threshold (<5 cells/μL) was similar between groups at months 6 and 12. However, this binary measure at scheduled visits does not capture depletion depth or time-to-reconstitution. Therefore, we interpret these depletion data descriptively and avoid mechanistic attribution based on peripheral depletion status. Importantly, the advantages of GC/MRTX extended beyond the 12-month framework. During longer follow-up, CR and near-complete remission remained higher in the GC/MRTX group, and relapse occurred only in SRTX recipients. Although follow-up intervals varied in real-world practice, the persistence of benefit across both clinical and immunologic domains supports the durability of the GC/MRTX strategy. Early reductions in proteinuria and improvements in serum albumin were also more pronounced, consistent with the hypothesis that short-term glucocorticoids may stabilize glomerular permeability during the lag period before RTX exerts full immunologic effects (Li et al., 2024).
The benefits of GC/MRTX were particularly evident in patients with refractory disease. Previous studies reported limited efficacy of RTX in this population, often with CR rates below 20%–30% (Gao et al., 2021; Zhang et al., 2023; Xu et al., 2025). In contrast, GC/MRTX achieved a 12-month CR rate of 52.6% in refractory patients, substantially outperforming both SRTX (18.8%) and most historical RTX regimens (Gao et al., 2021; Zhang et al., 2023; Xu et al., 2025). These findings support an emerging paradigm: many cases labeled “refractory” may reflect inadequate RTX exposure rather than true immunologic nonresponsiveness, however, this interpretation remains hypothesis-generating in this retrospective study with a multi-component intervention. This is also consistent with reports of robust responses to more potent anti-CD20 agents such as obinutuzumab in RTX-poor responders (Su et al., 2025).
This study has limitations. Residual confounding cannot be fully excluded given the retrospective design despite propensity score matching. B-cell monitoring was limited to a dichotomized peripheral CD19^+^ depletion status at scheduled visits, precluding assessment of depletion depth, duration, and time-to-reconstitution. Heterogeneity may have arisen from variability in visit timing, monitoring frequency, treatment adherence, and incomplete capture of long-term follow-up across centers. Retreatment/redosing patterns also differed between groups, introducing potential confounding by treatment intensity and indication. Although GC/MRTX was “structured” as a prespecified strategy framework (planned RTX time points, prednisone taper milestones, and TDM-guided redosing rules), real-world implementation was imperfect, with common timing deviations (predominantly delays), particularly for later infusions, which may have altered intended exposure coverage and affected PK, immune control, and outcomes. These impacts cannot be quantified retrospectively; thus, findings are strategy-level associations requiring prospective RCT validation.
Building upon these promising findings, we have already initiated a prospective, multicenter randomized controlled trial across the province to prospectively evaluate these results and evaluate long-term outcomes. Our work ultimately aims to establish a new, more effective treatment paradigm to improve clinical management for patients with PMN.
Conclusion
5
In this propensity score–matched multicenter retrospective cohort, an exposure-optimized strategy combining interval RTX dosing, structured glucocorticoid tapering, and TDM-guided redosing was associated with higher and faster complete remission, deeper immunologic response, and lower relapse in PMN, including refractory cases. These findings support further prospective evaluation to confirm efficacy and clarify the independent contributions of strategy components before changes in practice are recommended.
The reference list from the paper itself. Each links out to its DOI / PubMed record.
- 1Beck L. H.Jr Bonegio R. G. Lambeau G. Beck D. M. Powell D. W. Cummins T. D. (2009). M-type phospholipase A 2 receptor as target antigen in idiopathic membranous nephropathy. N. Engl. J. Med. 361 (1), 11–21. 10.1056/NEJ Moa 0810457 19571279 PMC 2762083 · doi ↗ · pubmed ↗
- 2Beck L. H.Jr Fervenza F. C. Beck D. M. Bonegio R. G. B. Malik F. A. Erickson S. B. (2011). Rituximab-induced depletion of anti-PLA 2R autoantibodies predicts response in membranous nephropathy. J. Am. Soc. Nephrol. 22 (8), 1543–1550. 10.1681/ASN.2010111125 21784898 PMC 3148709 · doi ↗ · pubmed ↗
- 3Bomback A. S. Derebail V. K. Mc Gregor J. G. Kshirsagar A. V. Falk R. J. Nachman P. H. (2009). Rituximab therapy for membranous nephropathy: a systematic review. Clin. J. Am. Soc. Nephrol. 4 (4), 734–744. 10.2215/CJN.05231008 19279120 PMC 2666426 · doi ↗ · pubmed ↗
- 4Boyer-Suavet S. Andreani M. Lateb M. Savenkoff B. Brglez V. Benzaken S. (2019). Neutralizing anti-rituximab antibodies and relapse in membranous nephropathy treated with rituximab. Front. Immunol. 10, 3069. 10.3389/fimmu.2019.03069 31998325 PMC 6970431 · doi ↗ · pubmed ↗
- 5Couser W. G. (2017). Primary membranous nephropathy. Clin. J. Am. Soc. Nephrol. 12 (6), 983–997. 10.2215/CJN.11761116 28550082 PMC 5460716 · doi ↗ · pubmed ↗
- 6Dahan K. Debiec H. Plaisier E. Cachanado M. Rousseau A. Wakselman L. (2017). Rituximab for severe membranous nephropathy: a 6-month trial with extended follow-up. J. Am. Soc. Nephrol. 28 (1), 348–358. 10.1681/ASN.2016040449 27352623 PMC 5198292 · doi ↗ · pubmed ↗
- 7Fernández-Juárez G. Rojas-Rivera J. van de Logt A. -E. Justino J. Sevillano A. Caravaca-Fontán F. (2021). Sequential tacrolimus–rituximab vs cyclophosphamide–glucocorticoids in primary membranous nephropathy (STARMEN). Kidney Int. 99 (4), 986–998. 10.1016/j.kint.2020.10.014 33166580 · doi ↗ · pubmed ↗
- 8Fervenza F. C. Appel G. B. Barbour S. J. Rovin B. H. Lafayette R. A. Aslam N. (2019). Rituximab or cyclosporine in the treatment of membranous nephropathy (MENTOR). N. Engl. J. Med. 381 (1), 36–46. 10.1056/NEJ Moa 1814427 31269364 · doi ↗ · pubmed ↗