Conditional survival in glioblastoma: The evolution of prognostic factors over time
Timothy Mueller, Flavio Vasella, Julia Velz, Stefanos Voglis, Kevin Akeret, Luis Padevit, Morton Schubert, Jonathan Weller, Sarah Brüningk, Elisabeth Rushing, Johannes Sarnthein, Dorothee Gramatzki, Levin Häni, Andreas Raabe, Anna M. Zeitlberger, Oliver Bozinov, Emilie Le Rhun

TL;DR
This study examines how survival rates and prognostic factors for glioblastoma change over time, showing that different factors influence outcomes at different stages after diagnosis.
Contribution
The study introduces conditional survival analysis to show how prognostic factors for glioblastoma evolve over time, offering new insights for risk stratification in clinical trials.
Findings
Conditional survival estimates decrease initially but show improvement at 24 months post-diagnosis.
Residual tumor volume is a key early predictor, while MGMT methylation and age become more significant later.
Age, MGMT status, and postoperative tumor volume are baseline prognostic markers for glioblastoma.
Abstract
Conditional survival provides insights into the evolution of prognosis over time and reveals changing associations of prognostic factors during disease progression. Data on the temporal evolution of prognostic factors in glioblastoma remain scarce. We analyzed 315 patients with IDH‐wildtype glioblastoma from a prospectively collected registry (01/2008–06/2017). Our primary outcome was 12‐month conditional survival (CS), defined as the probability of surviving the next 12 months given survival for “s” months. This analysis was conducted at five landmarks (s = 0, 6, 12, 18, 24) for baseline prognostic factors, including tumor volume compartments. 12‐month conditional survival estimates at s = 0, 6, 12, 18, and 24 months from diagnosis were 0.51 (95% CI 0.45–0.56), 0.46 (95% CI 0.39–0.52), 0.41 (95% CI 0.33–0.49), 0.43 (95% CI 0.33–0.52), and 0.56 (95% CI 0.42–0.67), respectively. At…
Genes, proteins, chemicals, diseases, species, mutations and cell lines named across the full text — each resolved to its canonical identifier and authoritative record.
Click any figure to enlarge with its caption.
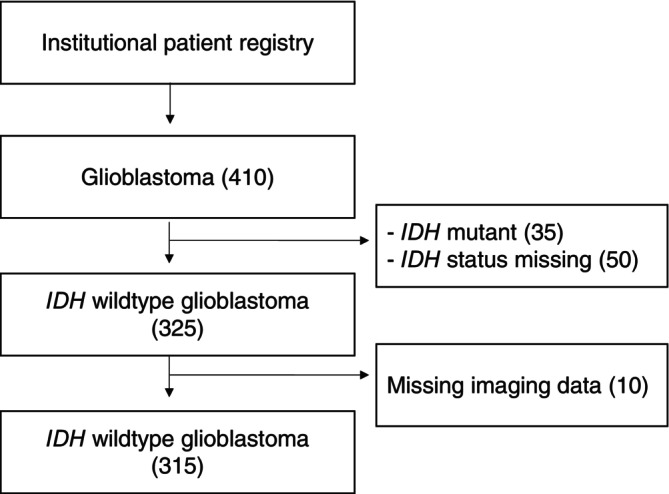 FIGURE 1
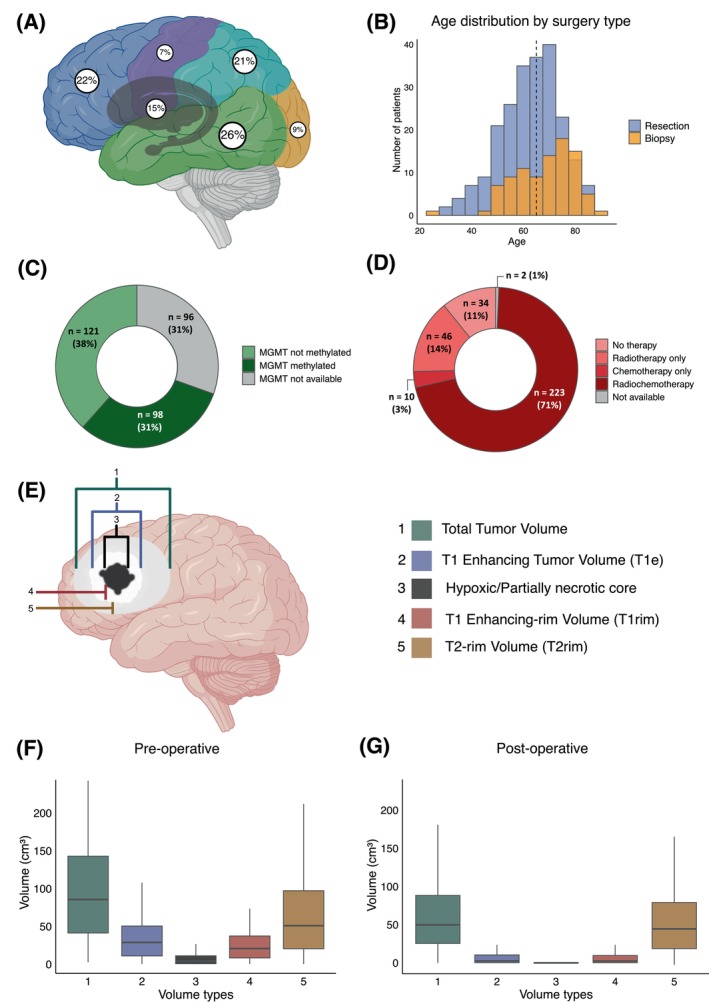 FIGURE 2
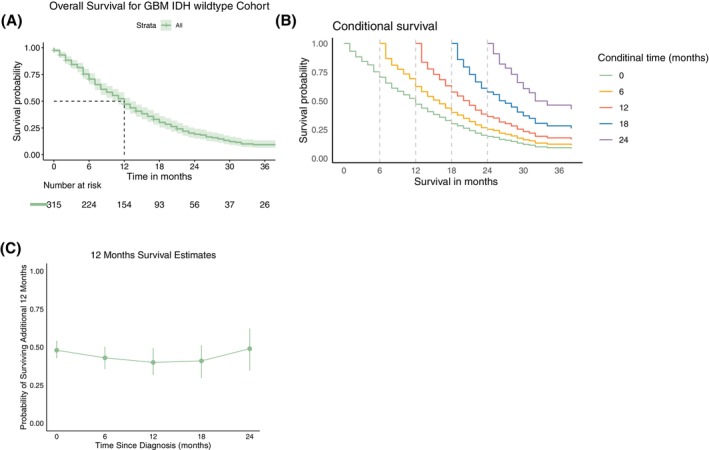 FIGURE 3
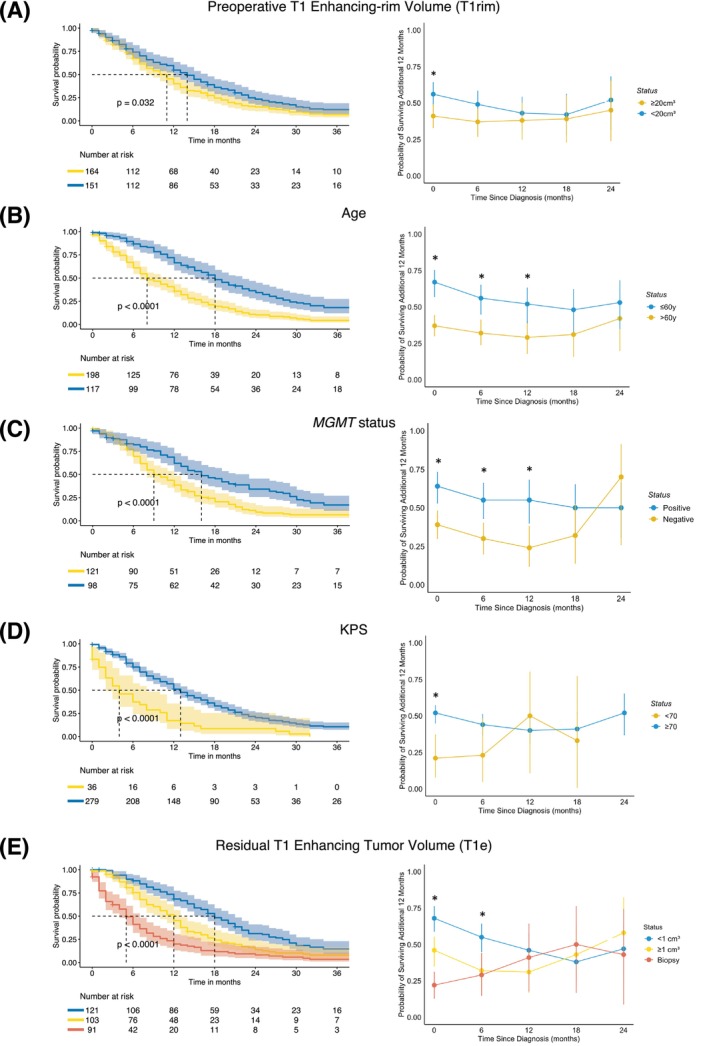 FIGURE 4
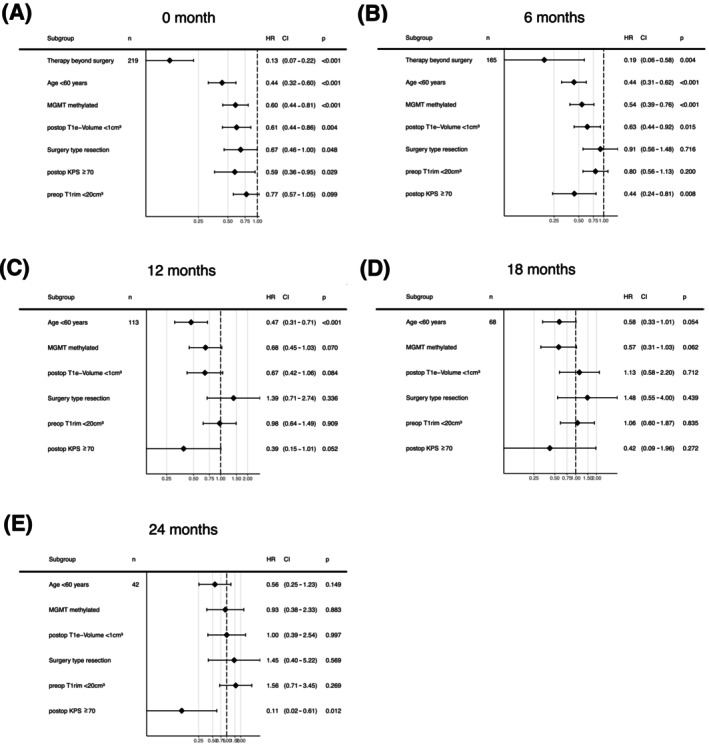 FIGURE 5
| Characteristics | ||
|---|---|---|
| Sex | ||
| Female | 103 (33%) | |
| Male | 212 (67%) | |
| Age | 64 (23–90) | |
| Tumor side | ||
| Left | 123 (39%) | |
| Right | 140 (44%) | |
| Both | 52 (17%) | |
| Tumor location | ||
| Temporal | 81 (26%) | |
| Frontal | 70 (22%) | |
| Parietal | 67 (21%) | |
| Central gray | 47 (15%) | |
| Occipital | 28 (9%) | |
| Central (perirolandic) | 22 (7%) | |
| Molecular status | ||
| MGMT unmethylated | 121 (38%) | |
| MGMT methylated | 98 (31%) | |
| MGMT unknown | 96 (30%) | |
| Therapy beyond surgery | ||
| No therapy | 34 (11%) | |
| Chemoradiotherapy and chemotherapy maintenance (standard of care) | 223 (71%) | |
| Radiotherapy only | 46 (14%) | |
| Chemotherapy only | 10 (3%) | |
| Not available | 2 (1%) | |
Peer Reviews
No public reviews on file for this paper yet. If you reviewed it on a platform where reviews are public (OpenReview, ICLR, NeurIPS, ICML), you can paste yours below so the community can read it here.
Videos
No videos yet. Explain this paper in a talk, walkthrough, or lecture? Add one.
Taxonomy
TopicsGlioma Diagnosis and Treatment · Brain Metastases and Treatment · Mathematical Biology Tumor Growth
INTRODUCTION
1
Most glioblastoma risk stratification systems incorporate known disease‐ and patient‐specific risk factors at the time of diagnosis.1, 2 Although these survival estimates are important for predicting survival for newly diagnosed patients, it remains unclear whether the same risk factors retain their prognostic association throughout the disease course. Conditional survival (CS), defined as the probability that a person will survive an additional number of months after having survived “s” months, provides a dynamic and updated prediction of survival over the disease course which can guide treatment strategies and prognostication.3 CS estimates have been reported lately for a wide range of tumor types and stages.4, 5, 6 Some authors have studied the conditional probabilities of survival in patients with brain tumors. These reports, however, included patients diagnosed decades ago—the vast majority of patients far prior to the era of temozolomide (TMZ) and molecular markers.7, 8, 9 For investigating CS, it is necessary to ensure long‐term follow‐up as well as constant treatment modalities over time.3 Over the last decade, the definition of glioblastomas has been sharpened by the exclusion of mutations in the isocitrate dehydrogenase (IDH1 or IDH2) and histone H3 genes.10 O^6^‐methylguanine‐DNA methyltransferase (MGMT) promoter methylation has been established as a predictive marker for benefit from alkylating chemotherapy.11 Although there are no definitive prospective studies, several retrospective publications indicate that safe surgical resection with minimal or no residual tumor volume is associated with longer overall survival.1, 12, 13 The debate continues over whether this association is linked solely to contrast‐enhancing disease or also includes T2/Flair‐hyperintense residual tumor.1 The relationship between preoperative tumor volume and survival is less clear. This study aimed to estimate CS at 6–24 months from diagnosis in a large cohort of patients with IDH‐wildtype glioblastoma treated with standard microsurgical resection14 or biopsy15 followed by chemoradiotherapy.16
METHODS
2
Patient selection and clinical status
2.1
We included all consecutive patients that were diagnosed with glioblastoma, IDH wildtype, CNS WHO grade 4, in accordance with the WHO 2021 definition of glioblastoma,10 who were treated at our Neurosurgery Department at the University Hospital Zurich. Clinical information was extracted from the department's prospective patient registry.17 Patients with unavailable preoperative MRI studies or unavailable postoperative MRI imaging within 72 h were excluded. For biopsy patients, only the preoperative MRI scan was required for inclusion (Figure 1). Preoperative Karnofsky performance status (KPS) score was defined as the baseline general status of the patient before admission and symptom onset.
Flowchart of patient inclusion.
Molecular characterization and tumor location
2.2
As part of routine clinical diagnostics, the presence of an IDH mutation was evaluated with either immunohistochemistry or mutation‐specific polymerase chain reaction (PCR). Immunohistochemistry with a specific monoclonal antibody for the IDH1 R132H mutation was performed as described by Capper et al.18 Hotspots—R132 (arginine‐132) for IDH1 and R172 (arginine‐172) for IDH2—were evaluated using IDH1/Exon4 and IDH2/Exon4‐specific primers and PCR. If no mutation was detected in the examined gene regions, the tumor was classified as IDH wildtype. MGMT promoter methylation was determined by methylation‐specific PCR.19
Tumor volumetric analysis
2.3
Pre‐ and postoperative tumor volumes were determined in each case using T1 enhancing (T1e) and T2/FLAIR image series. Based on the T1e and FLAIR/T2 volumes, tumor volumes were grouped into 5 categories: (1) total tumor volume (including hypoxic/necrotic core, T1e and FLAIR/T2 volumes), (2) T1e tumor volume (including hypoxic/necrotic core), (3) partially necrotic/hypoxic volume (hypointense on T1), (4) T1 enhancing rim volume (T1e rim), (5) FLAIR/T2 rim volume (Figure 2). Volumetric analysis of tumors was performed using iPlan Net® (Brainlab AG, Munich, Germany). Contrast‐enhancing and FLAIR/T2 rim volumes (volumes 4 and 5) were calculated by subtracting the more internal tumor volumes.
Baseline patient and tumor markers. (A) Distribution of tumor locations. (B) Histogram showing age and surgery type distribution within the cohort (dotted line = median age of 64 years) (C) MGMT status. (D) Distribution of therapies beyond surgery. (E) Schematic illustration of different tumor compartments and resulting tumor volumes investigated in this study. (F) Distribution of preoperative tumor volumes as defined in (E). (G) Distribution of preoperative tumor volumes as defined in (E).
Statistical analysis
2.4
All data processing and analysis steps were performed with R Studio (Version 4.3.3, R Studio Inc.) using open‐source libraries. In the initial phase of our analysis, we studied clinical, molecular, and volumetric factors at baseline that were associated with overall survival using the log‐rank test. For both pre‐ and postoperative tumor volumes, cut‐off values were determined through stepwise univariate analysis. Kaplan–Meier survival curves were generated to visualize OS for the entire cohort as well as across subgroups defined by the identified prognostic markers at baseline. We then calculated CS, defined as the probability of surviving an additional t months given survival of s months, denoted as CS (t|s). Specifically, we plotted the 12‐month CS, CS (12|s), representing the probability of surviving 12 months after having already survived s months (where s = 6, 12, 18, 24). This was performed for the entire cohort and for subgroups stratified by significant prognostic markers at baseline. The differences in 12‐month CS estimates between these subgroups were tested using the z‐test at each specific CS time point s.
Furthermore, univariate significant baseline prognostic factors were tested using a multivariate Cox proportional hazards model. In a multivariate landmark analysis20 these factors were also tested using a Cox proportional hazards model at 6‐, 12‐, 18‐, and 24‐months after surgery. Statistical significance was defined as p <.05, with Bonferroni multiple testing correction applied in the univariate setting.
RESULTS
3
Baseline characteristics
3.1
We included 315 patients diagnosed with glioblastoma, IDH wildtype between January 2008 and June 2017; 50 histologically defined glioblastomas were excluded because of missing IDH mutation status (Figure 1). The median age was 64 (range: 23–90) years, and 103 patients (33%) were females. The median OS from diagnosis for the entire cohort was 12 months (95% CI 11–13) (Table 1). Ninety‐one patients (29%) died within 6 months from diagnosis; 154 (49%), 93 (30%), and 56 (18%) patients were alive at 12, 18, and 24 months from diagnosis, respectively.
Conditional survival
3.2
Median CS estimates for s = 0, 6, 12, 18, and 24 months from diagnosis were 12 (95% CI 11–13), 16 (95% CI 14–18), 21 (95% CI 19–23), 27 (95% CI 24–30), and 33 (95% CI: 30–42) (Figure 3A/B). Twelve‐month CS estimates at s = 0, 6, 12, 18, and 24 months from diagnosis were 0.51 (95% CI 0.45–0.56), 0.46 (95% CI 0.39–0.52), 0.41 (95% CI 0.33–0.49), 0.43 (95% CI 0.33–0.52), and 0.56 (95% CI 0.42–0.67), respectively. The conditional probability of surviving an additional year after reaching 24 months post‐diagnosis thus exceeded the 12‐month survival rate at baseline (Figure 3C).
Kaplan–Meier estimator of OS and conditional survival analysis of the entire cohort (n = 315). (A) Kaplan–Meier estimate of overall survival (green line) including the 95% CI intervals (lighter green area) and median OS (dashed black line). (B) Conditional survival curves at 0–24 months from diagnosis. The lower curve (green) coincides with the OS curve in panel (A), whereas the upper curve (purple) for instance provides the survival under the condition that a patient has already survived 24 months. Conditional time points are 6, 12, 18 and 24 (dashed black). (C) 12‐month conditional survival estimates (and 95% CI) at diagnosis and at 6–24 months since diagnosis.
Univariate analysis of prognostic factors at baseline
3.3
On univariate analysis, age ≤60 (HR = 0.48 [95% CI = 0.37–0.61], p <.001), surgery type (resection versus biopsy) (HR = 0.44 [95% CI = 0.34–0.57], p <.001), postoperative residual T1 enhancing tumor volume (<1 cm^3^) (HR = 0.53 [95% CI = 0.42–0.68], p = <.001), postoperative KPS ≥70 (HR = 0.39 [95% CI = 0.27–0.56], p = .001), methylated MGMT promoter (HR = 0.57 [95% CI = 0.43–0.76], p = <.001), treatment beyond surgery (chemo and/or radiotherapy) (HR = 0.09 [95% CI = 0.06–0.14], p <.001) and preoperative T1 enhancing‐rim tumor volume (<20 cm^3^) (HR = 0.77 [95% CI = 0.61–0.98], p = 0.032), were associated with increased survival at baseline. Sex, preoperative total, T1 enhancing, T2‐rim and partially necrotic core tumor volumes along with postoperative T2 tumor volume were not associated with OS (Supplementary Tables S1 and S2).
Baseline prognostic factors over time (univariate)
3.4
The Kaplan–Meier estimator of OS and the 12‐month CS probability estimates at each time point s (= 6, 12, 18, 24 months) stratified by preoperative T1e tumor volume, age, MGMT promoter methylation status, postoperative KPS, and postoperative residual T1e tumor volume are shown in Figure 4. After the first few months after diagnosis, the initial survival advantage associated with smaller preoperative T1‐enhancing rim volumes (<20 cm^3^) diminished, and survival rates equalized with those of patients who had larger initial tumor volumes (>20 cm^3^) (Figure 4A). Patients who are ≤60 years at baseline had a rather constant 12‐month CS of about 0.60, whereas patients older than 60 years had lower 12‐month CS of about 0.30–0.4, with a decreasing gap between both groups over time (Figure 4B). Methylated MGMT promoter status was associated with an increased survival at baseline, with only a small decrement over time compared to unmethylated MGMT promoter tumors until the 12 months landmark and lost significance thereafter (Figure 4C). The initial association of a favorable survival outcome and a favorable performance score (KPS) no longer persisted beyond the 0 months landmark (Figure 4D). Gross total resection with little T1 enhancing residual tumor (<1 cm^3^) was associated with a longer OS at baseline with an effect magnitude that steadily decreased with additional months survived, also when compared to residual tumor ≥1 cm^3^ or biopsy only (Figure 4E).
*Kaplan–Meier estimates of OS (left side, including 95% CI) and 12‐month CS probability estimates (right side, including 95% CI) from each time point s (= 0, 6, 12, 18, 24 months) stratified by (A) Preoperative T1 enhancing‐rim tumor volume, (B) Age, (C) MGMT Promoter methylation status, (D) postoperative KPS score, and (E) post‐operative residual T1 enhancing tumor volume. Significant difference (p <.05).
Baseline prognostic factors over time (multivariate)
3.5
On multivariate analysis, age <60, surgery type (resection), preoperative T1 enhancing‐rim tumor volume (<20 cm^3^), MGMT promoter methylation, KPS >70 along with postoperative residual T1 enhancing tumor volume (<1 cm^3^) were associated with decreased OS at baseline (Figure 5A). In the multivariate landmark analysis at time points 6, 12, 18, and 24 months (Figure 5B–E), only age at diagnosis and MGMT promoter methylation approached significance at 18 months.
Multivariate analysis using Cox proportional hazard model estimating the hazard ratio for survival of baseline prognostic factors. (A) At baseline. (B) 6 months post‐surgery. (C) 12 months post‐surgery 12. (D) 18 months post‐surgery. (E) 24 months post‐surgery.
DISCUSSION
4
Our study provides a novel look at the analysis of clinical, surgical, and molecular factors at different time points, thereby illustrating the temporal evolution of prognostic factors in patients with glioblastoma. While selected variables assessed in the present study align with well‐established prognostic determinants at baseline,1 changes in the prognostic importance of different compartments of pre‐ and postoperative tumor volumes and molecular markers have not been explored in detail over time. Estimates of subsequent survival probabilities after a patient has survived for a certain number of months cannot be extrapolated from the standard Kaplan–Meier curve at baseline.
Consistent with previous studies,2, 13, 14, 21 we identified age, MGMT promoter methylation status, postoperative KPS, and postoperative enhancing tumor volume as baseline prognostic markers. Our detailed tumor compartment analysis revealed that preoperative T1‐enhancing rim volume serves as a baseline prognostic marker, potentially serving as a surrogate for vital tumor burden, also reflecting surrounding tumor infiltration. In contrast, neither the preoperative T2/FLAIR tumor volume, representing a mixture of vasogenic edema and tumor cell infiltration, nor the postoperative T2/FLAIR volume was associated with prognosis.
Previous reports on CS for glioblastoma patients involve tumors diagnosed over two decades ago,7, 8, 9 prior to molecular characterization (such as IDH mutation/MGMT promoter methylation) and current standard treatment regimens. In a histologically defined cohort of 498 glioblastoma patients, Polley et al.9 demonstrated that the 12‐month CS rate after surviving 1 year post‐diagnosis was 0.35 (95% CI: 0.29–0.40), which is comparable to our estimate of 0.41 (95% CI: 0.33–0.49). In a more recent report from the EORTC 1419 ETERNITY study, Hertler et al.22 found that MGMT promoter methylation, younger age, and gross total resection were significantly more common in patients who survived beyond 5 years compared to the general glioblastoma IDH wildtype population. However, their Cox regression analysis showed that none of these factors remained prognostic among long‐term survivors, suggesting that these prognostic factors have already exerted their association with survival after 5 years. With our 12‐month CS analysis, we demonstrate that predefined factors, such as patient age at diagnosis and the currently non‐modifiable MGMT promoter methylation status,23 maintain a consistent association with survival from diagnosis up to 18 months. Alternatively, the association of resection with minimal post‐operative tumor residual diminishes after the first 6 months. These findings are consistent with our multivariate landmark analysis, in which patient age <60 and MGMT promoter methylation approached significance for 18‐month survival.
Postoperative KPS <70 lost prognostic significance within the first 6 months, likely reflecting its role as a surrogate for preexisting severe and persistent impairment. Long‐term deterioration of clinical status, however, remains an important prognostic factor and may more reliably guide subsequent clinical decision‐making than a CS model based solely on postoperative KPS. A structured classification system, such as the Therapy‐Disability‐Neurology (TDN)24 could further enhance the assessment of baseline complications and help differentiate survival trajectories over time.
Several important limitations of this study should be acknowledged. The single‐center design and relatively small sample size limit the statistical power, particularly as the number of patients decreases at successive time points. This highlights an inherent challenge of CS analyses in highly aggressive malignancies such as glioblastoma, where the at‐risk population declines rapidly over time. Consequently, estimates derived at later intervals are based on progressively smaller subgroups and should be interpreted with caution.
Furthermore, our analysis was restricted to a limited number of clinical and molecular markers. Other alterations with known prognostic impact25, 26 (e.g., EGFR, PTEN, NF1, PDGFRA, TP53) were not included. Similarly, prognostic factors relevant in the later course of disease—such as tumor location, feasibility of local treatment at recurrence (re‐resection27 or re‐irradiation28), and salvage therapies like CCNU or bevacizumab,29, 30 were not systematically addressed. These increasingly complex and individualized treatment trajectories of long‐term glioblastoma survivors are not captured in our design, which limits the direct clinical applicability of our findings.
Future studies with larger, multicenter cohorts, broader molecular profiling, and more detailed treatment documentation are warranted to refine CS models and strengthen their value for patient management and counseling.
We conclude that the association of genetic, surgery‐related, and clinicopathologic factors with OS changes over time for glioblastoma patients. Specifically, residual tumor volume dominates prognosis in the months after surgery, whereas age at diagnosis and favorable MGMT status determine the prognosis thereafter. Findings may refine stratification strategies in recurrent glioblastoma trials.
AUTHOR CONTRIBUTIONS
Timothy Mueller: Conceptualization; methodology; formal analysis; data curation; writing – review and editing; writing – original draft; visualization. Flavio Vasella: Writing – review and editing; data curation. Julia Velz: Data curation; writing – review and editing. Stefanos Voglis: Data curation; writing – review and editing. Kevin Akeret: Data curation; writing – review and editing. Luis Padevit: Writing – review and editing; data curation. Jonathan Weller: Data curation; software. Sarah Brüningk: Validation; formal analysis. Elisabeth Rushing: Data curation. Johannes Sarnthein: Project administration; supervision. Dorothee Gramatzki: Writing – review and editing; data curation. Levin Häni: Writing – review and editing; conceptualization. Andreas Raabe: Writing – review and editing. Anna M. Zeitlberger: Writing – review and editing. Oliver Bozinov: Writing – review and editing; resources. Emilie Le Rhun: Writing – review and editing; conceptualization. Michael Weller: Conceptualization; writing – review and editing; resources. Luca Regli: Conceptualization; resources; writing – review and editing. Marian C. Neidert: Conceptualization; investigation; writing – review and editing; formal analysis; supervision; resources; writing – original draft; visualization; methodology. Morton Schubert: Data curation.
CONFLICT OF INTEREST STATEMENT
Prof. M. Weller reports receiving research grants from Versameb, Novartis, and Quercis. He has received honoraria for lectures and/or participation in advisory boards from Nuvation, Bayer, CureVac, Hemerion, Iqvia, Medac, Novartis, Orbus, Pfizer, Philogen, Roche, and Servier. Dr. E. le Rhun reports receiving research grants from BMS and Servier. She has received honoraria for lectures, participation in advisory boards, and consulting from AstraZeneca, Daiichi Sankyo, Bayer, Biodexa/ Sitoxi, Janssen, Leo Pharma, Medac, myTomorrows, Pfizer, Pierre Fabre, Roche, Seattle Genetics, and Servier. Prof. J. Sarnthein reports receiving honoraria for consulting or lectures from inomed. Prof. M.C. Neidert reports receiving a research grant from Novocure and honoraria for consulting or lectures from WISE, MSD, Osteopore, Servier, and Terumo. All other authors declare that they have no conflicts of interest.
ETHICS STATEMENT
The study was approved by the local ethical review board (“Kantonale Ethikkommission Zürich”, identifier PB‐2017‐00093), registered at clinicaltrials.gov (NCT01628406). Individual patient consent was waived.
Supporting information
Supplementary Table S1. Univariate analysis of pre‐ and postoperave tumor. Supplementary Table S2. Univariate analysis of baseline paent characteriscs.
The reference list from the paper itself. Each links out to its DOI / PubMed record.
- 1Karschnia P , Young JS , Dono A , et al. Prognostic validation of a new classification system for extent of resection in glioblastoma: a report of the RANO resect group. Neuro Oncol. 2023;25(5):940‐954. doi:10.1093/neuonc/noac 193 35961053 PMC 10158281 · doi ↗ · pubmed ↗
- 2Marko NF , Weil RJ , Schroeder JL , Lang FF , Suki D , Sawaya RE . Extent of resection of glioblastoma revisited: personalized survival modeling facilitates more accurate survival prediction and supports a maximum‐safe‐resection approach to surgery. J Clin Oncol. 2014;32(8):774‐782. doi:10.1200/JCO.2013.51.8886 24516010 PMC 4876349 · doi ↗ · pubmed ↗
- 3Zabor EC , Gonen M , Chapman PB , Panageas KS . Dynamic prognostication using conditional survival estimates. Cancer. 2013;119(20):3589‐3592. doi:10.1002/cncr.28273 23913639 · doi ↗ · pubmed ↗
- 4Skuladottir H , Olsen JH . Conditional survival of patients with the four major histologic subgroups of lung cancer in Denmark. J Clin Oncol. 2003;21(16):3035‐3040. doi:10.1200/JCO.2003.04.521 12915592 · doi ↗ · pubmed ↗
- 5Margonis GA , Buettner S , Andreatos N , et al. Prognostic factors change over time after hepatectomy for colorectal liver metastases: A multi‐institutional, international analysis of 1099 patients. Ann Surg. 2019;269(6):1129‐1137. doi:10.1097/SLA.0000000000002664 31082912 · doi ↗ · pubmed ↗
- 6Abdallah NH , Smith AN , Geyer S , et al. Conditional survival in multiple myeloma and impact of prognostic factors over time. Blood Cancer J. 2023;13(1):1‐8. doi:10.1038/s 41408-023-00852-4 37188699 PMC 10185675 · doi ↗ · pubmed ↗
- 7Lin CL , Lieu AS , Lee KS , et al. The conditional probabilities of survival in patients with anaplastic astrocytoma or glioblastoma multiforme. Surg Neurol. 2003;60(5):402‐406. doi:10.1016/s 0090-3019(03)00322-7 14572960 · doi ↗ · pubmed ↗
- 8Davis FG , Mc Carthy BJ , Freels S , Kupelian V , Bondy ML . The conditional probability of survival of patients with primary malignant brain tumors: surveillance, epidemiology, and end results (SEER) data. Cancer. 1999;85(2):485‐491.10023719 · pubmed ↗