Efficacy and safety of transcatheter aortic valve replacement for the treatment of pure severe native aortic valve regurgitation: a single-arm meta-analysis
Fuli Zhu, Guangyao Zhai, Shunan He, Zijing Liu, Zhe He

TL;DR
This study evaluates how effective and safe TAVR is for treating severe aortic valve regurgitation, finding it beneficial but with some risk factors affecting outcomes.
Contribution
A single-arm meta-analysis providing updated evidence on TAVR efficacy and safety for pure severe native aortic valve regurgitation.
Findings
TAVR device success rate was 87.5% with acceptable perioperative mortality rates.
Adverse events like stroke and kidney injury occurred in a small but notable percentage of patients.
Geographic location and procedural factors influence post-operative adverse event rates.
Abstract
Numerous studies have reported the efficacy and safety of transcatheter aortic valve replacement (TAVR) for pure severe native aortic valve regurgitation (psNAVR) in recent years; however, these studies show considerable variability in outcomes such as success rate and mortality. Therefore, this meta-analysis was conducted to evaluate the efficacy and safety of TAVR in patients with psNAVR based on the latest research evidence. Relevant studies were searched in four databases—PubMed, Embase, Web of Science, and the Cochrane Library—up to August 27, 2025. The primary outcomes were device success, all-cause mortality, and cardiovascular mortality during the perioperative period. Secondary outcomes included perioperative and 1-year post-operative adverse events, such as stroke, acute kidney injury (AKI), new-onset myocardial infarction, major vascular complications, major bleeding events,…
Genes, proteins, chemicals, diseases, species, mutations and cell lines named across the full text — each resolved to its canonical identifier and authoritative record.
Click any figure to enlarge with its caption.
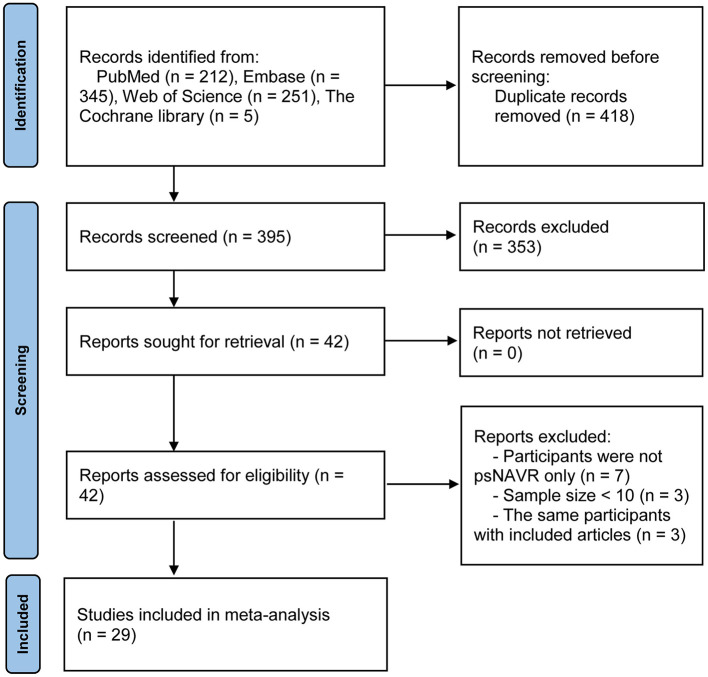 Figure 1
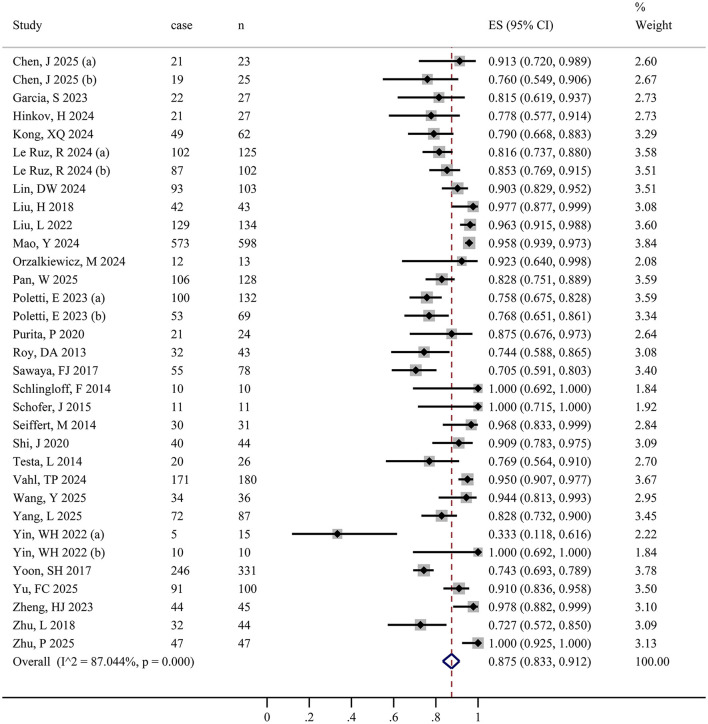 Figure 2
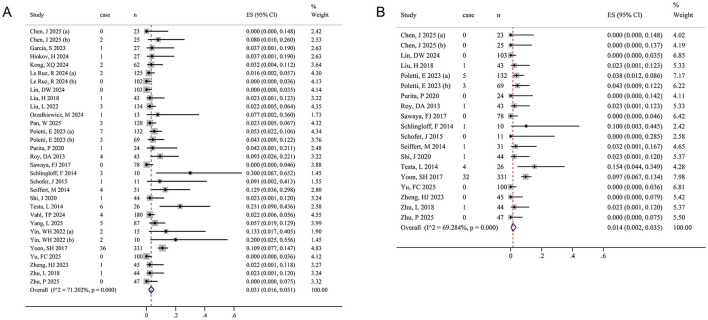 Figure 3
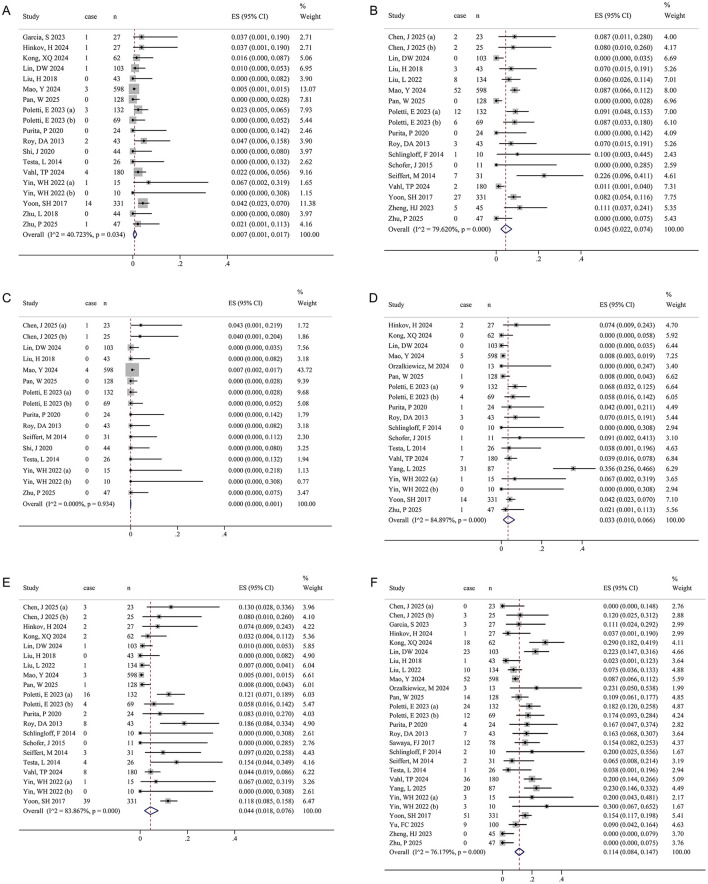 Figure 4
|
|
|
|
|
|
|
|
|
|
|
|
|
|---|---|---|---|---|---|---|---|---|---|---|---|
| Chen, J 2025 | China | RS | 18 | Bicuspid valve | High risk only | J-Valve | Third-generation AR-specific valve | TA | 23, 20/3 | 71 ± 11 | 15 (65.22) |
| High risk only | VitaFlow | Second -generation valve | TF | 25, 19/6 | 70 ± 7 | 8 (32.00) | |||||
| Garcia, S 2023 | USA | RS | 12 | Tricuspid valve (89%) | Not High risk only | J-Valve | Third-generation AR-specific valve | TF (21/27) | 27, 16/11 | 81 (72–85) | 26 (96.0) |
| Hinkov, H 2024 | Germany | RS | 12 | Tricuspid valve | Not High risk only | JenaValve Trilogy | Third-generation AR-specific valve | TF (25/27) | 27, 18/9 | 65.3 (36.8, 77.6) | NR |
| Kong, XQ 2024 | China | RS | 12 | Tricuspid valve | High risk only | VitaFlow | Second -generation valve | TF | 62, 36/26 | 71.56 ± 7.34 | 38 (61.3) |
| Le Ruz, R 2024 | France | PS | 12 | Bicuspid or Tricuspid valve | Not High risk only | CoreValve Evolut, SAPIEN 3 | Second -generation valve | TF (207/227) | 227, 146/81 | 81.0 (73.5–85.0) | 150 (77.3) |
| Lin, DW 2024 | China | RS | 6 | Bicuspid or Tricuspid valve | Not High risk only | Venus-A, VitaFlow | First-generation valve | TF | 103, 62/41 | 72.1 ± 8.1 | 87 (84.5) |
| Liu, H 2018 | China | RS | 12 | Tricuspid valve (95.3%) | High risk only | J-Valve | Third-generation AR-specific valve | TA | 43, 30/13 | 73.9 ± 5.7 | 14 (32.6) |
| Liu, L 2022 | China | RS | 12 | Tricuspid valve (93.3%) | High risk only | J-Valve | Third-generation AR-specific valve | TA | 134, 100/34 | 73.1 ± 6.4 | 131 (97.8) |
| Mao, Y 2024 | China | RS | 24 | Bicuspid or Tricuspid valve | Not High risk only | J-Valve | Third-generation AR-specific valve | TA | 598, 449/149 | 72.0 (66.0, 78.0) | 579 (96.8) |
| Orzalkiewicz, M 2024 | Italy | RS | 12 | Tricuspid valve | Not High risk only | Sapien 3 | Second -generation valve | TF | 13, 9/4 | 80.8 ± 5.6 | NR |
| Pan, W 2025 | China | PS | 1 | Bicuspid or Tricuspid valve | Not High risk only | Hanchor Valve | Third-generation AR-specific valve | TF | 128, 98/30 | 74 (70, 78) | 108 (84.4) |
| Poletti, E 2023 | Europe and USA | RS | 12 | Bicuspid or Tricuspid valve | High risk only | THVs | SEV or BEV | TF (192/201) | 201, 111/90 | 79 (73, 83) | 144 (76.2) |
| Purita, P 2020 | Europe | RS | 12 | Tricuspid valve (96%) | Not High risk only | ACURATE neo THV | Second -generation valve | TF | 24, 10/14 | 79.4 (50–88) | 23 (95.8) |
| Roy, DA 2013 | Worldwide | RS | 12 | Bicuspid or Tricuspid valve | High risk only | CoreValve | First-generation valve | TF (35/43) | 43, 20/23 | 75.3 ± 8.8 | 42 (97.7) |
| Sawaya, FJ 2017 | Worldwide | RS | 1 | Bicuspid or Tricuspid valve | Not High risk only | CoreValve, Evolut R, SAPIEN XT, SAPIEN 3, Lotus Valve System, Direct Flow, JenaValve | First/second-generation valve, third-generation AR-specific valve | TF (51/78) | 78, 46/32 | 74 ± 10 | NR |
| Schlingloff, F 2014 | Germany | RS | 12 | Bicuspid or Tricuspid valve | High risk only | JenaValve | Third-generation AR-specific valve | TA | 10, 6/4 | 82 (59–90) | 9 (90.0) |
| Schofer, J 2015 | Europe | RS | 1 | Bicuspid or Tricuspid valve | High risk only | Direct Flow | Second -generation valve | TF | 11, 4/7 | 78 (46–85) | 9 (88.9) |
| Seiffert, M 2014 | Germany | RS | 6 | Bicuspid or Tricuspid valve | High risk only | JenaValve | Third-generation AR-specific valve | TA | 31, 20/11 | 73.8 ± 9.1 | 12 (38.7) |
| Shi, J 2020 | China | PS | 24 | Tricuspid valve (95.5%) | High risk only | J-Valve | Third-generation AR-specific valve | TA | 44, 30/14 | 76.2 ± 5.5 | 44 (100) |
| Testa, L 2014 | Italy | RS | 12 | Bicuspid or Tricuspid valve | High risk only | CoreValve | First-generation valve | TF (21/26) | 26, 16/10 | 73 ± 10 | 25 (95) |
| Vahl, TP 2024 | USA | PS | 12 | Tricuspid valve | High risk only | JenaValve | Third-generation AR-specific valve | TF | 180, 95/85 | 75.5 ± 10.8 | 122 (68) |
| Wang, Y 2025 | China | PS | 60 | Tricuspid valve (97.2%) | High risk only | J-Valve | Third-generation AR-specific valve | TA | 36, 25/11 | 73.78 ± 5.96 | 35 (97.22) |
| Yang, L 2025 | China | RS | 1 | Tricuspid valve (94%) | Not High risk only | Venus A or VitaFlow valve | First-generation valve | TF | 87, 41/46 | 45 74.4 ± 8.4; 42 69.7 ± 7.8 | 38 (43.68) |
| Yin, WH 2022 | China | RS | 14 | Bicuspid or Tricuspid valve | High risk only | CoreValve, Lotus, and Spien XT | SEV | TF | 15, 11/4 | 72.0 ± 17.2 | 12 (80) |
| High risk only | Evolut R, J-valve | SEV | TF | 10, 7/3 | 72.8 ± 11.7 | 6 (60) | |||||
| Yoon, SH 2017 | Worldwide | RS | 12 | Bicuspid or Tricuspid valve | Not High risk only | CoreValve, Lotus, Spien XT, Evolut R, J-valve, et. al | SEV or BEV | TF (233/331) | 331, 172/159 | 74.4 ± 12.2 | 293 (88.5) |
| Yu, FC 2025 | China | PS | 1 | Bicuspid or Tricuspid valve | Not High risk only | VitaFlow | Second -generation valve | TF | 100, NR | 72.7 ± 7.2 | NR |
| Zheng, HJ 2023 | China | RS | 12 | Tricuspid valve (97.8%) | High risk only | Venus-A | First-generation valve | TF | 45, 33/12 | 73.5 ± 5.5 | 43 (95.6) |
| Zhu, L 2018 | China | RS | 6 | Tricuspid valve | High risk only | J-Valve | Third-generation AR-specific valve | TA | 44, 31/13 | 73.8 ± 5.6 | 43 (100) |
| Zhu, P 2025 | China | RS | 6 | Tricuspid valve (87.1%) | Not High risk only | J-Valve | Third-generation AR-specific valve | TA | 47, 35/12 | 73.0 ± 9.0 | 46 (97.9) |
|
|
|
|
| Heterogeneity test |
| |
|---|---|---|---|---|---|---|
| Device success | 33 | 2,773 | 0.875 (0.833, 0.912) | <0.001 | 87.0 | 0.367 |
| Total mortality | 31 | 2,139 | 0.031 (0.016, 0.051) | <0.001 | 71.2 | 0.349 |
| Cardiovascular disease mortality | 19 | 1,589 | 0.014 (0.002, 0.035) | <0.001 | 69.3 | 0.058 |
| Stroke | 19 | 1,953 | 0.007 (0.001, 0.017) | 0.034 | 40.7 | 0.891 |
| Acute kidney injury | 18 | 1,977 | 0.045 (0.022, 0.074) | <0.001 | 79.6 | 0.683 |
| New-onset Myocardial infarction | 16 | 1,361 | 0.000 (0.000, 0.001) | 0.934 | 0.0 | 0.892 |
| Major vascular complication | 19 | 1,916 | 0.033 (0.010, 0.066) | <0.001 | 84.9 | 0.461 |
| Major bleeding events | 21 | 2,025 | 0.044 (0.018, 0.076) | 0.001 | 83.9 | 0.333 |
| New permanent pacemaker implantation | 27 | 2,411 | 0.114 (0.084, 0.147) | <0.001 | 76.2 | 0.741 |
|
|
|
|
| Heterogeneity test |
| |
|---|---|---|---|---|---|---|
| Total mortality | 16 | 895 | 0.093 (0.065, 0.126) | 0.026 | 45.1 | 0.058 |
| Cardiovascular disease mortality | 9 | 342 | 0.043 (0.012, 0.088) | 0.021 | 55.8 | 0.714 |
| Stroke | 4 | 199 | 0.026 (0.005, 0.056) | 0.911 | 0.0 | 0.051 |
| Acute kidney injury | 2 | 120 | 0.091 (0.044, 0.151) | NA | NA | NA |
| New-onset myocardial infarction | 6 | 328 | 0.000 (0.000, 0.010) | 0.459 | 0.0 | 0.350 |
| Major bleeding events | 4 | 164 | 0.016 (0.000, 0.047) | 0.413 | 0.0 | 0.536 |
| Readmission due to heart failure | 6 | 148 | 0.190 (0.066, 0.351) | 0.001 | 75.2 | 0.156 |
| New permanent pacemaker implantation | 6 | 327 | 0.100 (0.029, 0.200) | <0.001 | 81.7 | 0.861 |
|
|
|
| Heterogeneity test | |
|---|---|---|---|---|
|
| ||||
| Total | 33 | 0.875 (0.833, 0.912) | <0.001 | 87.0 |
|
| <0.001 | |||
| China | 17 | 0.900 (0.849, 0.942) | <0.001 | 85.0 |
| Western | 13 | 0.870 (0.811, 0.920) | <0.001 | 73.2 |
| Worldwide | 3 | 0.738 (0.696, 0.778) | NA | NA |
|
| 0.443 | |||
| RS | 26 | 0.870 (0.814, 0.917) | <0.001 | 88.9 |
| PS | 7 | 0.889 (0.839, 0.931) | 0.002 | 71.5 |
|
| 0.773 | |||
| High risk only | 19 | 0.883 (0.821, 0.934) | <0.001 | 83.3 |
| Not high risk only | 14 | 0.865 (0.801, 0.919) | <0.001 | 90.6 |
|
| <0.001 | |||
| SEV | 27 | 0.892 (0.849, 0.929) | <0.001 | 84.0 |
| BEV | 4 | 0.833 (0.788, 0.874) | 0.458 | 0.0 |
| SEV or BEV | 2 | 0.737 (0.693, 0.779) | NA | NA |
|
| <0.001 | |||
| TA | 10 | 0.952 (0.913, 0.981) | 0.001 | 68.0 |
| TF | 13 | 0.881 (0.819, 0.933) | <0.001 | 78.2 |
| Multi-approach | 10 | 0.773 (0.744, 0.801) | 0.395 | 4.9 |
|
| 0.896 | |||
| Moderate | 19 | 0.872 (0.818, 0.919) | <0.001 | 80.8 |
| Low | 14 | 0.877 (0.808, 0.934) | <0.001 | 91.0 |
|
| 0.127 | |||
| First | 3 | 0.853 (0.642, 0.984) | NA | NA |
| Second | 8 | 0.861 (0.813, 0.903) | 0.153 | 34.5 |
| CADE | 16 | 0.908 (0.858, 0.950) | <0.001 | 86.0 |
| Multiple | 6 | 0.785 (0.671, 0.882) | <0.001 | 85.7 |
|
| ||||
| Total | 31 | 0.031 (0.016, 0.051) | <0.001 | 71.2 |
|
| 0.164 | |||
| China | 15 | 0.017 (0.004, 0.034) | 0.024 | 44.7 |
| Western | 13 | 0.044 (0.016, 0.082) | <0.001 | 67.6 |
| Worldwide | 3 | 0.051 (0.000, 0.167) | NA | NA |
|
| 0.001 | |||
| RS | 25 | 0.042 (0.022, 0.068) | <0.001 | 67.7 |
| PS | 6 | 0.011 (0.002, 0.023) | 0.227 | 27.7 |
|
| 0.045 | |||
| High risk only | 18 | 0.046 (0.024, 0.072) | 0.007 | 51.0 |
| Not high risk only | 13 | 0.016 (0.001, 0.044) | <0.001 | 81.8 |
|
| 0.033 | |||
| SEV | 25 | 0.032 (0.016, 0.053) | <0.001 | 60.5 |
| BEV | 4 | 0.015 (0.000, 0.054) | 0.056 | 60.3 |
| SEV or BEV | 2 | 0.075 (0.051, 0.103) | NA | NA |
|
| 0.851 | |||
| TA | 8 | 0.026 (0.003, 0.064) | 0.030 | 54.9 |
| TF | 13 | 0.023 (0.005, 0.049) | 0.005 | 57.2 |
| Multi-approach | 10 | 0.042 (0.012, 0.085) | <0.001 | 82.8 |
|
| 0.655 | |||
| Moderate | 19 | 0.028 (0.012, 0.049) | 0.003 | 54.3 |
| Low | 12 | 0.037 (0.008, 0.078) | <0.001 | 82.7 |
|
| 0.370 | |||
| First | 3 | 0.095 (0.011, 0.231) | NA | NA |
| Second | 8 | 0.013 (0.000, 0.042) | 0.028 | 55.4 |
| CADE | 14 | 0.026 (0.012, 0.043) | 0.135 | 30.2 |
| Multiple | 6 | 0.042 (0.000, 0.122) | <0.001 | 88.3 |
|
| ||||
| Total | 19 | 0.014 (0.002, 0.035) | <0.001 | 69.3 |
|
| 0.004 | |||
| China | 9 | 0.001 (0.000, 0.010) | 0.663 | 0.0 |
| Western | 7 | 0.032 (0.009, 0.065) | 0.322 | 14.1 |
| Worldwide | 3 | 0.030 (0.000, 0.124) | NA | NA |
|
| 0.108 | |||
| RS | 17 | 0.016 (0.002, 0.039) | <0.001 | 68.1 |
| PS | 2 | 0.002 (0.002, 0.022) | NA | NA |
|
| 0.236 | |||
| High risk only | 13 | 0.022 (0.009, 0.039) | 0.472 | 0.0 |
| Not high risk only | 6 | 0.006 (0.000, 0.049) | <0.001 | 89.3 |
|
| 0.002 | |||
| SEV | 16 | 0.008 (0.000, 0.023) | 0.073 | 36.4 |
| BEV | 1 | 0.043 (0.009, 0.122) | NA | NA |
| SEV or BEV | 2 | 0.067 (0.044, 0.094) | NA | NA |
|
| 0.004 | |||
| TA | 7 | 0.012 (0.000, 0.036) | 0.639 | 0.0 |
| TF | 6 | 0.000 (0.000, 0.002) | 0.980 | 0.0 |
| Multi-approach | 6 | 0.044 (0.012, 0.092) | <0.001 | 78.3 |
|
| 0.428 | |||
| Moderate | 14 | 0.008 (0.000, 0.020) | 0.304 | 13.7 |
| Low | 5 | 0.033 (0.000, 0.107) | <0.001 | 87.4 |
|
| 0.085 | |||
| First | 3 | 0.035 (0.000, 0.144) | NA | NA |
| Second | 4 | 0.000 (0.000, 0.006) | 0.895 | 0.0 |
| CADE | 9 | 0.021 (0.007, 0.040) | 0.725 | 0.0 |
| Multiple | 3 | 0.017 (0.000, 0.112) | NA | NA |
|
| ||||
| Total | 19 | 0.007 (0.001, 0.017) | 0.034 | 40.7 |
|
| <0.001 | |||
| China | 10 | 0.000 (0.000, 0.003) | 0.592 | 0.0 |
| Western | 7 | 0.011 (0.002, 0.025) | 0.632 | 0.0 |
| Worldwide | 2 | 0.039 (0.021, 0.063) | NA | NA |
|
| 0.327 | |||
| RS | 16 | 0.009 (0.001, 0.021) | 0.044 | 41.1 |
| PS | 3 | 0.005 (0.000, 0.026) | NA | NA |
|
| 0.956 | |||
| High risk only | 11 | 0.007 (0.001, 0.018) | 0.608 | 0.0 |
| Not High risk only | 8 | 0.010 (0.000, 0.029) | 0.003 | 67.7 |
|
| 0.001 | |||
| SEV | 16 | 0.004 (0.000, 0.011) | 0.385 | 6.0 |
| BEV | 2 | 0.000 (0.000, 0.009) | NA | NA |
| SEV or BEV | 1 | 0.042 (0.023, 0.070) | NA | NA |
|
| 0.005 | |||
| TA | 5 | 0.001 (0.000, 0.006) | 0.781 | 0.0 |
| TF | 7 | 0.003 (0.000, 0.014) | 0.369 | 7.8 |
| Multi-approach | 7 | 0.022 (0.008, 0.040) | 0.297 | 17.5 |
|
| 0.571 | |||
| Moderate | 11 | 0.006 (0.000, 0.017) | 0.327 | 12.3 |
| Low | 8 | 0.008 (0.000, 0.027) | 0.009 | 62.8 |
|
| 0.121 | |||
| First | 2 | 0.021 (0.000, 0.077) | NA | NA |
| Second | 2 | 0.008 (0.000, 0.046) | NA | NA |
| CADE | 11 | 0.005 (0.000, 0.013) | 0.222 | 23.3 |
| Multiple | 4 | 0.017 (0.002, 0.041) | 0.313 | 15.8 |
|
| ||||
| Total | 18 | 0.045 (0.022, 0.074) | <0.001 | 79.6 |
|
| 0.331 | |||
| China | 9 | 0.037 (0.008, 0.081) | <0.001 | 84.9 |
| Western | 7 | 0.051 (0.007, 0.120) | <0.001 | 77.6 |
| Worldwide | 2 | 0.077 (0.051, 0.107) | NA | NA |
|
| <0.001 | |||
| RS | 16 | 0.056 (0.033, 0.084) | <0.001 | 66.3 |
| PS | 2 | 0.005 (0.000, 0.017) | NA | NA |
|
| 0.032 | |||
| High risk only | 12 | 0.068 (0.036, 0.107) | 0.003 | 60.8 |
| Not high risk only | 6 | 0.017 (0.000, 0.060) | <0.001 | 90.8 |
|
| 0.003 | |||
| SEV | 15 | 0.046 (0.020, 0.080) | <0.001 | 76.0 |
| BEV | 2 | 0.014 (0.001, 0.037) | NA | NA |
| SEV or BEV | 1 | 0.082 (0.054, 0.116) | NA | NA |
|
| <0.001 | |||
| TA | 7 | 0.067 (0.030, 0.114) | 0.013 | 63.0 |
| TF | 7 | 0.009 (0.000, 0.040) | 0.005 | 68.0 |
| Multi-approach | 4 | 0.081 (0.060, 0.106) | 0.976 | 0.0 |
|
| 0.651 | |||
| Moderate | 14 | 0.040 (0.011, 0.080) | <0.001 | 76.6 |
| Low | 4 | 0.062 (0.026, 0.112) | <0.001 | 85.7 |
|
| 0.444 | |||
| First | 2 | 0.090 (0.036, 0.162) | NA | NA |
| Second | 3 | 0.016 (0.000, 0.087) | NA | NA |
| CADE | 11 | 0.050 (0.020, 0.091) | <0.001 | 83.1 |
| Multiple | 2 | 0.051 (0.032, 0.074) | NA | NA |
|
| ||||
| Total | 19 | 0.033 (0.010, 0.066) | <0.001 | 84.9 |
|
| 0.759 | |||
| China | 8 | 0.026 (0.000, 0.098) | <0.001 | 93.0 |
| Western | 9 | 0.038 (0.020, 0.060) | 0.906 | 0.0 |
| Worldwide | 2 | 0.042 (0.022, 0.066) | NA | NA |
|
| 0.169 | |||
| RS | 17 | 0.037 (0.009, 0.077) | <0.001 | 86.2 |
| PS | 2 | 0.024 (0.009, 0.045) | NA | NA |
|
| 0.926 | |||
| High risk only | 10 | 0.030 (0.013, 0.053) | 0.313 | 14.1 |
| Not high risk only | 9 | 0.036 (0.003, 0.095) | <0.001 | 92.2 |
|
| 0.660 | |||
| SEV | 15 | 0.038 (0.007, 0.086) | <0.001 | 87.7 |
| BEV | 3 | 0.015 (0.000, 0.062) | NA | NA |
| SEV or BEV | 1 | 0.042 (0.023, 0.070) | NA | NA |
|
| <0.001 | |||
| TA | 3 | 0.000 (0.000, 0.005) | NA | NA |
| TF | 10 | 0.032 (0.000, 0.108) | <0.001 | 89.9 |
| Multi-approach | 6 | 0.047 (0.030, 0.066) | 0.778 | 0.0 |
|
| 0.153 | |||
| Moderate | 11 | 0.052 (0.008, 0.121) | <0.001 | 88.0 |
| Low | 8 | 0.012 (0.000, 0.033) | 0.011 | 61.5 |
|
| 0.555 | |||
| First | 2 | 0.057 (0.010, 0.129) | NA | NA |
| Second | 4 | 0.008 (0.000, 0.063) | 0.195 | 36.1 |
| CADE | 8 | 0.024 (0.006, 0.052) | 0.001 | 70.4 |
| Multiple | 5 | 0.060 (0.000, 0.217) | <0.001 | 94.5 |
|
| ||||
| Total | 21 | 0.044 (0.018, 0.076) | <0.001 | 83.9 |
|
| <0.001 | |||
| China | 10 | 0.009 (0.000, 0.026) | 0.024 | 52.9 |
| Western | 9 | 0.065 (0.037, 0.098) | 0.235 | 23.4 |
| Worldwide | 2 | 0.122 (0.090, 0.158) | NA | NA |
|
| 0.077 | |||
| RS | 19 | 0.048 (0.018, 0.088) | <0.001 | 84.9 |
| PS | 2 | 0.026 (0.010, 0.048) | NA | NA |
|
| 0.425 | |||
| High risk only | 15 | 0.050 (0.022, 0.087) | <0.001 | 64.6 |
| Not high risk only | 6 | 0.034 (0.001, 0.098) | <0.001 | 93.1 |
|
| <0.001 | |||
| SEV | 18 | 0.042 (0.015, 0.077) | <0.001 | 79.6 |
| BEV | 2 | 0.020 (0.003, 0.046) | NA | NA |
| SEV or BEV | 1 | 0.118 (0.085, 0.158) | NA | NA |
|
| <0.001 | |||
| TA | 6 | 0.012 (0.000, 0.049) | 0.005 | 69.8 |
| TF | 9 | 0.017 (0.003, 0.038) | 0.243 | 22.5 |
| Multi-approach | 6 | 0.110 (0.085, 0.139) | 0.392 | 3.9 |
|
| 0.988 | |||
| Moderate | 14 | 0.043 (0.014, 0.083) | <0.001 | 73.8 |
| Low | 7 | 0.044 (0.003, 0.114) | <0.001 | 91.8 |
|
| 0.010 | |||
| First | 2 | 0.173 (0.090, 0.274) | NA | NA |
| Second | 4 | 0.039 (0.007, 0.087) | 0.573 | 0.0 |
| CADE | 11 | 0.031 (0.007, 0.067) | <0.001 | 82.8 |
| Multiple | 4 | 0.038 (0.000, 0.136) | <0.001 | 83.4 |
|
| ||||
| Total | 27 | 0.114 (0.084, 0.147) | <0.001 | 76.2 |
|
| 0.187 | |||
| China | 14 | 0.094 (0.053, 0.144) | <0.001 | 83.3 |
| Western | 10 | 0.140 (0.100, 0.185) | 0.158 | 31.3 |
| Worldwide | 3 | 0.153 (0.120, 0.188) | NA | NA |
|
| 0.738 | |||
| RS | 24 | 0.111 (0.078, 0.149) | <0.001 | 77.0 |
| PS | 3 | 0.133 (0.073, 0.206) | NA | NA |
|
| 0.908 | |||
| High risk only | 15 | 0.110 (0.063, 0.165) | <0.001 | 77.0 |
| Not high risk only | 12 | 0.118 (0.080, 0.162) | <0.001 | 76.6 |
|
| 0.312 | |||
| SEV | 22 | 0.104 (0.069, 0.145) | <0.001 | 79.4 |
| BEV | 3 | 0.136 (0.079, 0.204) | NA | NA |
| SEV or BEV | 2 | 0.153 (0.119, 0.190) | NA | NA |
|
| <0.001 | |||
| TA | 7 | 0.042 (0.013, 0.083) | 0.016 | 61.7 |
| TF | 12 | 0.156 (0.101, 0.218) | <0.001 | 75.1 |
| Multi-approach | 8 | 0.144 (0.116, 0.175) | 0.354 | 9.8 |
|
| 0.576 | |||
| Moderate | 17 | 0.107 (0.070, 0.150) | <0.001 | 71.5 |
| Low | 10 | 0.125 (0.074, 0.185) | <0.001 | 82.9 |
|
| 0.004 | |||
| First | 3 | 0.047 (0.000, 0.190) | NA | NA |
| Second | 5 | 0.167 (0.082, 0.272) | 0.023 | 64.7 |
| CADE | 13 | 0.085 (0.051, 0.126) | <0.001 | 76.2 |
| Multiple | 6 | 0.176 (0.140, 0.214) | 0.325 | 14.0 |
Peer Reviews
No public reviews on file for this paper yet. If you reviewed it on a platform where reviews are public (OpenReview, ICLR, NeurIPS, ICML), you can paste yours below so the community can read it here.
Videos
No videos yet. Explain this paper in a talk, walkthrough, or lecture? Add one.
Taxonomy
TopicsCardiac Valve Diseases and Treatments · Aortic Disease and Treatment Approaches · Congenital Heart Disease Studies
Highlights
The device success rate of TAVR for psNAVR treatment was 87.5%.TAVR is a valuable therapeutic option for patients with psNAVR who are at high surgical risk.Geographic location, surgical risk, valve type, and procedural approach influence the incidence of adverse events after TAVR.This study provides comprehensive and objective evidence to support clinical decision-making.
Introduction
Aortic valve regurgitation (AR) is a common valvular disease (1, 2). Among its subtypes, pure severe native aortic valve regurgitation (psNAVR) is characterized by structural or functional abnormalities of the aortic valve leaflets, leading to retrograde blood flow from the aorta into the left ventricle during diastole (3). The occurrence of psNAVR is closely related to factors such as degenerative changes in the valve leaflets, congenital malformations, and infective endocarditis (4). In the Chinese population, the prevalence of psNAVR is 1.2%, rising to 2% in individuals aged 70 years and older (5). Long-term AR with chronic volume overload increases left ventricular end-diastolic volume and pressure, which initially results in increased left ventricular compliance (6). Although this adaptation allows the left ventricle to accommodate the increased volume, prolonged overload ultimately causes progressive ventricular enlargement, a reduction in left ventricular ejection fraction (LVEF), and elevated left atrial and pulmonary artery wedge pressures, leading to left heart failure (HF) and, in severe cases, biventricular failure (7, 8).
The traditional treatments for AR mainly include drug therapy and surgical aortic valve replacement (9). However, many patients with severe AR are unable to undergo surgery due to factors such as reduced LVEF, advanced age, and multiple comorbidities (10). In recent years, transcatheter aortic valve replacement (TAVR) has emerged as an effective treatment for aortic valve stenosis (11). However, in patients with pure aortic valve regurgitation without valve calcification or stenosis, TAVR still presents considerable technical challenges (12). Although numerous studies in recent years have reported the efficacy and safety of TAVR in psNAVR, the results vary substantially with respect to success rate and mortality. Whether factors such as valve type, procedural approach, and geographic region significantly affect outcomes remains controversial (13–18).
Therefore, this meta-analysis was conducted to summarize the latest evidence and comprehensively evaluate the efficacy and safety of TAVR in patients with psNAVR. This study aims to provide comprehensive and objective evidence to support clinical decision-making.
Methods
Search strategy
A systematic literature search was conducted in PubMed, Embase, Web of Science, and the Cochrane Library up to August 27, 2025, with no language restrictions. The search keywords were “aortic valve regurgitation,” “transcatheter aortic valve replacement,” “transcatheter aortic valve implantation,” “TAVR,” and “TAVI.” Keywords within the same category were combined with “OR,” whereas keywords across categories were combined with “AND” (Supplementary Tables S1–S4). In addition, the reference lists of relevant reviews and included articles were screened to identify additional studies eligible for meta-analysis.
Eligibility criteria
The inclusion criteria were as follows: (1) patients with psNAVR, excluding those with mild or moderate AR or concomitant aortic stenosis; (2) patients with psNAVR undergoing TAVR; (3) studies reporting at least one outcome, such as device success, mortality, or adverse events; and (4) no restriction on study design, with both prospective and retrospective studies eligible. Non-academic publications such as reviews, conference abstracts, commentaries, and letters were excluded. Studies with a sample size of fewer than 10 participants were also excluded to minimize selection bias (19). In cases of duplicate publications or overlapping datasets, only the article with the most complete research information was included.
Data extraction and quality assessment
Two investigators independently screened the literature according to the inclusion and exclusion criteria. After identifying studies for inclusion in the meta-analysis, the investigators independently extracted data using a predesigned standardized form. The extracted information included the first author, publication year, study region, baseline characteristics of the study population (sample size, age, and sex ratio), aortic valve morphology, surgical risk level, device manufacturer, device type, procedural approach, follow-up duration, and study outcomes. After completing data extraction, the investigators exchanged verification sheets and resolved discrepancies through discussion.
For quality assessment, the Methodological Index for Non-Randomized Studies (MINORS) (20) was applied. The MINORS instrument includes 12 evaluation items; however, for single-arm studies without a control group, only the first eigt items were assessed. Each item was scored from 0 to 2, with a maximum total of 16 points. A score of 0 indicated “not reported,” 1 indicated “reported but inadequate,” and 2 indicated “reported and adequate.” Studies were categorized as having low (0–5), moderate (6–11), or high (12–16) methodological quality.
Statistical analysis
Statistical analyses were performed using Stata 14.0 software (StataCorp). The primary outcomes were device success, perioperative all-cause mortality, and perioperative cardiovascular mortality, where the perioperative period was defined as during surgery and within 30 days post-operatively. Secondary outcomes included perioperative and 1-year post-operative adverse events, such as stroke, acute kidney injury (AKI), new-onset myocardial infarction, major vascular complications, major bleeding events, readmission due to HF, and new permanent pacemaker (PPM) implantation.
All study outcomes were categorical variables, and incidence rate (IR) with 95% confidence interval (CI) was used as the effect size (ES). Heterogeneity was assessed using Cochran's Q test and the I^2^ statistic (21). A Q test P-value < 0.05 or I^2^ > 50% indicated significant heterogeneity; otherwise, heterogeneity was considered non-significant. Because of notable heterogeneity in study design, treatment protocols, and device types among the included studies, a random-effects model was applied to synthesize the ES.
For perioperative outcomes, subgroup analyses were conducted to examine the effects of study design, geographic region, surgical risk, valve type, procedural approach, generation of devices, and risk of bias on heterogeneity and pooled ES. Through sensitivity analysis, studies with a significant impact on heterogeneity were excluded, and the difference between the pooled ES of the remaining studies and the original meta-analysis result was compared. Publication bias was evaluated using the Egger test and funnel plots (22).
Results
Study selection
A total of 813 articles were identified through the initial search. Of these, 418 were removed as duplicates. After screening titles and abstracts, 353 articles were excluded, and 42 articles were retrieved for full-text eligibility assessment. Ultimately, 29 articles (4, 13–18, 23–44) met the inclusion criteria for the meta-analysis (Figure 1).
Flow diagram of the study selection process.
Study characteristics and study quality
The 29 included studies involved 2,773 patients with psNAVR undergoing TAVR, with sample sizes ranging from 10 to 598 participants. Among them, six were prospective studies (13, 30, 35, 37, 38, 42), and the remainder were retrospective. Apart from a few multinational collaborative studies (15, 17, 31–33, 41), most were conducted in China, Germany, Italy, France, and the United States. The characteristics of these studies are summarized in Table 1.
The MINORS scores of the included studies ranged from 9 to 15. Thirteen studies scored 12 or higher and were classified as low risk of bias (13, 14, 25, 29, 35–38, 40–43), while the remaining studies were classified as moderate risk of bias (Supplementary Table S5).
Meta-analysis
Primary outcomes
Because four studies stratified participants by specific clinical features and reported results separately, a total of 33 datasets were available. Figure 2 presents the forest plot of device success, including 33 datasets and 2,773 participants (Table 2). The pooled random-effects model yielded an IR of 0.875 (95% CI: 0.833–0.912), indicating a device success rate of 87.5% (95% CI: 83.3%−91.2%). Significant heterogeneity was observed among the included studies (I^2^ = 87.0%, P < 0.001).
Forest plot of device success. The size of the black squares is proportional to the weight of each study in the pooled estimate calculated using a random-effects model. The diamond below the studies represents the pooled effect estimate, with its center and vertical line (red) indicating the overall event rate and its lateral edges denoting the 95% CI.
A total of 2,139 participants contributed data on perioperative all-cause mortality (Figure 3A, Table 2). The pooled estimate was IR = 0.031 (95% CI: 0.016–0.051), with significant heterogeneity (I^2^ = 71.2%, P < 0.001). In addition, 1,589 participants provided data on perioperative cardiovascular mortality (Figure 3B, Table 2). The pooled estimate was IR = 0.014 (95% CI: 0.002–0.035), with significant heterogeneity (I^2^ = 69.3%, P < 0.001).
Forest plots of perioperative mortality outcomes. (A) All-cause mortality. (B) Cardiovascular mortality. The size of the black squares is proportional to the weight of each study in the pooled estimate calculated using a random-effects model. The diamond below the studies represents the pooled effect estimate, with its center and vertical line (red) indicating the overall event rate and its lateral edges denoting the 95% CI.
Secondary perioperative outcomes
The pooled results for stroke, AKI, new-onset myocardial infarction, major vascular complications, major bleeding events, and new PPM implantation are shown in Figures 4A–F and Table 2. The random-effects model indicated that, for TAVR in psNAVR, the perioperative incidences were 0.7% for stroke, 4.5% for AKI, 0.0% for new-onset myocardial infarction, 3.3% for major vascular complications, 4.4% for major bleeding events, and 11.4% for new PPM implantation. Except for new-onset myocardial infarction, all outcomes demonstrated significant heterogeneity (I^2^ > 50%, P < 0.05).
Forest plots of perioperative adverse events. (A) Stroke. (B) Acute kidney injury. (C) New-onset myocardial infarction. (D) Major vascular complications. (E) Major bleeding events. (F) New permanent pacemaker implantation. The size of the black squares is proportional to the weight of each study in the pooled estimate calculated using a random-effects model. The diamond below the studies represents the pooled effect estimate, with its center and vertical line (red) indicating the overall event rate and its lateral edges denoting the 95% CI.
Secondary 1-year post-operative outcomes
The pooled results for all-cause mortality, cardiovascular mortality, stroke, AKI, new-onset myocardial infarction, major bleeding events, readmission due to HF, and new PPM implantation at 1 year are shown in Supplementary Figures S1–S8, and Table 3. The random-effects model indicated incidence rates of 9.3% for all-cause mortality, 4.3% for cardiovascular mortality, 2.6% for stroke, 9.1% for AKI, 0.0% for new-onset myocardial infarction, 1.6% for major bleeding events, 19.0% for readmission due to HF, and 10.0% for new PPM implantation. Significant heterogeneity was observed for all-cause mortality, cardiovascular mortality, readmission due to HF, and new PPM implantation (I^2^ > 50% or P < 0.05). For the remaining outcomes, no significant heterogeneity was found (I^2^ = 0%, P > 0.05).
Subgroup analysis
Table 4 summarizes the subgroup analyses of perioperative outcomes. Because of the extremely low incidence of new-onset myocardial infarction, no subgroup analysis was performed for this outcome. For device success, cardiovascular mortality, and stroke, and major bleeding events, geographic location, valve type, and procedural approach significantly influenced the pooled ES (P < 0.05). For major bleeding events, geographic location, valve type, generation of devices, and procedural approach significantly influenced the pooled ES (P < 0.05). For all-cause mortality, study design, surgical risk, and valve type were significant influencing factors (P < 0.05). For AKI, study design, surgical risk, valve type, and procedural approach were significant influencing factors (P < 0.05). For major vascular complications and new PPM implantation, procedural approach was the influencing factor (P < 0.05). For new PPM implantation, procedural approach, and generation of devices were the influencing factors (P < 0.05). Geographic location and procedural approach also contributed to heterogeneity in stroke incidence after surgery. No significant influencing factors were found for the remaining outcomes.
Sensitivity analysis
The sensitivity analysis results of device success, all-cause mortality, cardiovascular mortality, stroke, AKI, major vascular complications, major bleeding events, and new PPM implantation of perioperative were shown in Supplementary Figures S9–S15. After excluding 13 studies (14, 15, 18, 27, 28, 31, 33, 37, 40, 41, 43, 44), the I^2^ of device success dropped to 36.5%, and the pooled ES was 87.6% (95% CI: 84.5%−90.4%). Following the exclusion of seven studies (15, 16, 26, 34, 36, 41, 42), the I^2^ of all-cause mortality fell to 27.4%, corresponding to a pooled ES of 2.4% (95% CI: 1.3%−3.7%). Exclusion of two studies (36, 41) reduced the I^2^ for cardiovascular mortality to 16.7%, and the pooled ES was 0.6% (95% CI: 0.0%−1.6%). After excluding one study (41), the I^2^ of stroke dropped to 12.1%, and the pooled ES was 0.4% (95% CI: 0.0%−1.0%). After excluding three studies (26, 30, 37), the I^2^ of AKI dropped to 16.7%, and the pooled ES was 6.7% (95% CI: 4.8%−8.9%). Exclusion of four studies (14, 31, 39, 41), the I^2^ of major vascular complications fell to 36.3%, corresponding to a pooled ES of 1.6% (95% CI: 0.3%−3.5%). After excluding six studies (14, 23, 31, 33, 36, 41), the I^2^ of major bleeding events dropped to 35.4%, and the pooled ES was 2.0% (95% CI: 0.6%−3.8%). After excluding ten studies (23, 25–27, 31, 37, 39, 41, 43, 44), the I^2^ of new PPM implantation dropped to 26.1%, and the pooled ES was 10.2% (95% CI: 7.8%−12.8%). Overall, after excluding studies that exerted a significant impact on heterogeneity, the pooled ES for AKI exhibited a slight increase, whereas major vascular complications and major bleeding events showed a significant reduction, with minimal changes observed in all other indicators.
Publication bias test
Tables 2, 3 present the results of the publication bias assessment for perioperative and 1-year post-operative outcomes. Because only two studies reported the 1-year incidence of AKI, the Egger test could not be performed for this outcome. For all other outcomes, the Egger test indicated no significant publication bias (P > 0.05).
Discussion
TAVR was initially used primarily for the treatment of patients with pure severe aortic valve stenosis (11). In recent years, with device improvements and advances in clinical research, its use has expanded to patients with psNAVR who are at high surgical risk or have contraindications to surgery, providing a minimally invasive therapeutic alternative (45, 46). However, the success rate, mortality, and outcome-influencing factors of TAVR in psNAVR remain highly controversial. Therefore, this meta-analysis was conducted to evaluate the efficacy and safety of TAVR in patients with psNAVR using the most recent evidence. This analysis included 2,773 patients with psNAVR undergoing TAVR. We found that TAVR is a feasible treatment option for patients with psNAVR who are at high surgical risk. However, geographic location, surgical risk, valve type, and procedural approach influenced the incidence of adverse events after TAVR in psNAVR.
The main challenge in treating patients with psNAVR using TAVR is the absence of calcification in the device landing zone, which may lead to inadequate fixation of the prosthetic valve at the annulus during deployment and result in device displacement (13). In this study, the device success rate of TAVR for psNAVR was 87.5%, a satisfactory outcome consistent with the findings of Beerkens F J et al. (11), who reported a device success rate of 86.3% in patients with NAVR undergoing TAVR. It has also been reported that the operative mortality of patients with AR undergoing surgical aortic valve replacement is 3.4% (10). In comparison, although the perioperative all-cause mortality of psNAVR patients undergoing TAVR was only 3.1%, the 1-year all-cause mortality reached 9.3%. The higher mortality in psNAVR patients treated with TAVR is likely attributable to the fact that most patients included in this meta-analysis were at high surgical risk and often had depressed LVEF, concomitant severe mitral regurgitation, or an enlarged aortic diameter. Overall, TAVR appears to be a valuable therapeutic option for patients with psNAVR who are at high surgical risk.
The worsening of HF has been recognized as the most common cause of rehospitalization after TAVR (47). In this study, the incidences of perioperative adverse events such as stroke and myocardial infarction were relatively low; however, the 1-year rehospitalization rate due to HF reached 19%. This phenomenon may be attributable to multiple post-operative factors, including severe prosthesis–patient mismatch, significant paravalvular leaks, and conduction disturbances, all of which can increase the risk of HF. We also found that the 1-year incidences of AKI and new PPM implantation were close to 10%, which warrants clinical attention. AKI is a serious complication of TAVR and may result from several factors, including the transapical approach, sustained hypotension, and high contrast volume (48). In addition, several factors may contribute to adverse events after TAVR for psNAVR. For example, Witberg et al. (49) reported a significant association between center valve preference and late mortality. Similarly, Protasiewicz et al. (50) emphasized that when TAVR is performed with self-expanding valves at centers that predominantly favor balloon-expandable valves, 2-year mortality and periprocedural outcomes appear to be compromised. In this study, subgroup analyses showed that geographic location, surgical risk, valve type, and procedural approach were factors influencing the incidence of adverse events after TAVR for psNAVR. SEV combined with the TA are associated with the most favorable outcomes (highest device success, lowest overall adverse events); for patients at high risk of mortality, BEV may be preferred for their superior mortality reduction; SEV/BEV and multi-approach should be avoided due to significantly worse outcomes. In addition, geographic location is a surrogate for modifiable clinical and systemic factors (patient selection, procedural care, center expertise) rather than an independent risk factor. Its primary value is to highlight: (a) Targetable risks: western centers should prioritize bleeding/stroke prevention strategies proven effective in Chinese cohorts; (b) Contextualized risk stratification: adjust risk estimates based on regional practice patterns (e.g., higher bleeding risk in Western patients); (c) Quality improvement: standardize best practices (e.g., high-volume centers, personalized anticoagulation) across regions to reduce disparities. In clinical practice, geographic location should complement—not replace—objective risk scores and patient-specific factors (e.g., comorbidities, anatomy) to guide TAVR candidate selection and perioperative management. Also, subgroup analysis indicated that the generation of devices had significant impact on the major bleeding events and new PPM implantation. Therefore, when applying TAVR for psNAVR in clinical practice, these influencing factors should be carefully considered.
In this meta-analysis, the number of included studies was moderate, the cumulative sample size was large, and the pooled effect sizes were estimated with high precision. The methodological quality of the included studies was generally moderate, and the overall risk of bias was low. Importantly, no significant publication bias was detected, supporting the reliability of the results. However, several limitations should be considered. First, for outcomes other than all-cause mortality, relatively few studies reported 1-year post-operative data. Additional high-quality research is needed to confirm the stability and generalizability of these findings. Second, the methodological and clinical heterogeneity among the included studies was considerable, which contributed to substantial statistical heterogeneity in some outcomes. Although random-effects models were applied, interpretation of these results should remain cautious. Third, due to limited follow-up data, it was not possible to assess the medium- or long-term benefits of TAVR in psNAVR patients.
Conclusion
In conclusion, this meta-analysis demonstrated that TAVR is a feasible treatment option for patients with psNAVR who are at high surgical risk. Geographic location, surgical risk, valve type, and procedural approach were identified as factors influencing the incidence of adverse events after TAVR in psNAVR. These findings provide an evidence-based reference to guide clinicians and healthcare teams in the management of patients with psNAVR.
The reference list from the paper itself. Each links out to its DOI / PubMed record.
- 1Attar R Malahfji M Angulo C Nguyen DT Graviss EA Shah DJ . Echocardiographic evaluation of chronic aortic regurgitation: comparison with cardiac magnetic resonance and implications for guideline recommendations. JACC Cardiovasc Imaging. (2025) 18:403–17. doi: 10.1016/j.jcmg.2024.08.01339545892 · doi ↗ · pubmed ↗
- 2Malahfji M Saeed M Zoghbi WA. Aortic regurgitation: review of the diagnostic criteria and the management guidelines. Curr Cardiol Rep. (2023) 25:1373–80. doi: 10.1007/s 11886-023-01955-x 37715804 · doi ↗ · pubmed ↗
- 3Fan J Lin D Miao J Weng Z Qi Y Zhan Z . Age-related outcomes of transcatheter aortic valve replacement in patients with pure severe aortic regurgitation. Cardiology. (2025) 25: 1–10. doi: 10.1159/00054356739999812 · doi ↗ · pubmed ↗
- 4Garcia S Ye J Webb J Reardon M Kleiman N Goel S . Transcatheter treatment of native aortic valve regurgitation: the North American Experience With a Novel Device. JACC Cardiovasc Interv. (2023) 16:1953–60. doi: 10.1016/j.jcin.2023.05.01837212431 · doi ↗ · pubmed ↗
- 5Yang Y Wang Z Chen Z Wang X Zhang L Li S . Current status and etiology of valvular heart disease in China: a population-based survey. BMC Cardiovasc Disord. (2021) 21:339. doi: 10.1186/s 12872-021-02154-834256700 PMC 8276378 · doi ↗ · pubmed ↗
- 6Akinseye OA Pathak A Ibebuogu UN. Aortic valve regurgitation: a comprehensive review. Curr Probl Cardiol. (2018) 43:315–34. doi: 10.1016/j.cpcardiol.2017.10.00429174586 · doi ↗ · pubmed ↗
- 7El Hussein MT Job D Hakkola J. Aortic regurgitation: review of current management. Dimens Crit Care Nurs. (2024) 43:80–6. doi: 10.1097/DCC.000000000000062838271313 · doi ↗ · pubmed ↗
- 8Peigh G Puthumana JJ Bonow RO. Aortic regurgitation and heart failure: advances in diagnosis, management, and interventions. Heart Fail Clin. (2023) 19:285–96. doi: 10.1016/j.hfc.2023.02.00737230644 · doi ↗ · pubmed ↗