The correlation and gut microbial characteristics in the whole spectrum of Alzheimer’s disease: a systematic review and meta-analysis
Zhao Xiaoyi, Li Haixiao, Ren Houjian, Zhang Wenya, Fan Jie, Song Han, Wang Defeng, Wang Zhen, Cao Jingrong

TL;DR
This study reviews gut microbiota differences in Alzheimer's disease patients compared to healthy individuals, finding altered microbial abundance linked to disease stages.
Contribution
The study provides a systematic review and meta-analysis of gut microbiota changes across Alzheimer's disease stages, revealing stage-specific microbial shifts.
Findings
AD patients showed reduced gut microbiota diversity compared to healthy controls.
Megamonas and Bacteroides were more abundant in AD patients, while Firmicutes and Proteobacteria were less abundant.
Fusobacteria and Lactobacillus abundances changed gradually from MCI to AD stages.
Abstract
Gut dysbiosis is hypothesized to be a potential pathological mechanism in patients across the Alzheimer’s disease (AD) spectrum. Nevertheless, despite growing interest, existing findings remain largely inconsistent. This systematic review and meta-analysis aimed to compare the composition of gut microbiota (GM) between patients with mild cognitive impairment (MCI) or AD and healthy controls (HC). PubMed, Embase, MEDLINE and Web of science were searched from January 2022 to November 2025. Eligible studies included observational studies and pre-intervention arms of interventional trials reporting GM abundance in AD spectrum patients vs. HC. Two reviewers independently screened articles, extracted data, and assessed bias risk. Effect sizes were pooled using an inverse-variance weighted random-effects model. Twenty studies (1,025 HC and 456 AD spectrum patients) were analyzed. AD…
Genes, proteins, chemicals, diseases, species, mutations and cell lines named across the full text — each resolved to its canonical identifier and authoritative record.
Click any figure to enlarge with its caption.
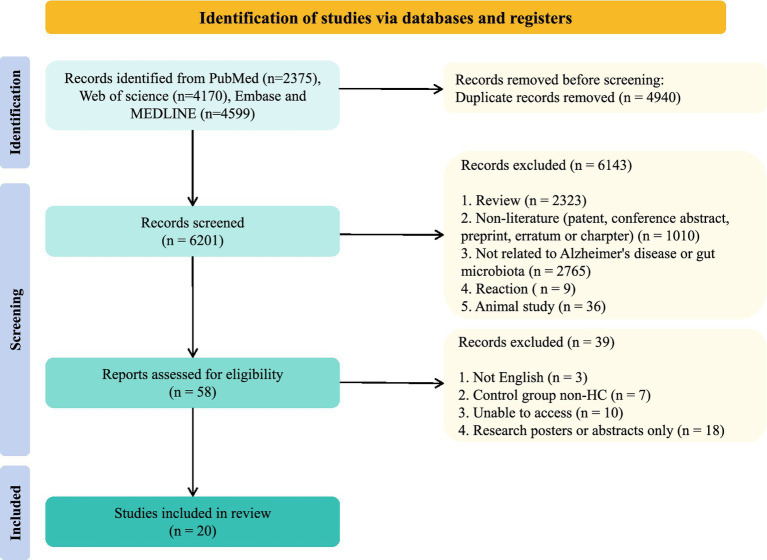 Figure 1
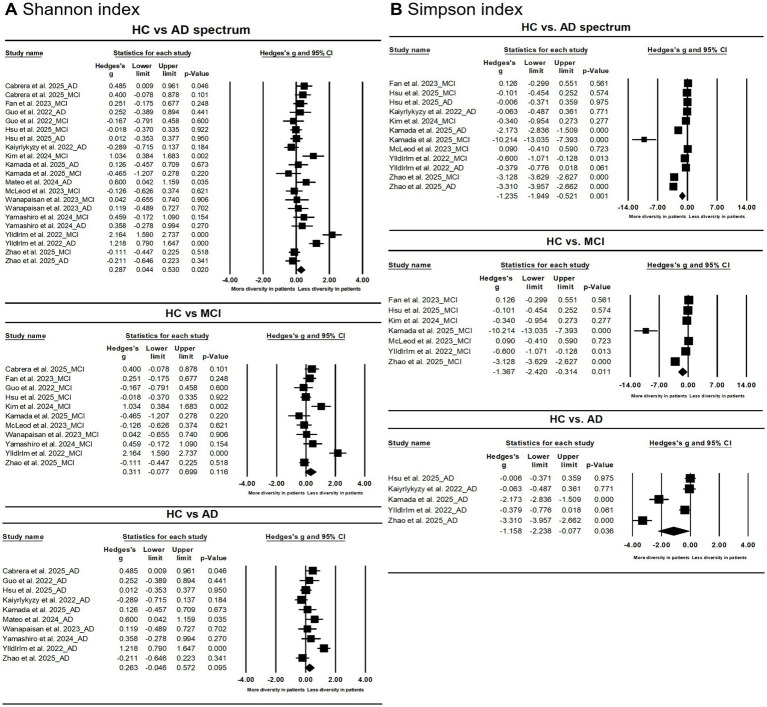 Figure 2
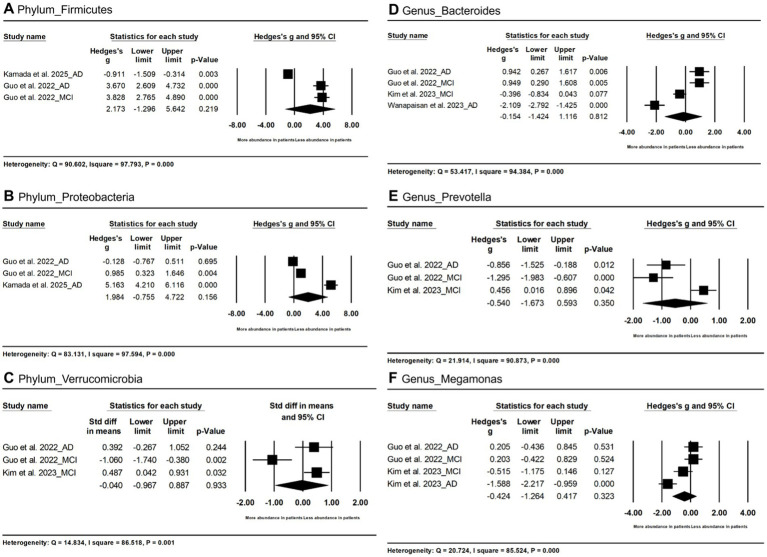 Figure 3
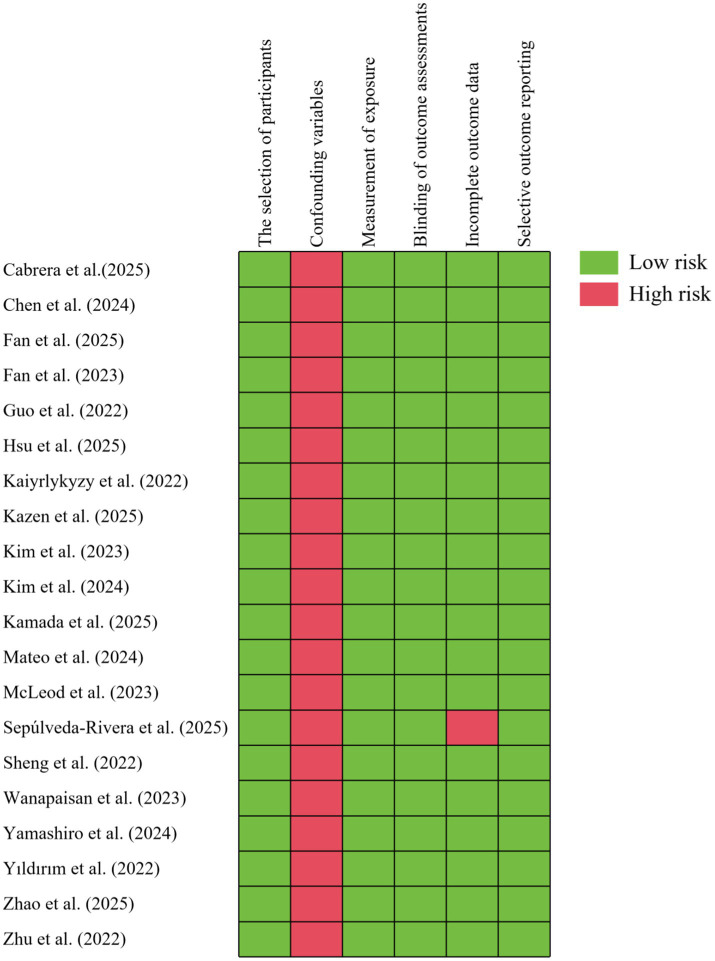 Figure 4
| Study | Country | Healthy control (HC) | Stage | AD spectrum | Dietary check | ||||||||
|---|---|---|---|---|---|---|---|---|---|---|---|---|---|
|
| Sex (F/M) | Age | BMI | DMa |
| Sex (F/M) | Age | BMI | DMa | ||||
|
| Spain | 38 | 19/19 | 68.21 ± 5.99 | 26.89 ± 4.22 | 5 (13.2) | AD | 31 | 15/16 | 74.61 ± 5.60 | 25.33 ± 3.58 | 1 (3.2) | Yes |
| MCI | 30 | 13/17 | 72.13 ± 5.18 | 25.29 ± 2.88 | 5 (17.9) | ||||||||
|
| China | 23 | NR | NR | NR | NR | AD | 41 | NR | NR | NR | NR | NR |
|
| China | 320 | 209/111 | 66.8 ± 6.8 | 24.7 ± 3.4 | 54 (18) | MCI | 119 | 68/51 | 73.7 ± 7.3 | 24.3 ± 4.0 | 31 (28) | NR |
|
| China | 65 | 34/31 | 74.2 ± 6.1 | 24.4 ± 3.1 | 13 (20) | MCI | 31 | 15/16 | 73.9 ± 6.7 | 24.8 ± 3.1 | 11 (35) | NR |
|
| China | 18 | 4/14 | 64.2 ± 4.7 | 21.1 ± 2.2 | NR | AD | 18 | 16/2 | 63.5 ± 4.7 | 21.9 ± 2.4 | NR | NR |
| MCI | 20 | 16/4 | 64.5 ± 4.5 | 21.8 ± 2.0 | NR | ||||||||
|
| China | 54 | 40/14 | 74.2 ± 7.8 | 23.8 ± 4.1 | NR | MCI | 70 | 50/20 | 76.5 ± 7.2 | 23.9 ± 4.3 | NR | Yes |
| AD | 60 | 42/18 | 79.3 ± 7.5 | 24.1 ± 4.5 | |||||||||
|
| Kazakhstan | 43 | 35/8 | 68 | 27.4 | 12 (27.9) | AD | 41 | 30/11 | 68 | 22.7 | 9 (22) | NR |
|
| U.S. | 10 | 7/3 | 70.70 ± 6.13 | 26.06 ± 4.33 | NR | MCIc | 14 | 7/7 | 73.21 ± 6.14 | 26.68 ± 4.76 | NR | NR |
|
| KR | 40 | 38/2 | 66.4 ± 5.8 | 23.6 ± 3.0 | NR | MCI | 40 | 34/6 | 69.5 ± 4.8 | 23.9 ± 2.2 | NR | NR |
|
| South Korea | 17 | 10/7 | 70.82 ± 7.63 | 24.14 | 6 (35.29) | MCI | 24 | 12/12 | 73.04 ± 6.56 | 22.69 | 6 (25) | NR |
|
| Uganda | 13 | 9/4 | 70 | 32.3 | 0 | AD | 77 | 63/14 | 76 | 28.0 | 1 (1.3) | Yes |
| MCI | 14 | 11/3 | 76.5 | 25.6 | |||||||||
|
| Spain | 25 | 12/13 | 70.6 ± 4.9 | 26.6 ± 3.2 | NR | AD | 25 | 13/12 | 73.0 ± 5.0 | 24.7 ± 3.6 | NR | Yes |
|
| U.S. | 30 | 28/2 | 64.9 ± 5.7 | 36.4 ± 4.1 | NR | MCI | 30 | 28/2 | 64.7 ± 5.7 | 36.1 ± 3.8 | NR | NR |
|
| U.S. | 50 | 36/14 | NR | NR | NR | AD | 50 | 35/15 | NR | NR | NR | NR |
|
| China | 34 | 26/8 | 66.91 ± 5.28 | 23.78 ± 2.90 | 5 (14.71) | AD | 32 | 22/10 | 68.44 ± 5.35 | 24.42 ± 2.74 | 1 (3.13) | NR |
|
| Thailand | 20 | 12/8 | 69.4 ± 6.2 | 23.8 ± 2.4 | 8 (40) | MCI | 12 | 6/6 | 71.3 ± 4.0 | 24.8 ± 2.2 | 6 (50) | Yes |
| AD | 20 | 11/9 | 72.8 ± 5.6 | 22.8 ± 4.1 | 6 (30) | ||||||||
|
| Japan | 19 | 12/7 | 78.5 ± 6.0 | 22.4 ± 2.3 | 3 (15.8) | MCI | 19 | 13/6 | 81.1 ± 6.5 | 20.4 ± 4.8 | 2 (10.5) | NR |
| AD | 18 | 10/8 | 82.4 ± 4.5 | 21.2 ± 2.1 | 6 (33.3) | ||||||||
|
| Turkey | 51 | 23/28 | 67 ± 5.3 | NR | NR | MCI | 27 | 11/16 | 69.2 ± 6.4 | NR | NR | NR |
|
| China | 61 | 36/25 | 62.39 ± 6.92 | 23.71 ± 2.65 | 6 (9.8) | MCI | 75 | 41/34 | 64.48 ± 7.91 | 23.12 ± 2.81 | 10 (13.3) | NR |
| AD | 30 | 23/7 | 65.47 ± 7.99 | 21.38 ± 2.34 | 5 (16.7) | ||||||||
|
| China | 94 | 58/36 | 74.3 ± 10.6 | NR | 13 (13.8) | MCI | 125 | 76/49 | 75.4 ± 7.1 | NR | 20 (16) | NR |
| AD | 83 | 53/30 | 71.8 ± 8.3 | NR | 10 (12.2) | ||||||||
| Study | β diversity | Findings | |
|---|---|---|---|
|
| PCoA based on Bray–Curtis dissimilarity | No significant difference among HC, MCI and AD | NR |
|
| PCoA based on Bray–Curtis dissimilarity | A significant difference in gut microbial composition among AD, MCI and HC | |
|
| PCoA of Weighted UniFrac distances | No significant difference between MCI and HC | NR |
| PCoA of Unweighted UniFrac distances | No significant difference between MCI and HC | NR | |
| PCoA based on Bray–Curtis dissimilarity | No significant difference between MCI and HC | NR | |
|
| PCoA of Weighted UniFrac distances | No significant difference between MCI and HC | NR |
| PCoA of Unweighted UniFrac distances | No significant difference between MCI and HC | NR | |
|
| PCoA of Weighted UniFrac distances | A significant difference in gut microbial composition between AD and HC | |
| A significant difference in gut microbial composition between MCI and HC | |||
| PCoA based on Bray–Curtis dissimilarity | A significant difference in gut microbial composition between AD and HC | p < 0.001 | |
| A significant difference in gut microbial composition between MCI and HC | p < 0.001 | ||
|
| PCoA based on Bray–Curtis dissimilarity | A moderate differences in gut microbial composition between MCI and HC | NR |
| A significant difference in gut microbial composition between MCI and AD | NR | ||
|
| PCoA of Weighted UniFrac distances | No significant difference between AD and HC | |
|
| Unweighted UniFrac distance matrix | No significant difference between MCI and HC | |
| Weighted UniFrac distance matrix | No significant difference between MCI and HC | ||
| Jaccard distance matrix | No significant difference between MCI and HC | ||
| Bray Curtis distance matrix | No significant difference between MCI and HC | ||
|
| PCoA based on Bray–Curtis dissimilarity | A significant difference in gut microbial composition between MCI and HC | |
| PCoA of Generalized UniFrac distances | A slight difference in gut microbial composition between MCI and HC | ||
|
| PCoA of Weighted UniFrac distances | A significant difference in gut microbial composition among AD, MCI and HC | NR |
| A slight difference in gut microbial composition between MCI and HC | NR | ||
| PCoA based on Bray–Curtis dissimilarity | A significant difference in gut microbial composition among AD, MCI and HC | NR | |
|
| PCoA of Unweighted UniFrac distances | No significant difference between MCI and HC | |
| PCoA of Weighted UniFrac distances | No significant difference between MCI and HC | ||
| PCoA based on Jaccard index | No significant difference between MCI and HC | p = 0.81 | |
| PCoA based on Bray-Curtis index | No significant difference between MCI and HC | ||
|
| NMDS based on ASV distribution | No significant difference between AD and HC | NR |
| PCoA based on the distribution of ASVs | No significant difference between AD and HC | NR | |
|
| PCoA of Unweighted UniFrac distances | A significant difference in gut microbial composition among AD, MCI and HC | p = 0.03 |
| PCoA of Weighted UniFrac distances | No significant among AD, MCI and HC | ||
|
| PCoA based on Bray-Curtis distance | A significant difference in gut microbial composition among AD, MCI and HC | NR |
| PCoA based on Jaccard distance | A significant difference in gut microbial composition among AD, MCI and HC | NR | |
|
| PCoA based on Bray-Curtis distance | A significant difference in gut microbial composition between AD and HC | |
| A significant difference in gut microbial composition between AD and MCI | |||
| PCoA of Weighted UniFrac distances | A significant difference in gut microbial composition between AD and HC | ||
| A significant difference in gut microbial composition between AD and MCI | |||
| No significant difference between MCI and HC | NR | ||
|
| PCA based on Bray-Curtis distance | No significant difference among HC, MCI and AD | NR |
| PCA of Unweighted UniFrac distances | No significant difference among HC, MCI and AD | NR | |
| PCA of Weighted UniFrac distances | No significant difference among HC, MCI and AD | NR |
| Microbial species | HC vs AD | HC vs MCI | ||||
|---|---|---|---|---|---|---|
| Hedges’s g | 95% CI |
| Hedges’s g | 95% CI |
| |
| Phylum_Firmicutes | 2.891 | [−2.216, 7.998] | < 0.001 | −0.039 | [−0.663, 0.584] | 0.902 |
| Phylum_Proteobacteria | 2.505 | [−2.680, 7.690] | 0.344 | 0.985 | [0.323, 1.646] | 0.004 |
| Genus_Bacteroides | −0.583 | [−3.573, 2.407] | 0.702 | 0.253 | [−1.063, 1.570] | 0.706 |
| Genus_Megamonas | −0.693 | [−2.450, 1.064] | 0.440 | −0.147 | [−0.851, 0.556] | 0.681 |
| Microbial measure | Begg and Mazumdar rank correlation | Egger’s regression intercept test | Duval and Tweedie’s trim and fill | |||
|---|---|---|---|---|---|---|
|
| Intercept | Observed Hedges’ g | Adjusted Hedges’ g | |||
| Shannon | 0.157 | 0.319 | 2.275 | 0.290 | - | - |
| Simpson | −0.500 | 0.221 | −18.633 | 0.026 | - | - |
| P_Firmicutes | 0.667 | 0.296 | 29.256 | 0.008 | - | - |
| P_Proteobacteria | 0.667 | 0.296 | 31.228 | 0.114 | - | - |
| P_Verrucomicrobia | −0.667 | 0.296 | −7.748 | 0.527 | - | - |
| G_Bacteroides | −0.167 | 0.734 | 2.067 | 0.887 | - | - |
| G_Prevotella | −0.667 | 0.296 | −12.639 | 0.088 | - | - |
| G_Megamonas | −0.167 | 0.734 | 4.789 | 0.956 | - | - |
Peer Reviews
No public reviews on file for this paper yet. If you reviewed it on a platform where reviews are public (OpenReview, ICLR, NeurIPS, ICML), you can paste yours below so the community can read it here.
Videos
No videos yet. Explain this paper in a talk, walkthrough, or lecture? Add one.
Taxonomy
TopicsGut microbiota and health · Alzheimer's disease research and treatments · Barrier Structure and Function Studies
Introduction
Alzheimer’s disease (AD) is characterized by two hallmark pathologies: β-amyloid (Aβ) plaque deposition and neurofibrillary tangles of hyperphosphorylated tau protein (Scheltens et al., 2021; Dissanayaka et al., 2024). However, its pathogenesis remains unclear, with recent evidence highlighting the gut microbiota (GM) as a potential contributor to AD development or progression (Liu et al., 2020; Jiang et al., 2017; Grabrucker et al., 2023; Zhuang et al., 2018). The associations of the GM with updated biomarker categories of AD pathogenesis are described (2024). Current findings of the GM characteristics in the whole spectrum of AD are summarized.
The GM is a complex ecosystem consisting of over 100 trillion symbiotic microbial cells that support human physiology and development (Doifode et al., 2021). A growing body of research points to an interplay between the gastrointestinal tract and central nervous system (CNS) via the gut-brain axis: (a) Neurochemical pathways: GM synthesizes/releases neurotransmitters (e.g., serotonin, acetylcholine) and metabolites (e.g., short-chain fatty acids [SCFAs], tryptophan) that cross the blood–brain barrier (BBB) to modulate neural activity (Dicks, 2022; Li et al., 2023). (b) Neural pathways: The enteric nervous system (ENS) connects to the CNS via the vagus nerve and autonomic nervous system (Bonaz et al., 2018). (c) Immune pathways: GM regulates peripheral inflammation by producing pro-inflammatory cytokines (e.g., IL-1, IL-6, TNF-α) (Fröhlich et al., 2016; White et al., 2025).
Recently, GM disruption contributes to gastrointestinal disorders and systemic physiological alterations through the release of abnormal microbial metabolites. Animal studies indicate that GM dysbiosis is associated with the onset of AD (Grabrucker et al., 2023; Chen et al., 2022; Chen et al., 2024). Preclinical and clinical studies suggest gut dysbiosis disrupts gut-brain axis communication, contributing to AD (Nguyen et al., 2023; Ullah et al., 2023). Probiotics have also been shown to improve cognitive function in AD spectrumpatients (Fei et al., 2023; Kim et al., 2021). Other conditions may also be alleviated through probiotic supplementation, including psoriasis (Buhaș et al., 2023) and chronic spontaneous urticaria (Atefi et al., 2022).
However, GM composition varies by geography: For example, Zhuang et al. (China) reported increased Bacteroidetes and decreased Actinobacteriain in AD patients (Zhuang et al., 2018). while U.S. studies yielded contradictory reports (Vogt et al., 2017). Additionally, GM dysbiosis severity may differ between MCI and AD—most studies find reduced diversity in AD vs. MCI, but some report no differences (Guo et al., 2021; Zhao et al., 2025; Lwere et al., 2025; Wanapaisan et al., 2022).
To address these gaps, this meta-analysis: (1) compares GM diversity/abundance between AD spectrum patients and HC; (2) investigates the influence of clinical stage (MCI vs. AD) on GM alterations.
Methods
PICOD and research question
- Population: patients with AD and MCI;
- Intervention: Analysis of the gut microbiota in patients with AD, MCI, and systemically healthy subjects;
- Comparators: Systemically healthy subjects;
- Outcomes: Observation of changes in AD, MCI and systemic healthy gut microbiota;
- Design: Case–control studies.
The research question was: Are there significant difference in MDA levels in the saliva and blood of OC patients compared to the control group?
Literature search
In accordance with the Preferred Reporting Items for Systematic Reviews and Meta-Analyses (PRISMA) guidelines (Dubois et al., 2016) a comprehensive search was conducted across the PubMed, MEDLINE, Embase, and Web of Science databases from January 2022 to November 2025. However, in order to ensure comprehensiveness and account for delays in online publication, a screening criterion of online publication dates or search dates recorded in the databases on or after 1 January 2022 was applied. Consequently, a small number of publications with a print year of 2021 but an online publication date that met the criteria were also included. A comprehensive search strategy was employed, encompassing search terms related to AD, MCI, and gut microbiota (Supplementary material 1).
Eligibility criteria
Two reviewers independently screened the full-text articles for eligibility. The inclusion criteria were as follows: (1) Peer-reviewed original articles (English); (2) Comparative design (AD spectrum vs. HC); (3) GM profiles from stool samples; (4) Baseline data only (for interventional studies); (5) GM taxa investigated in ≥3 studies; (6) Sufficient statistical data for effect size calculation.
The exclusion criteria were as follows: (1) Review and non-literature (patent, conference abstract, preprint, erratum or chapter); (2) Animal studies; (3) Case reports.
Outcome measures
The primary outcomes encompassed GM diversity (including α diversity and β diversity) and disparities in GM abundance between patients with AD spectrum and HC. The secondary outcomes consisted of the effects of different countries and clinical stages on GM abundance.
Data extraction & bias assessment
Two reviewers extracted data (participant demographics, GM indices) and assessed bias using Risk of Bias Assessment Tool for Nonrandomized Studies (RoBANS) (Kim et al., 2013) (domains: selection, confounding, exposure measurement, blinding, incomplete data, selective reporting). Disagreements were resolved via consensus.
Statistical analysis
Effect sizes (Hedges’ g) were calculated using Comprehensive Meta-Analysis Version 3 software (Biostat Inc., Englewood, NJ, USA). Assuming non-substantial deviations from Gaussian distributions, we estimated means and standard deviations from medians, maxima, and minima using conversion formulas from Hozo et al. (2005). Heterogeneity was assessed via Q-statistic and I^2^ metric. Outliers were identified using 95% confidence interval (CI) thresholds (Noma et al., 2020; Viechtbauer and Cheung, 2010). Publication bias was quantitatively evaluated using Begg’s test, Egger’s test, and trim-and-fill (Begg and Mazumdar, 1994; Egger et al., 1997). Significance was set at p < 0.05.
Results
Study selection
11,141 articles were identified; 20 articles were included (Figure 1). Studies were conducted across 9 countries [Kazakhstan (Kaiyrlykyzy et al., 2022), South Korea (Kim et al., 2023; Kim et al., 2024), Japan (Yamashiro et al., 2024), Thailand (Wanapaisan et al., 2022), Turkey (Yıldırım et al., 2022), Uganda (Lwere et al., 2025), Spain (Cabrera et al., 2025; Mateo et al., 2024), China (Guo et al., 2021; Zhao et al., 2025; Chen et al., 2024; Fan et al., 2025; Fan et al., 2023; Hsu et al., 2025; Sheng et al., 2022; Zhu et al., 2022), U.S. (Kazen et al., 2025; McLeod et al., 2023; Sepúlveda-Rivera et al., 2025)] with 1,025 HC and 456 AD spectrum patients (AD = 198, MCI = 244, aMCI = 14) (Table 1).
Flow diagram of selected studies.
GM diversity
α diversity
The results demonstrated that AD spectrum patients demonstrated reduced α diversity as indexed by Shannon index (Hedges’s g = 0.287; 95% CI = 0.044 to 0.530; p = 0.020; n = 21) and Simpson indices (Hedges’s g = −1.235; 95% CI = −1.949 to −0.521; p = 0.001; n = 12) vs. HC (Figure 2). Stratification showed only the Simpson index differed between MCI/AD and HC.
Forest plots of Shannon index (A) and Simpson index (B) in the comparisons between healthy controls (HC) and Alzheimer’s disease (AD) spectrum. Patients with AD spectrum consisted of mild cognitive impairments (MCI) and AD.
β diversity
Among all the included articles except for four studies (Wanapaisan et al., 2022; Mateo et al., 2024; Kazen et al., 2025; Sepúlveda-Rivera et al., 2025), sixteen indicators of β diversity were assessed. Results were inconsistent—weighted UniFrac distances showed significant differences in 3 studies (Guo et al., 2021; Zhao et al., 2025; Lwere et al., 2025) but not 5 others (Kaiyrlykyzy et al., 2022; Yamashiro et al., 2024; Fan et al., 2025; Fan et al., 2023; McLeod et al., 2023); unweighted UniFrac showed significance in 1 study (Yamashiro et al., 2024) but not 3 others (Fan et al., 2025; Fan et al., 2023; McLeod et al., 2023) (Table 2).
GM abundance
In terms of the phylum level (Figures 3A–C), no significant differences in Firmicutes (Hedges’s g = −2.173; 95% CI = −1.296 to 5.642; p = 0.219; n = 3), Proteobacteria (Hedges’s g = 1.984; 95% CI = −0.755 to 4.722; p = 0.156; n = 3) and Verrucomicrobia (Hedges’s g = −0.040; 95% CI = −0.967 to 0.887; p = 0.933; n = 3) between AD spectrum and HC due to high heterogeneity.
Forest plots of alterations of gut microbiota at the phylum level and genus level, including Firmicutes (A), Proteobacteria (B), Verrucomicrobia (C), Bacteroides (D), Prevotella (E), and Megamonas (F). AD, Alzheimer’s disease; MCI, mild cognitive impairments.
In terms of the genus level (Figures 3D–F), no significant differences in Bacteroides (Hedges’s g = −0.154; 95% CI = −1.424 to 1.116; p = 0.812; n = 4), Prevotella (Hedges’s g = −0.540; 95% CI = −1.673 to 0.593; p = 0.350; n = 3) and Megamonas (Hedges’s g = −0.424; 95% CI = −1.264 to 0.417; p = 0.323; n = 4) in AD spectrum patients vs. HC.
Secondary outcome: clinical stage effects
The abundance of Proteobacteria was decreased in MCI vs. HC (Hedges’s g = 0.985, 95% CI = 0.323 to 1.646, p = 0.004; n = 2) but not AD vs. HC (Hedges’s g = 2.505, 95% CI = −2.680 to 7.690, p = 0.344; n = 2). Firmicutes showed a trend toward reduction in AD vs. HC (g = 2.891, p < 0.001) In addition, we found a trend toward decreased abundance of Firmicutes in the patients with AD (Hedges’s g = 2.891, 95% CI = −2.216 to 7.998, p < 0.001; n = 2) (Table 3).
Bias & heterogeneity
The quality of the included studies is summarized in Figure 4. It was determined that each study was to be categorized as low risk, in accordance with the evaluation criteria outlined in the study’s methodology. With regard to data completeness, all studies except one were rated as low risk. However, concerning the confounding variables criterion, all studies were rated as high risk of bias due to the potential influence of confounding factors, such as body mass index, diabetes, and diet, on brain grey matter structure. Publication bias was minimal (Table 4). High heterogeneity was observed across studies.
Risk of bias assessment of 20 included studies using RoBANS. RoBANS, Risk of Bias Assessment tool for Non-randomized Studies.
Discussion
This meta-analysis confirms three key findings: (1) Reduced GM diversity: AD patients have lower GM diversity than HC, consistent with prior research (Vogt et al., 2017; Liu et al., 2019). (2) Stage-specific alterations: Proteobacteria reduction is prominent in MCI, while Firmicutes reduction is more pronounced in AD—suggesting GM dysbiosis progresses with cognitive decline. (3) Pathogenic taxa: Elevated Megamonas (linked to metabolic diseases) and Bacteroides [inhibits microglial Aβ clearance (Wasén et al., 2024)] may contribute to AD pathology.
The present study conducted a meta-analysis with the objective of comparing GM abundance between patients with AD spectrum and HC, and yielded three major insights into the nature of GM alterations in AD spectrum. First, patients diagnosed with AD demonstrated a reduction in GM diversity when compared to HC. Second, the microbiota present in AD and MCI remain the subject of considerable research, with a paucity of consistent findings across studies. Finally, the abundance of Bacteroides and Megamonas was progressively increased from HC to AD stage, while the abundance of Firmicutes and Proteobacteria was gradually reduced from HC to AD stage.
A plethora of studies have indicated that alpha diversity is significantly reduced in patients with AD (Vogt et al., 2017; Liu et al., 2019), yet this phenomenon has not been observed in those with MCI (Nagpal et al., 2019; Liu et al., 2021). These findings contrast with the results of our meta-analysis, which also reveal a significant reduction in MCI, in addition to a progressive decline from MCI to AD.
The Bacteroides is a major genus of gram-negative bacteria. It is noteworthy that prior studies have demonstrated that members of the Bacteroidetes phylum participate in the pathogenesis of AD by inhibiting the phagocytic function of microglia, leading to impaired β-amyloid clearance and the accumulation of amyloid plaques (Wasén et al., 2024). Despite the absence of a clearly delineated category, the text provides a modicum of direction.
A previous association has been identified between Megamonas and Pre-DM (Zhang et al., 2013), gestational DM (Kuang et al., 2017), and obesity (Chen et al., 2020). It is hypothesized that Megamonas may contribute to cerebral Aβ deposition via its role in metabolic diseases, given that both midlife obesity and DM are associated with increased risk of AD dementia or increased AD pathology.
Recent clinical trials have indicated that subjects diagnosed with MCI exhibit a substantially elevated prevalence of Prevotella species in their gut microbiota when compared with cognitively healthy individuals. This finding identifies specific gut microbial taxa associated with cognitive function in middle-aged and elderly populations. Should these findings be replicated, these taxonomic groups may serve as key early indicators of MCI and facilitate successful cognitive ageing through probiotic, prebiotic, and synbiotic interventions.
Despite considerable heterogeneity, this level is within expectations given the observational designs and multifactorial influences on gut microbiota. Heterogeneity primarily stems from clinical and methodological diversity: differences in AD/MCI diagnostic criteria, geography and diet, 16S rRNA sequencing platforms, and bioinformatics pipelines. Notably, all studies showed consistent effect directions, demonstrating progressive dysbiosis along the HC–MCI–AD continuum. Meta-regression and sensitivity analyses confirmed that no single study disproportionately influenced the pooled estimates. Thus, while precise effect magnitudes require further quantification, the qualitative conclusion—progressive dysbiosis accompanies cognitive decline—is robust. This meta-analysis informs future longitudinal studies and intervention strategies.
Notwithstanding the findings of the present study, there are certain limitations that must be acknowledged. Firstly, small sample sizes and geographic variability limit generalizability. Secondly, High heterogeneity due to differences in diet, clinical settings, and AD inclusion criteria. In the future, larger cohort studies are needed to validate stage-specific GM alterations and explore therapeutic targets (e.g., probiotics targeting Firmicutes or Proteobacteria).
The reference list from the paper itself. Each links out to its DOI / PubMed record.
- 1Atefi N. Fallahpour M. Sharifi S. Ghassemi M. Roohaninasab M. Goodarzi A. (2022). Probiotic as an adjuvant therapy in chronic urticaria: a blinded randomized controlled clinical trial. Eur Ann Allergy Clin Immunol 54, 123–130. doi: 10.23822/Eur Ann ACI.1764-1489.200, 33939347 · doi ↗ · pubmed ↗
- 2Begg C. B. Mazumdar M. (1994). Operating characteristics of a rank correlation test for publication bias. Biometrics 50, 1088–1101, 7786990 · pubmed ↗
- 3Bonaz B. Bazin T. Pellissier S. (2018). The Vagus nerve at the Interface of the microbiota-gut-brain Axis. Front. Neurosci. 12:49. doi: 10.3389/fnins.2018.0004929467611 PMC 5808284 · doi ↗ · pubmed ↗
- 4BuhașM. C. Candrea R. GavrilașL. I. Miere D. Tătaru A. Boca A. . (2023). Transforming psoriasis care: probiotics and prebiotics as novel therapeutic approaches. Int. J. Mol. Sci. 24:11225. doi: 10.3390/ijms 24131122537446403 PMC 10342574 · doi ↗ · pubmed ↗
- 5Cabrera C. Carrión N. Mateo D. Vicens P. Pinzón A. Heredia L. . (2025). Gut microbiota characterization in ageing, mild cognitive impairment, and Alzheimer's disease in the context of Mediterranean lifestyle in a Spanish population. Alzheimer's Res. Ther. 17:211. doi: 10.1186/s 13195-025-01862-z, 41029837 PMC 12482474 · doi ↗ · pubmed ↗
- 6Chen Y. Li Y. Fan Y. Chen S. Chen L. Chen Y. . (2024). Gut microbiota-driven metabolic alterations reveal gut-brain communication in Alzheimer's disease model mice. Gut Microbes 16:2302310. doi: 10.1080/19490976.2024.2302310, 38261437 PMC 10807476 · doi ↗ · pubmed ↗
- 7Chen C. Liao J. Xia Y. Liu X. Jones R. Haran J. . (2022). Gut microbiota regulate Alzheimer's disease pathologies and cognitive disorders via PUFA-associated neuroinflammation. Gut 71, 2233–2252. doi: 10.1136/gutjnl-2021-326269, 35017199 PMC 10720732 · doi ↗ · pubmed ↗
- 8Chen X. Sun H. Jiang F. Shen Y. Li X. Hu X. . (2020). Alteration of the gut microbiota associated with childhood obesity by 16S r RNA gene sequencing. Peer J 8:e 8317. doi: 10.7717/peerj.831731976177 PMC 6968493 · doi ↗ · pubmed ↗