Precursor-dependent optical and structural properties of eleven NIR-emissive graphene quantum dots for bioimaging applications
Diya Vashani, Himish Paul, Steven Nguyen, Ugur C Topkiran, Alina R Valimukhametova, Abby Dorsky, Olivia Sottile, Lal Durmaz, Roberto Gonzalez-Rodriguez, Anton V Naumov

TL;DR
This paper describes the creation of 11 types of biocompatible graphene quantum dots that emit near-infrared light, suitable for bioimaging and cell tracking.
Contribution
The study introduces a new set of 11 distinct NIR-emissive graphene quantum dots synthesized from various precursors.
Findings
Eleven distinct GQD structures were synthesized using different precursors and exhibit NIR fluorescence.
All GQDs are biocompatible at concentrations up to 2.20 mg ml−1 and can be tracked in vitro.
The GQDs show effective internalization in human embryonic kidney-293 cells.
Abstract
Graphene quantum dots (GQDs) have emerged as important bioimaging tools because of their biocompatibility and the ability of some to perform deep-penetration near-infrared (NIR) fluorescence imaging. The development of NIR-fluorescent GQDs from various precursors can enhance their use in multiplex imaging, multi-analyte sensing, and combination therapy delivery. Herein, we present the synthesis of an unprecedented set of 11 distinct GQD structures capable of NIR fluorescence, achieved through microwave-assisted bottom-up carbonization of 11 precursors: ascorbic acid, chitosan, citric acid–urea, dextran, glucose, glucosamine hydrochloride, hyaluronic acid, L-glutamic acid, polyethylene glycol, sodium cholate, or sodium citrate. All GQDs exhibit biocompatibility at up to 2.20 mg ml−1 and can be tracked in vitro by their NIR fluorescence, while demonstrating effective internalization in…
Genes, proteins, chemicals, diseases, species, mutations and cell lines named across the full text — each resolved to its canonical identifier and authoritative record.
Click any figure to enlarge with its caption.
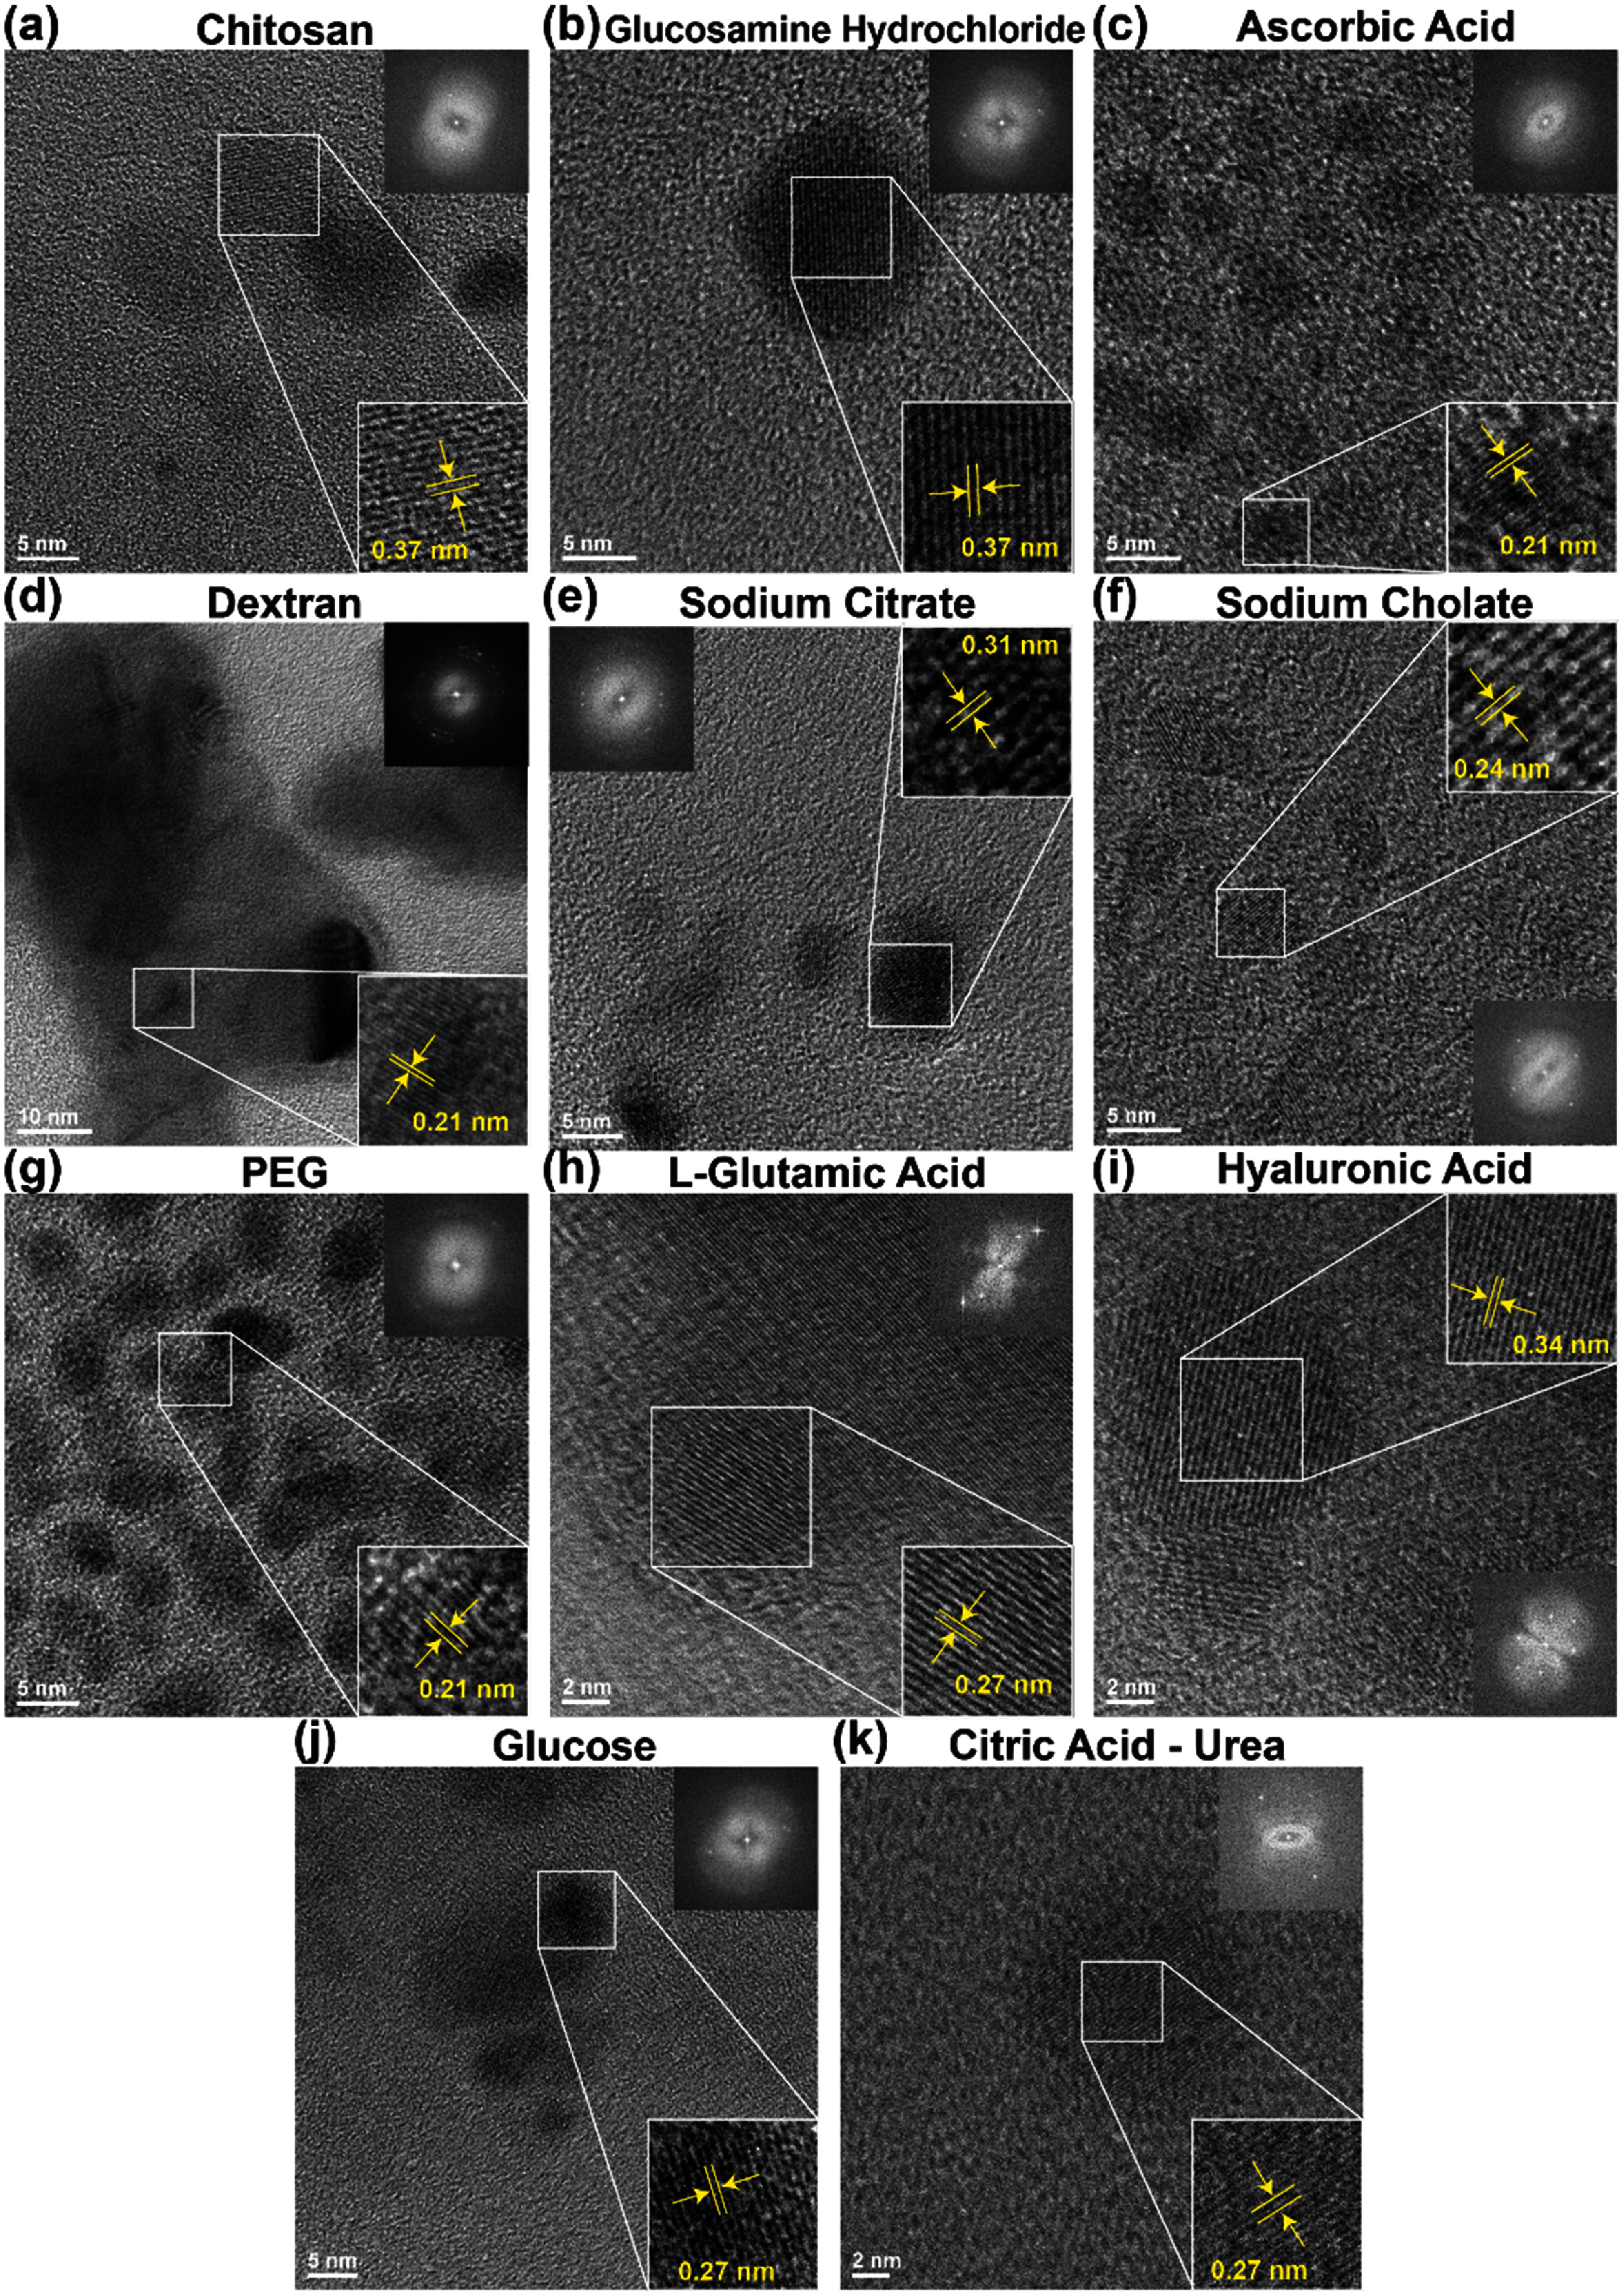 Figure 1
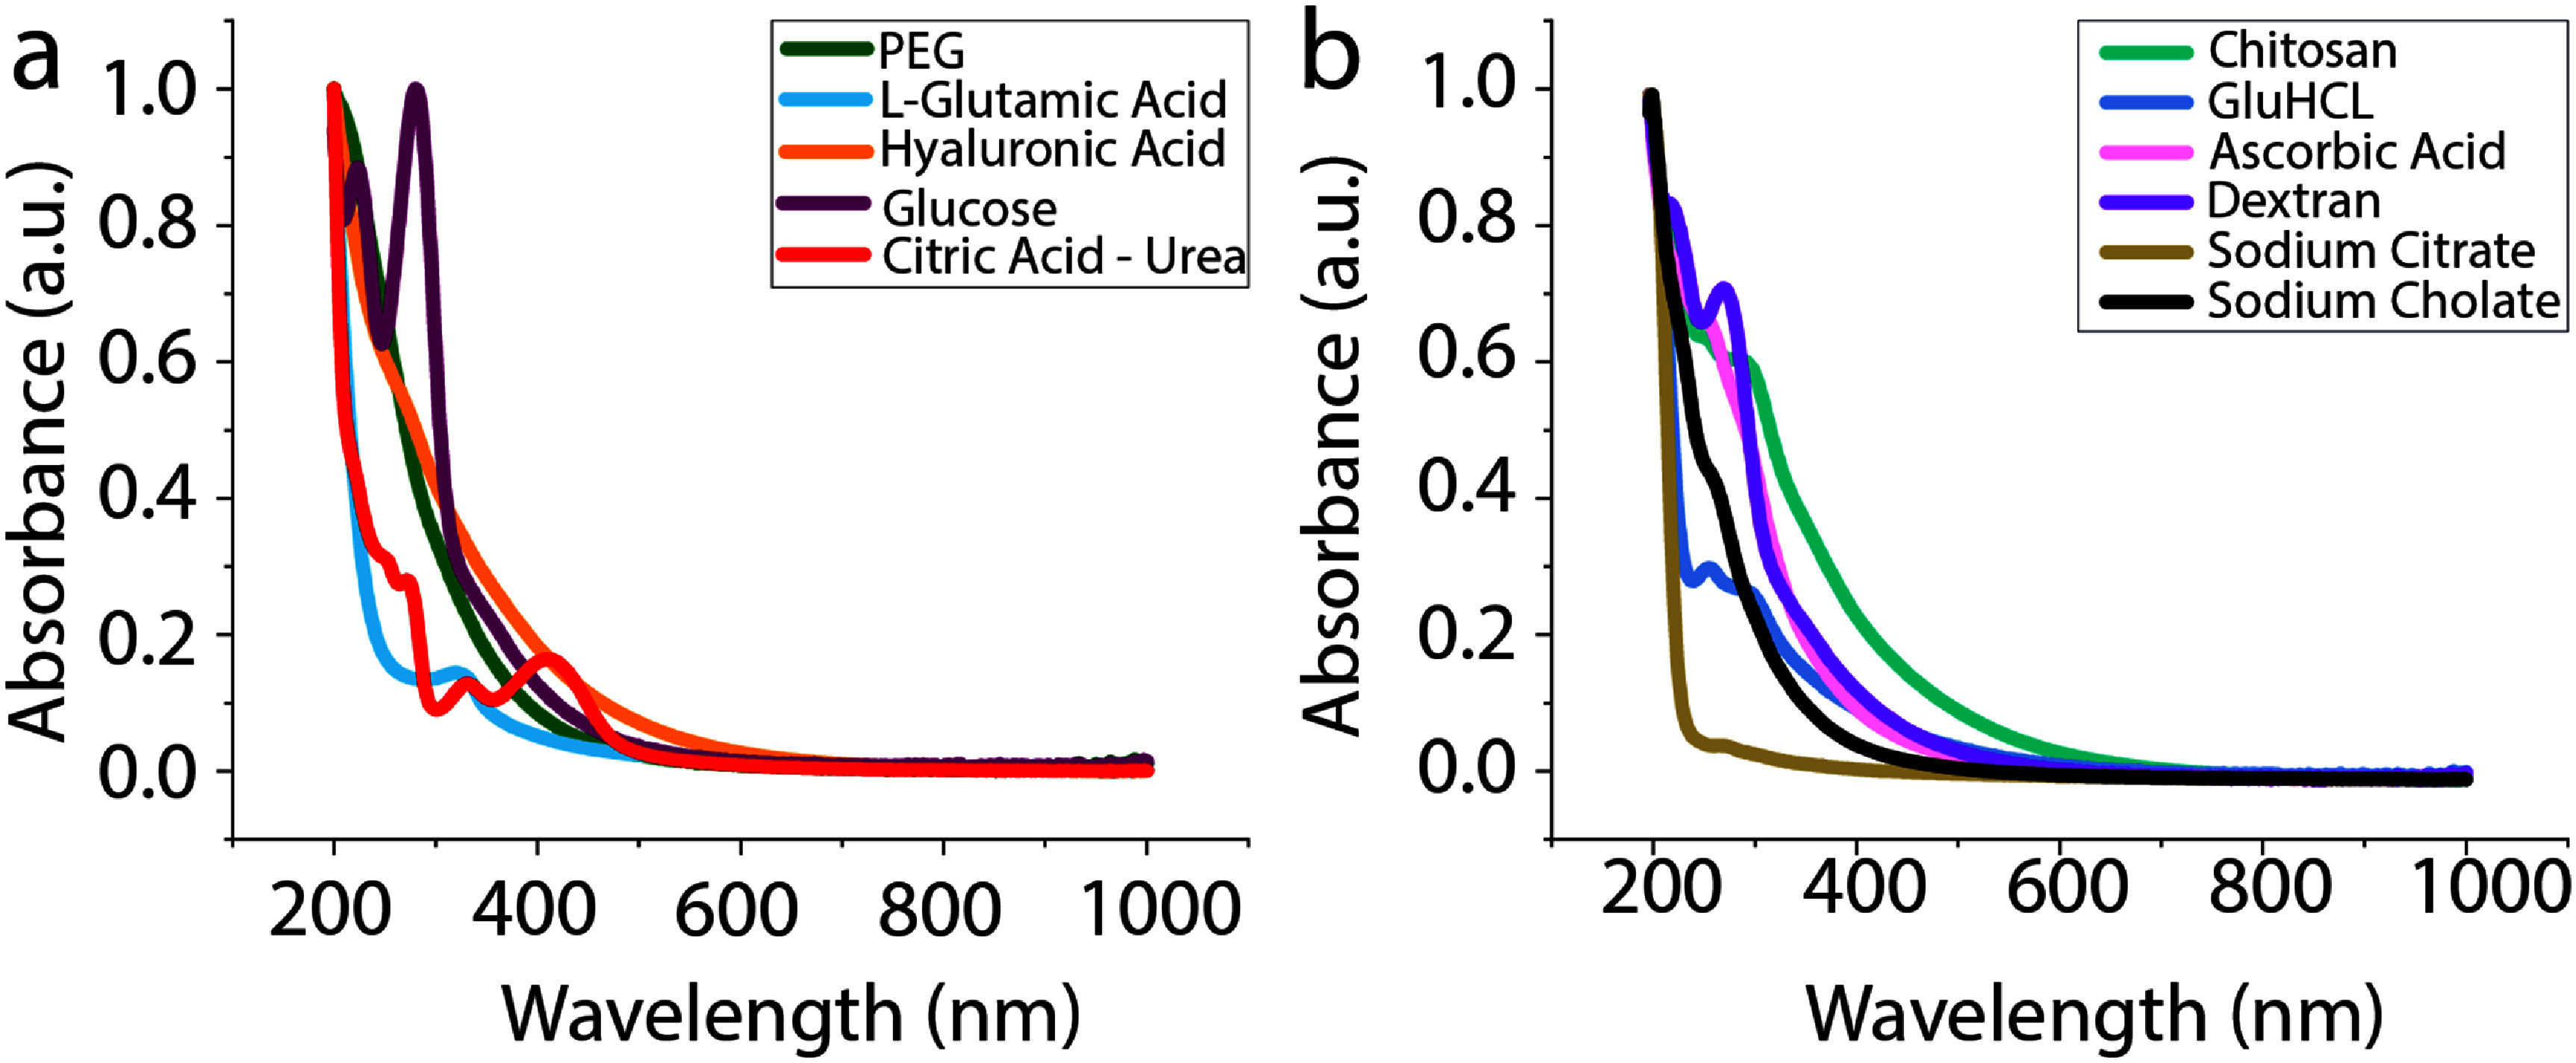 Figure 2
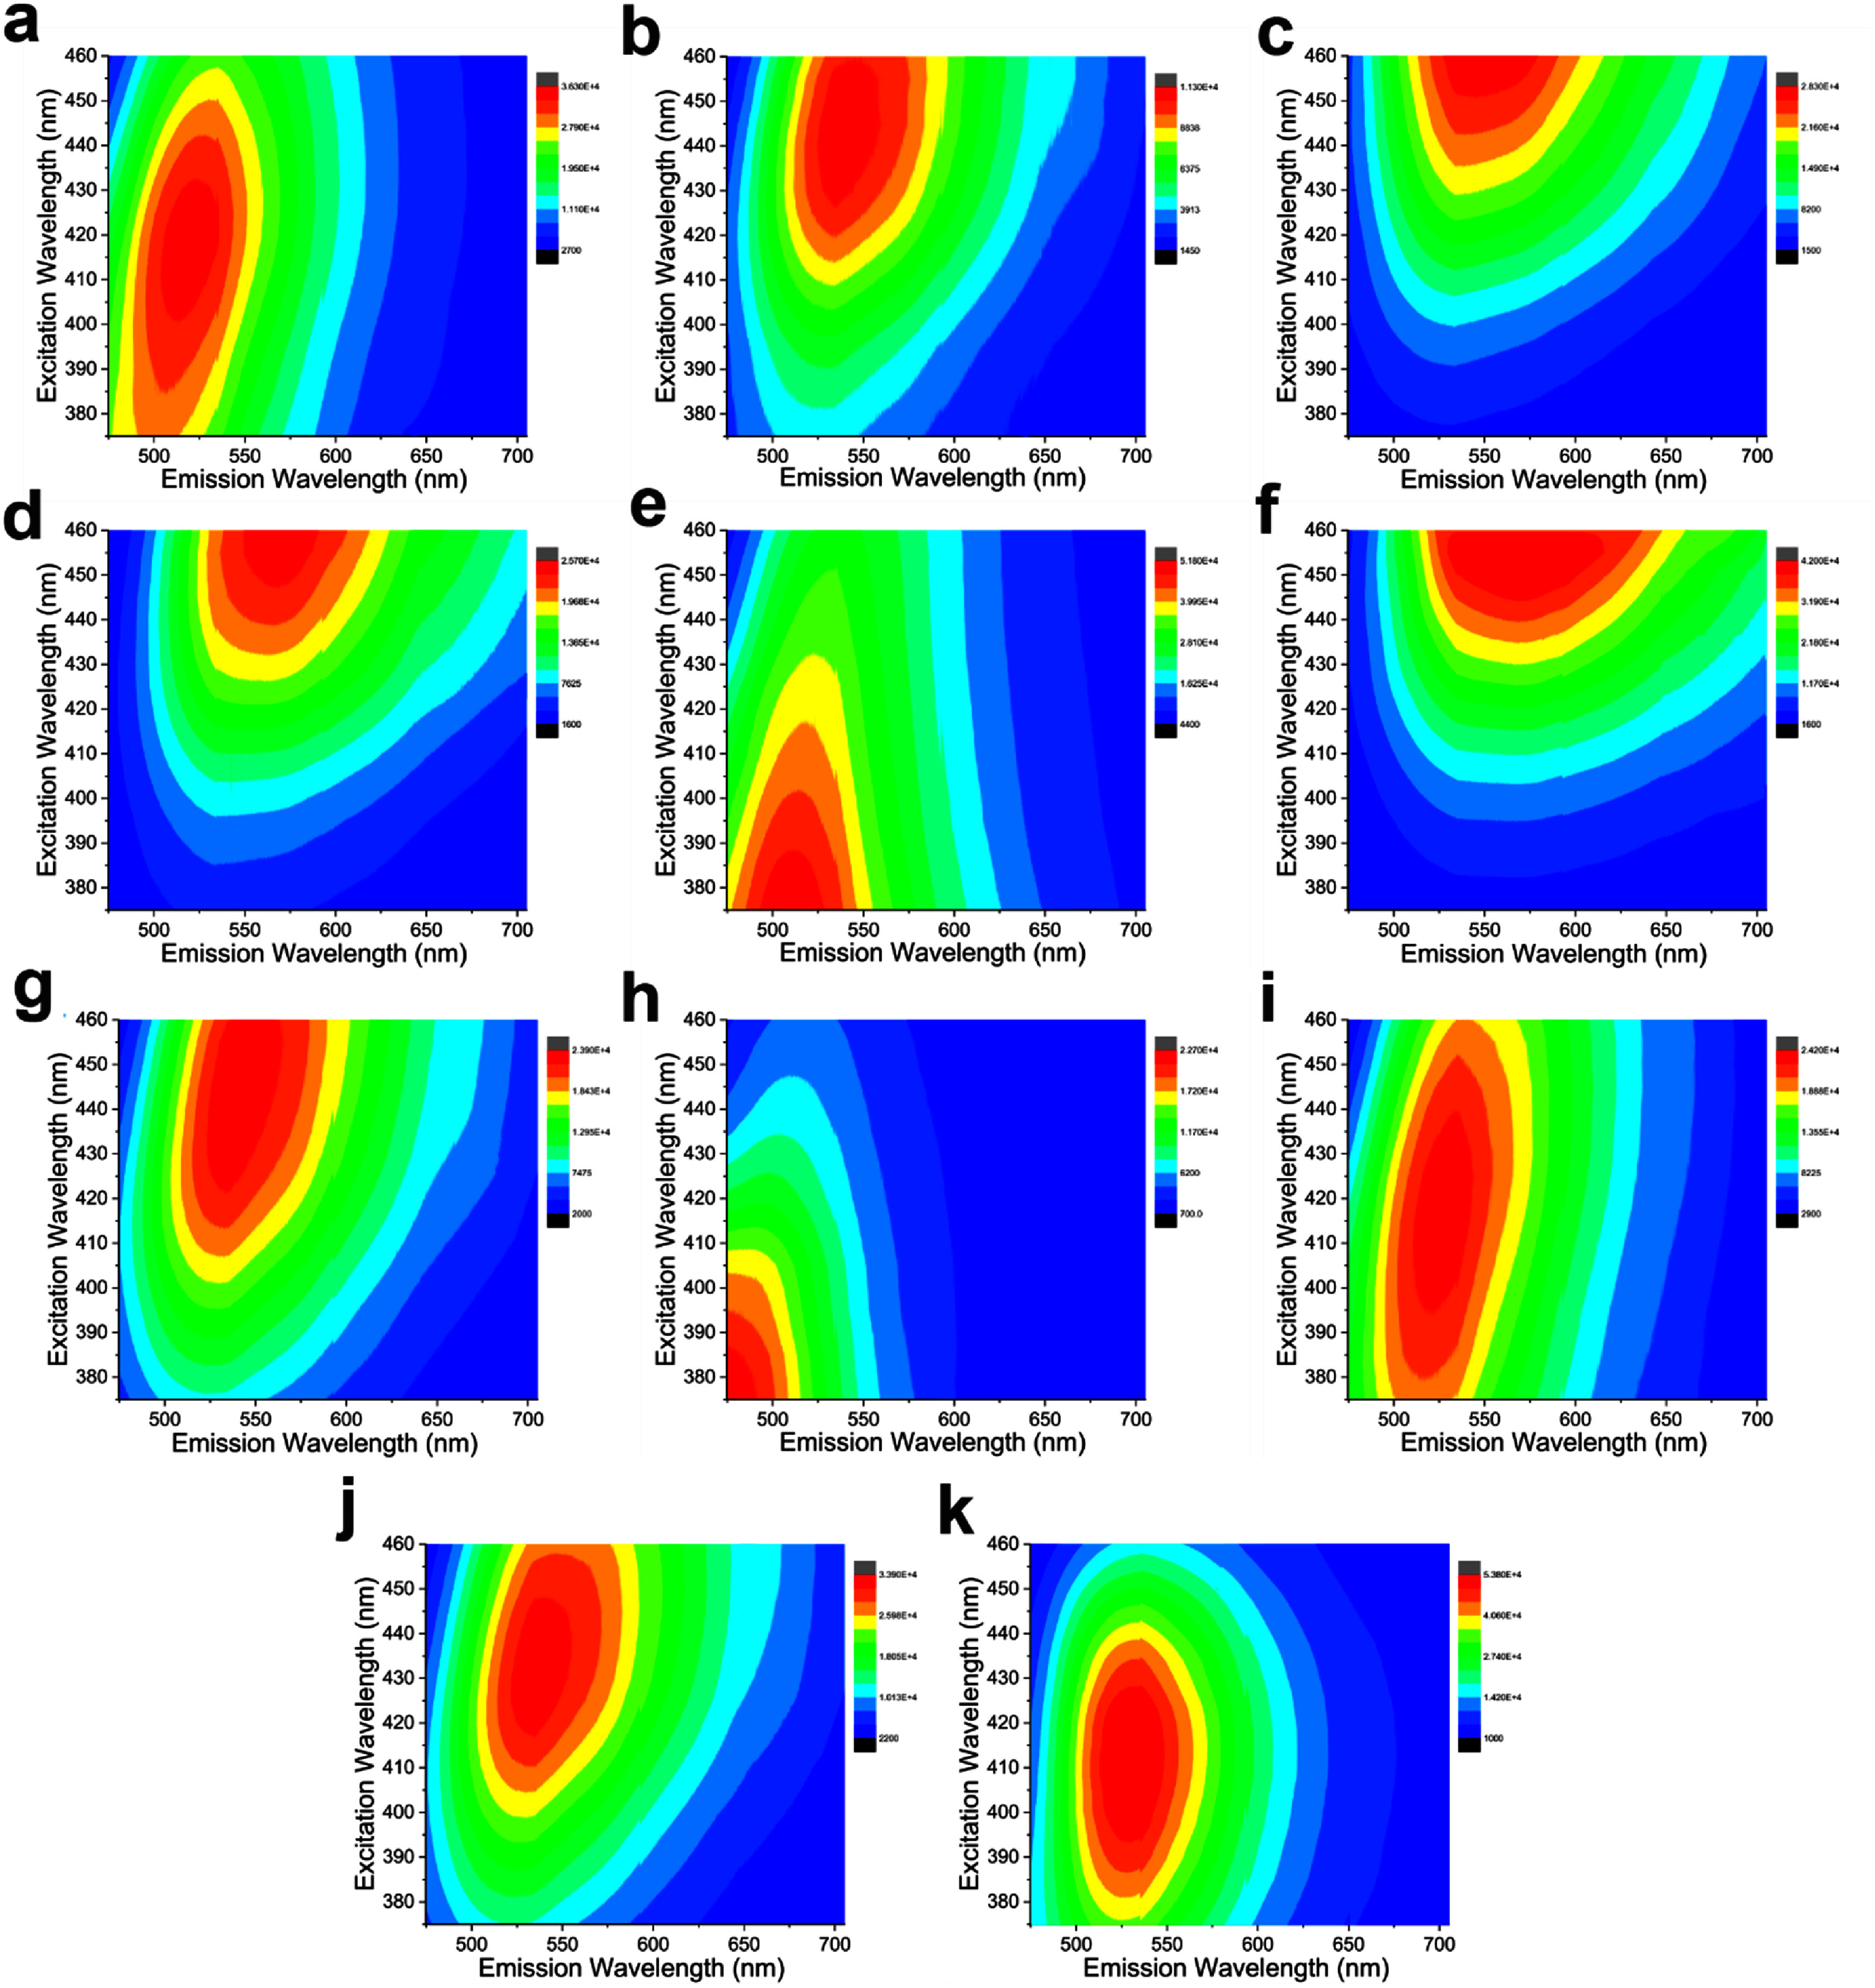 Figure 3
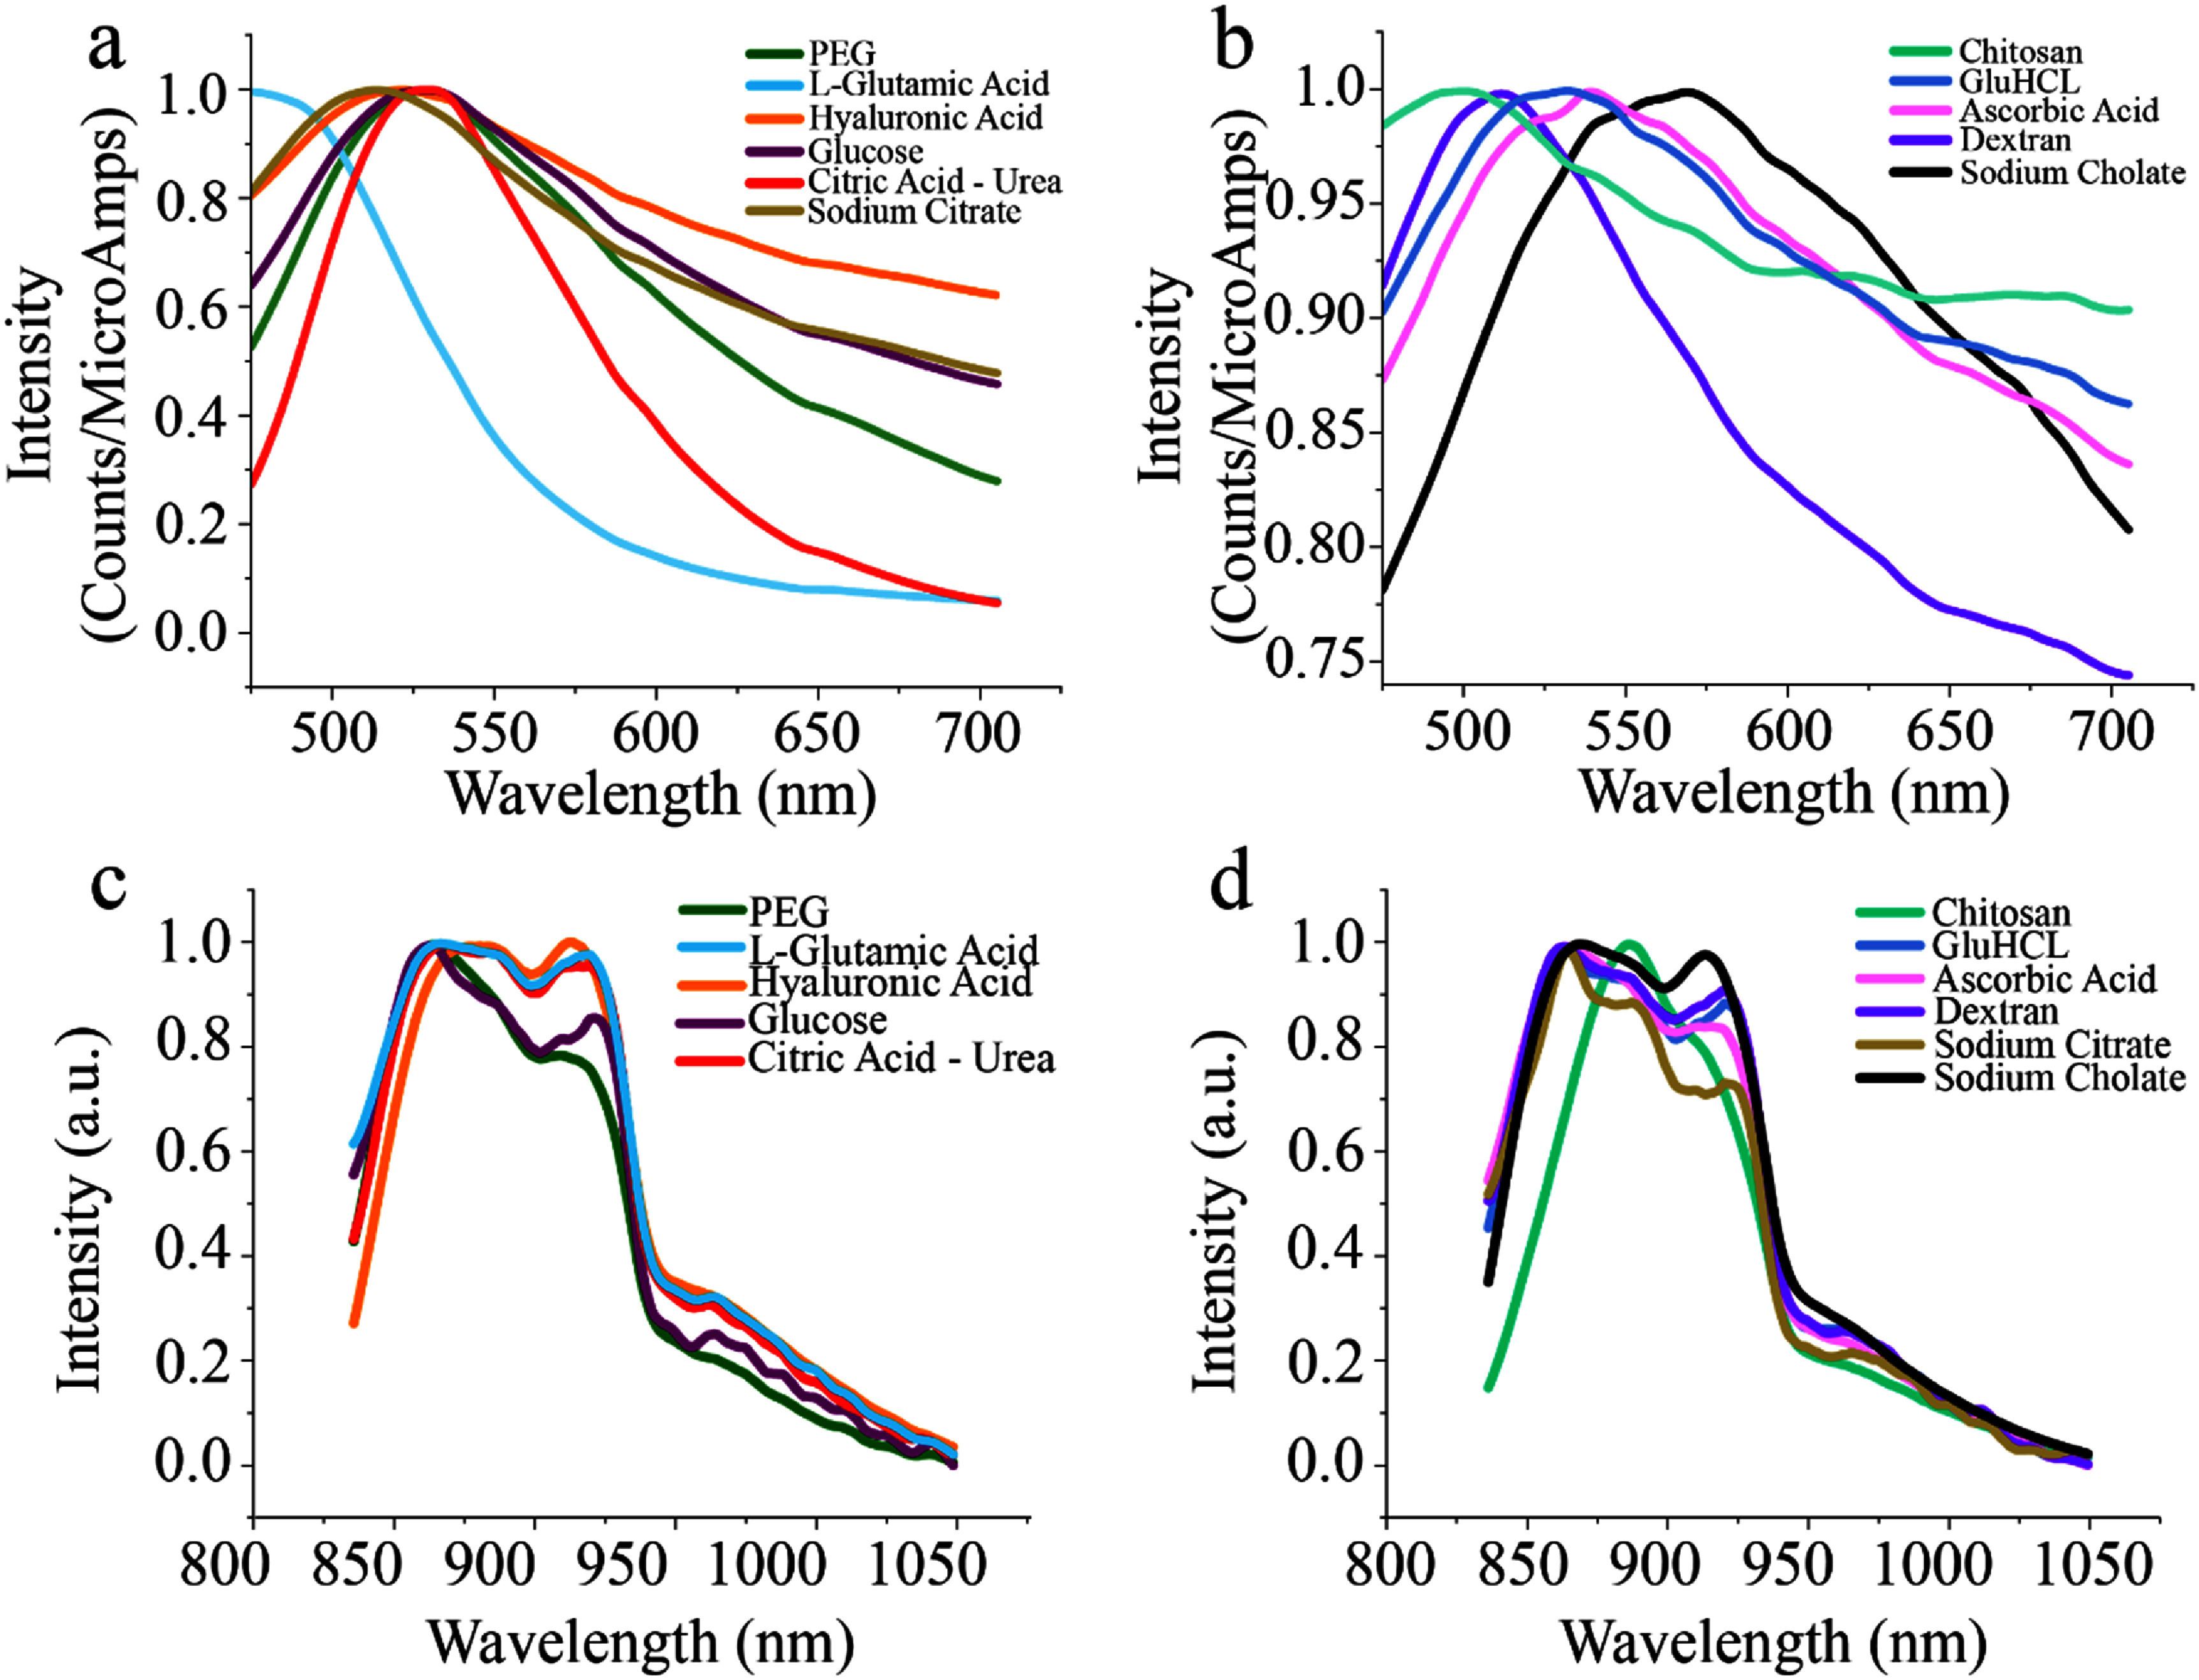 Figure 4
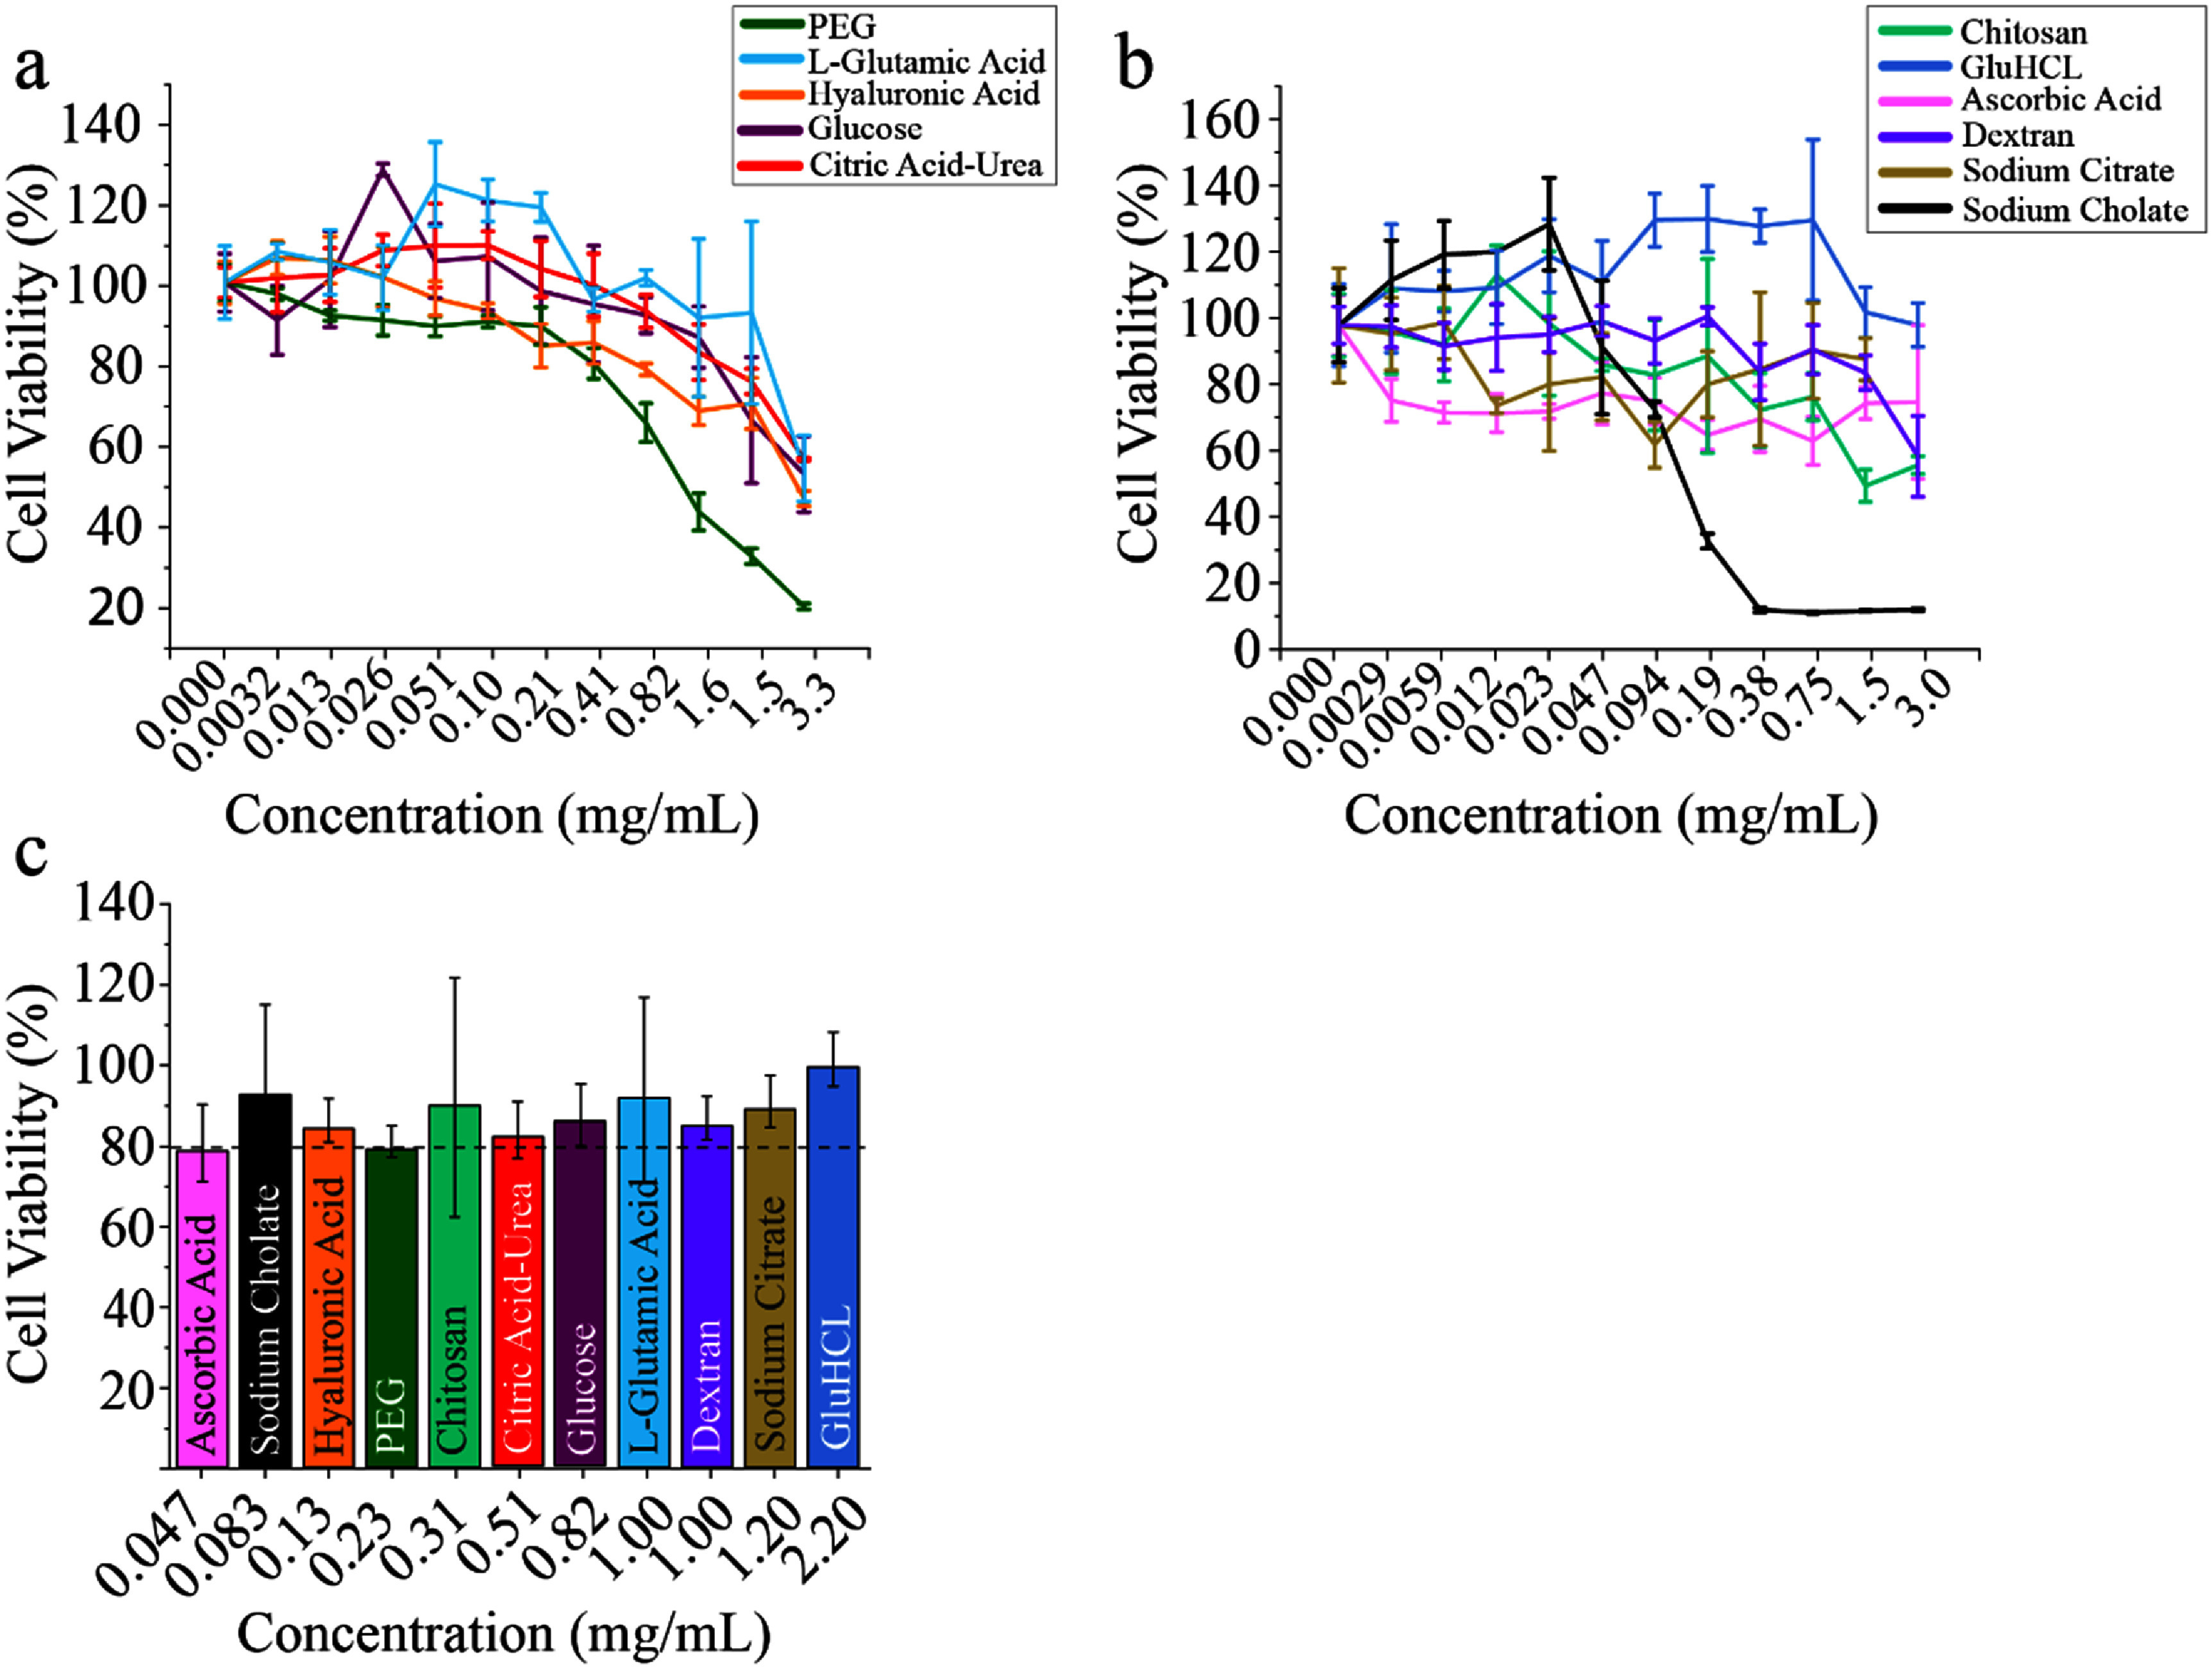 Figure 5
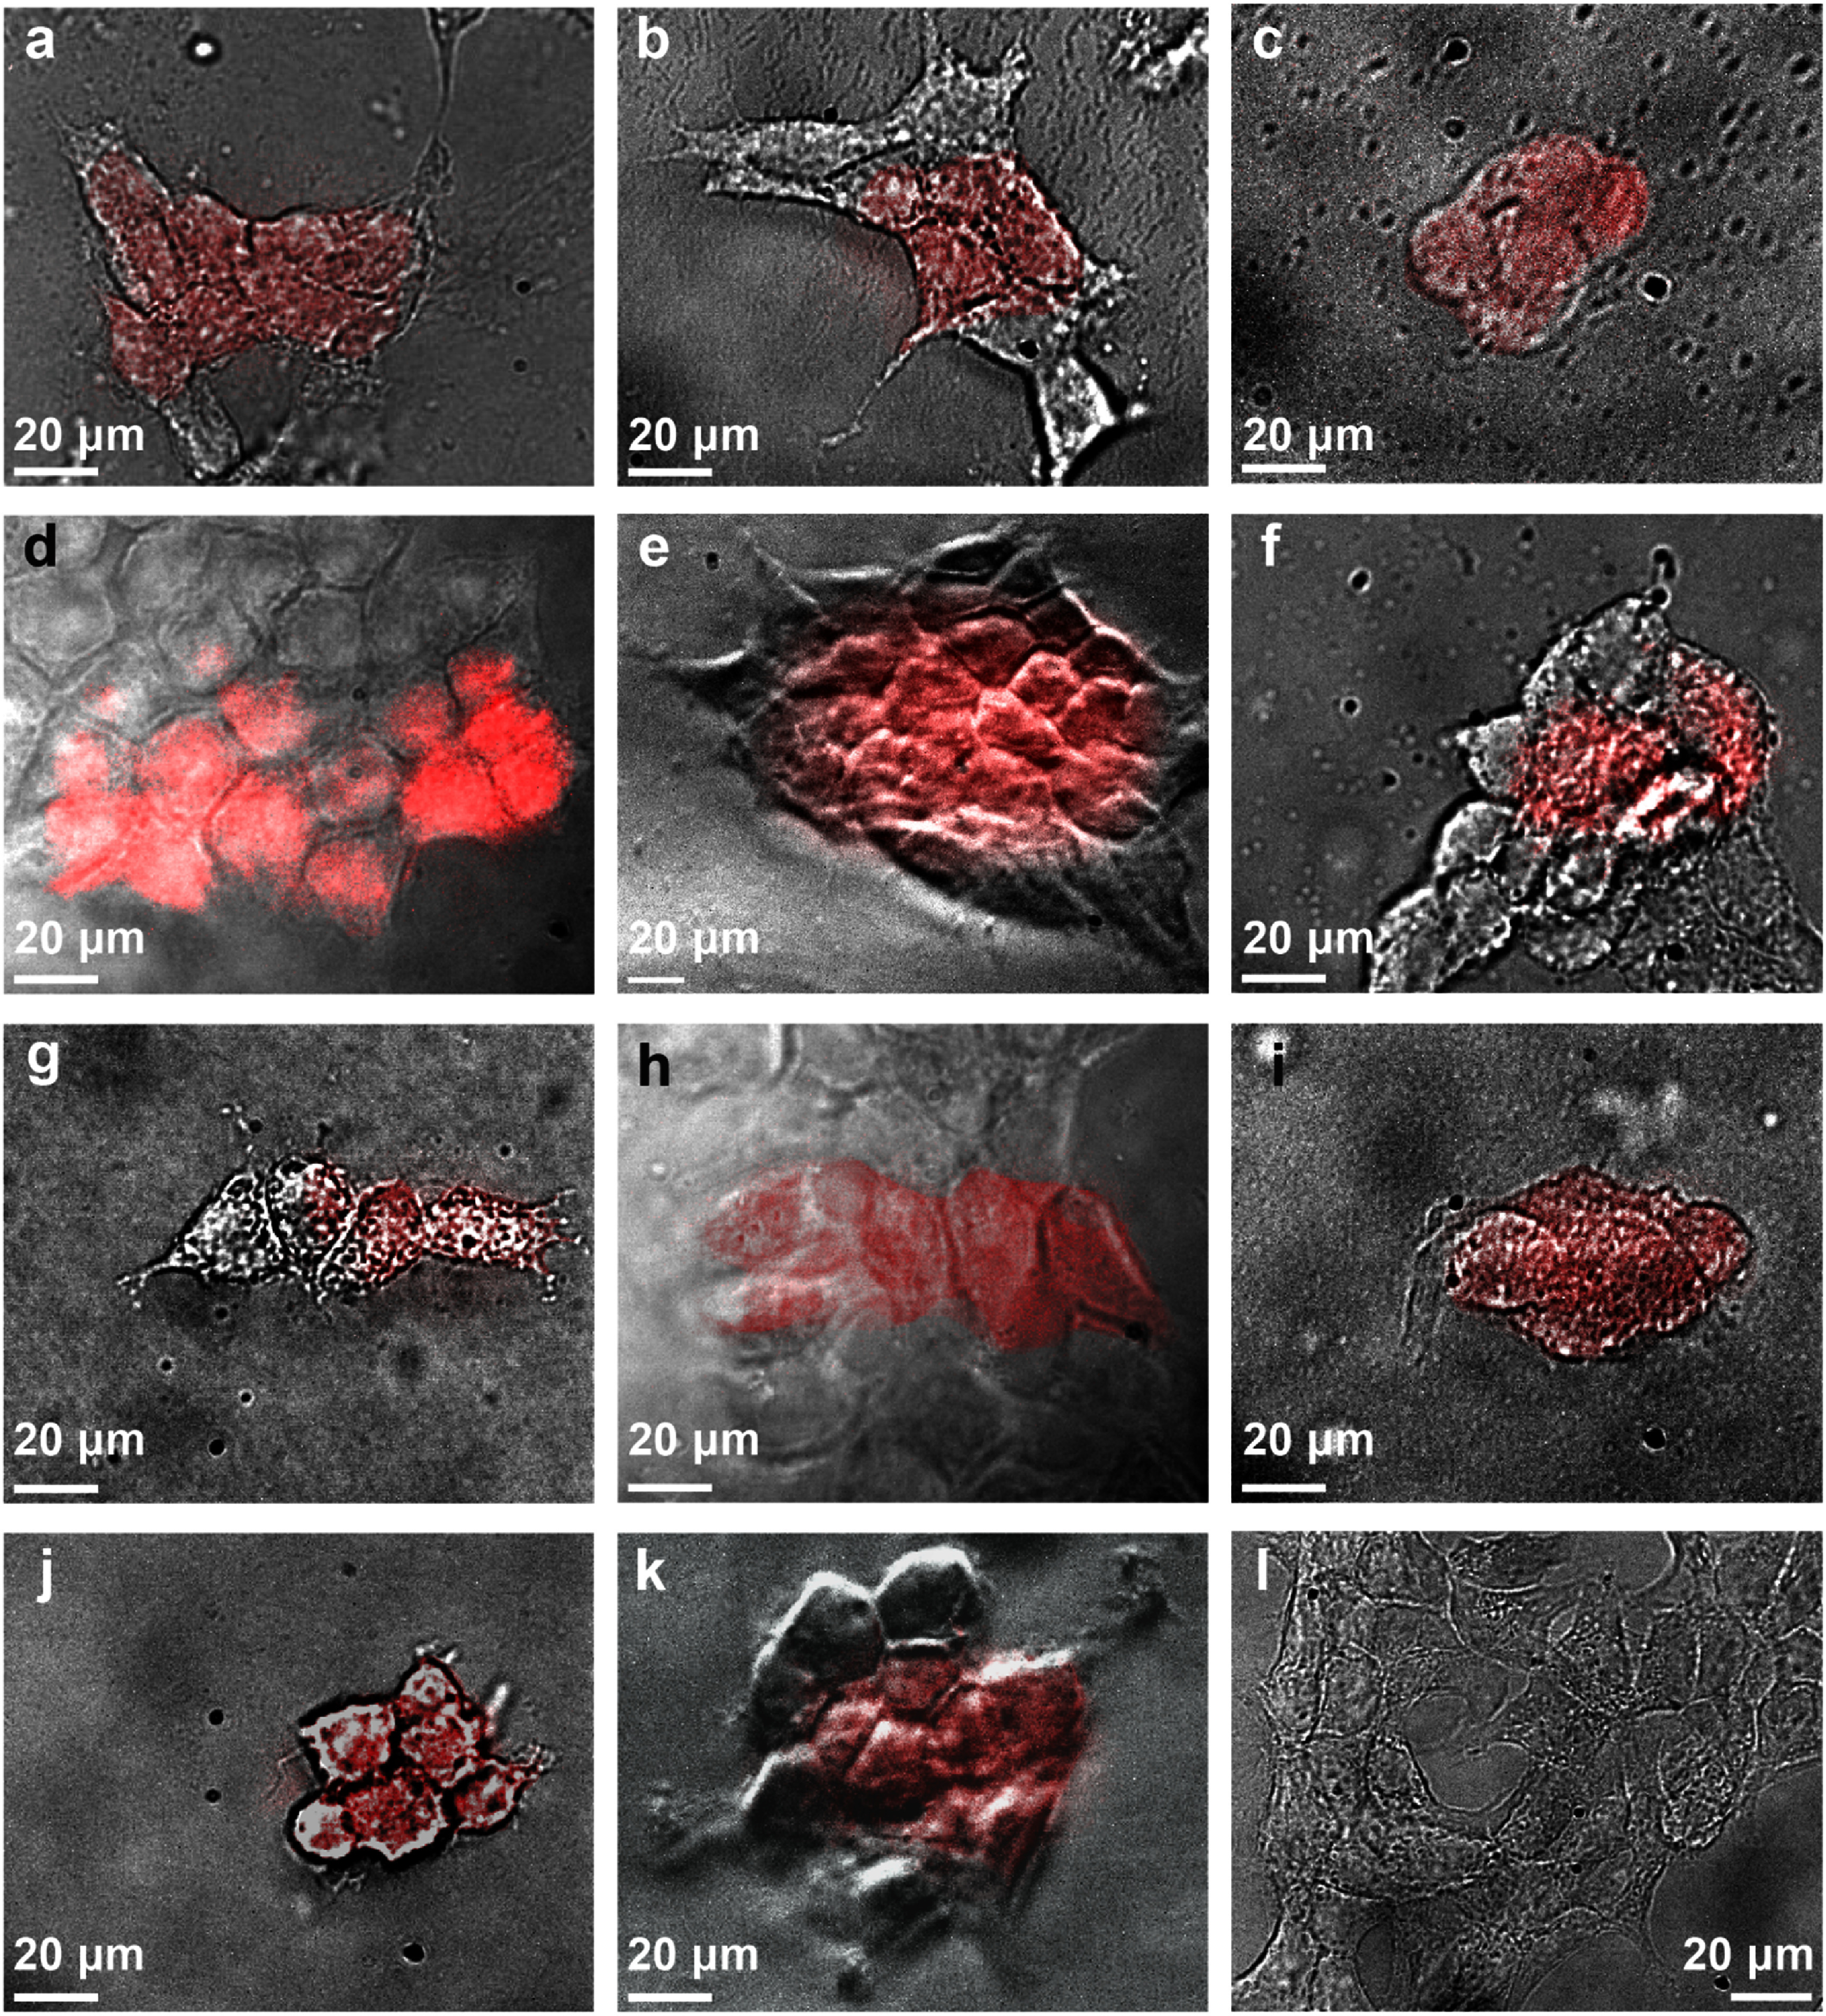 Figure 6
| GQD | Synthesis time (mins) | Synthesis yield (%) |
|---|---|---|
| Sodium citrate | 20 | 2 |
| Sodium cholate | 120 | 36 |
| Ascorbic acid | 18 | 3 |
| Chitosan | 17 | 16 |
| Dextran | 60 | 22 |
| Glucose | 20 | 45 |
| PEG | 60 | 16 |
| Hyaluronic acid | 22 | 17 |
| Citric acid–urea | 10 | 15 |
| Glucosamine hydrochloride | 17 | 3 |
| L-glutamic acid | 16 | 13 |
| GQD | Mean size (nm) | Interplanar spacing (nm) | Zeta potential (mV) |
|---|---|---|---|
| Sodium citrate | 3.84 ± 0.93 | 0.31 | −51.81 ± 0.49 |
| Sodium cholate | 3.32 ± 0.17 | 0.24 | −36.49 ± 1.61 |
| Ascorbic acid | 3.13 ± 0.12 | 0.21 | −27.64 ± 0.47 |
| Chitosan | 4.15 ± 0.21 | 0.37 | −10.74 ± 0.54 |
| Dextran | 4.47 ± 0.25 | 0.21 | −7.35 ± 0.36 |
| Glucose | 6.63 ± 0.53 | 0.27 | −5.22 ± 0.84 |
| PEG | 2.81 ± 0.07 | 0.21 | −4.49 ±0.57 |
| Hyaluronic acid | 4.95 ± 0.37 | 0.34 | −3.38 ± 1.22 |
| Citric acid–urea | 13.47 ± 0.82 | 0.27 | 2.76 ± 0.47 |
| Glucosamine hydrochloride | 5.12 ± 0.28 | 0.37 | 4.93 ± 0.11 |
| L-glutamic acid | 3.39 ± 0.11 | 0.27 | 6.95 ± 0.58 |
- —National Institute of Biomedical Imaging and Bioengineering10.13039/100000070
Peer Reviews
No public reviews on file for this paper yet. If you reviewed it on a platform where reviews are public (OpenReview, ICLR, NeurIPS, ICML), you can paste yours below so the community can read it here.
Videos
No videos yet. Explain this paper in a talk, walkthrough, or lecture? Add one.
Taxonomy
TopicsCarbon and Quantum Dots Applications · Graphene and Nanomaterials Applications · Nanoplatforms for cancer theranostics
Introduction
Over the past decades, fluorescence imaging has garnered much interest in drug delivery, cellular monitoring, and guided surgery as a commercially available, sensitive, and non-invasive technique [1–3]. Fluorescence imaging in the first near-infrared (NIR) window (NIR-I, 700–900 nm) is well established in the clinical setting due to its minimal biological tissue attenuation and nearly no autofluorescence compared to lower wavelengths [4, 5]. This results in greater penetration depth and a higher signal-to-background ratio for NIR fluorescent probes, making this spectral region advantageous for bioimaging [4]. However, unlike visible fluorophores, their NIR counterparts are scarce and present certain limitations. Indocyanine green (ICG), a commonly used NIR fluorescent dye approved for clinical use by the food and drug administration, exhibits limited photostability and a moderate fluorescence quantum yield. Additionally, ICG has a strong tendency to bind plasma proteins and to aggregate in aqueous and physiological environments, leading to fluorescence quenching, rapid systemic clearance, and short in vivo signal persistence [6], hampering long-term observation studies. Polymethine dyes are prone to chemical and photochemical degradation in solution due to the high reactivity of their extended conjugated backbones, which compromises fluorescence reliability in biological environments [7]. Within this class of organic NIR fluorophores, small-molecule probes such as cyanines may exhibit lower toxicity and a short biological half-life. However, not only are these probes vulnerable to photobleaching, but their synthesis generally relies on multistep synthetic processes and extensive purification, which can hinder scalability and broader translational use [8, 9]. These limitations highlight the need to develop diverse NIR fluorophores, especially for applications in therapeutic delivery/tracking, multiplex imaging, and sensing, where probes with tunable emission wavelengths and distinct structural properties can be instrumental.
This niche can be filled by nanoparticles that provide fluorescence imaging and therapeutic transport to the disease site, enhanced by targeting or therapeutic modalities, such as photothermal and photodynamic therapies [10, 11]. Therapeutic delivery with real-time tracking enables precise localization and controlled release, significantly improving treatment efficacy and reducing off-target effects. Such systems are particularly beneficial in cancer therapy, where precise targeting and imaging-guided drug release can enhance the selectivity and effectiveness of treatments, as demonstrated in recent studies involving targeted drug delivery and imaging in glioblastoma [12] and lung cancer [13]. Several members of the rapidly expanding family of carbon-based nanomaterials, including graphene oxide (GO), carbon dots, graphene quantum dots (GQDs), and carbon nanotubes (CNTs), offer NIR tracking capabilities via their intrinsic fluorescence emission [14–16]. These materials also enable simultaneous therapeutic delivery for a wide range of conditions, including prostate [17, 18], breast [19–21], and liver cancers [22], as well as neurological disorders [23–26]. Nanocarbons can also facilitate a standalone treatment of several cancers through photothermal and gene therapies [27, 28]. However, further transition to clinic is limited for some forms of nanocarbons due to apparent toxicity and immunogenicity effects [29], facilitating impairment of mitochondrial function, genetic damage, lysosomal damage, and ultimately, cell death [30–32].
Unlike those, GQDs have recently been considered among the least toxic nanoscale materials developed to date [33–35]. The nanoparticles possess exceptional biocompatibility [33], high water-solubility [36], and substantial photostability [37]. They can perform stand-alone therapeutic functions, such as high singlet-oxygen generation [38] and photothermal therapy [10], making them promising candidates for clinical translation [39]. Generally, there are two synthetic methods for producing GQDs: top-down and bottom-up approaches. The top-down method involves the scission of bulk carbonaceous precursors into GQDs with lateral dimensions in the nanometer range [40]. Cutting of the materials is facilitated by various methods, including chemical [41–43], electrochemical [44–46], and solvothermal exfoliation [43, 47]. Although this approach offers high synthetic efficiency, the harsh reaction conditions may promote the formation of structural defects [48]. Further active development of this method features a variety of precursors, including carbon fibers [49], graphite [50], GO [51], CNTs [52], and coal [53]. However, complex processing, long reaction times, and costly instrumentation and precursors continue to limit the scalability of these methods [33]. Moreover, none of these structures was reported to exhibit notable NIR fluorescence. Recently, Hasan et al made pioneering use of reduced GO as a precursor for the top-down synthesis of reduced GQDs (rGQDs), which are emissive in the NIR-I with an excitation-varying quantum yield of 1%–7% [54]. However, there is limited control over surface chemistry and charge of rGQDs as their properties are largely inherited from the reduced GO and the oxidation conditions.
In contrast to the top-down method, the bottom-up approach involves the fabrication of nano-sized GQDs from small molecular precursors via hydrothermal, carbonization, chemical vapor deposition, and electron-beam irradiation synthesis procedures [55]. The approach is more scalable and cost-effective as molecular carbonaceous precursors are abundant. Moreover, bottom-up synthesis forms GQDs with more uniform and reproducible structures and sizes than the top-down method [56]. Among bottom-up synthesis procedures, carbonization is the most straightforward and cost-effective technique in which organic material undergoes irreversible thermal decomposition, leading to aromatization, polymerization, and graphitization and resulting in the formation of GQDs [57]. Most bottom-up-synthesized GQDs exhibit photoluminescence in the visible spectral range and lack intrinsic NIR emission, limiting their applicability in bioimaging [58, 59]. Nevertheless, NIR emission has been reported in a limited number of bottom-up GQD systems, although these reports are often constrained by incomplete biological validation or reliance on specific dopants. Tang et al reported synthesizing NIR-fluorescent nitrogen-doped GQDs via a hydrothermal route with synthesis time-dependent size evolution [60]. However, the absence of cell viability assessments limits their suitability for biomedical applications. Valimukhametova et al produced NIR-emitting biocompatible GQDs and studied the effects of rare-earth metal doping [37]. While these GQDs appear biocompatible at high concentrations, the broader biological effects of rare-earth elements, such as neodymium, ytterbium, and holmium, may extend beyond what is reflected by cell-viability assays alone [61]. Thus, rare-earth metal-doped GQDs warrant further in vivo assessment before their translation to the clinic. Existing bottom-up strategies have yet to establish systematic control over how precursor chemistry governs GQD structure, emissive behavior, and biological response, limiting the rational design of NIR-emissive GQDs optimized for biomedical use and presenting a clear knowledge gap to be addressed.
Many synthetic procedures used to date lack control over the properties of the resulting GQD product, leading to a thermodynamically dictated distribution of nanoscale structures and surface functionalization. The possibility of control may therefore arise from the choice of the precursor, which influences the structural, optical, and chemical properties of GQDs and, consequently, their potential biological applications. For instance, a neutral-to-mildly negative zeta potential (−20–0 mV), dictated by GQD surface functional groups, may minimize immune clearance by reducing protein adsorption and prolonging blood circulation [62]. On the other hand, high zeta potential (> ± 25 mV) ensures higher GQD suspension stability [63, 64]. Functional groups also play direct roles: amine-functionalized GQDs exhibit antimicrobial activity [65], ultrastability [66], and enhanced cell entry, which are beneficial for drug delivery [67]. Hydroxyl and carboxyl groups enhance GQD hydrophilicity, hence suspension stability, promote strong π–π interactions, and increase the available surface area for non-covalent therapeutic attachment, while also elevating their biocompatibility [68, 69]. These characteristics are the consequences of the choice of precursor. Thus, to ensure efficient GQD formation, a criterion for precursor selection is required. GQD precursors are generally carbon-based. To allow for a multitude of applications, one must vary precursors to achieve desired functional groups and charge. For example, one may achieve positively charged GQDs through an amine-bearing precursor such as glucosamine hydrochloride [70]. Similarly, negatively charged GQDs can be obtained from carboxylate-rich precursors, as surface carboxyl functional groups are commonly associated with negative zeta potentials [71]. Moreover, highly fluorescent GQDs have also been synthesized using hyaluronic acid [10], L-glutamic acid [72], and sodium citrate [73].
In the present work, we use common molecular precursors to explore their utility to produce GQD structures with varying properties. This will expand the pool of NIR-fluorescing GQD structures using a single scalable, cost-effective synthetic approach. Using diverse precursors, we demonstrate their applicability for synthesizing NIR-emissive GQDs with tunable surface functional groups, enabling their use in biomedical imaging. We characterize the optical and structural features that enable NIR emission and further explore their NIR bioimaging modality for biocompatible candidates in vitro to validate their translatability as imaging/delivery agents for a variety of disease targets. The development of such a facile synthetic procedure with a variety of precursor materials for GQDs emitting in the NIR-I region can streamline a wide range of biomedical applications, including multidrug delivery and multianalyte detection.
Materials and methods
Materials
2.1.
GQD precursors included ascorbic acid (Lot #21729, Unpretentious), chitosan (CAS #84380-01-8, Power Grown), citric acid (CAS #77-92-9, Sigma Aldrich), dextran (CAS #9004-54-0, Alfa Aesar), glucose (CAS #50-99-7, Innovating Science), glucosamine hydrochloride (Lot #3510840, Millipore Sigma), 5 kDa hyaluronic acid (Part #HA5K-5, Lifecore Biomedical), L-glutamic acid (CAS #56-86-0, Sigma Aldrich), polyethylene glycol (PEG) 1500 Da (CAS #25322-68-3, Spectrum Chemical), sodium cholate (CAS #206986-87-0, Sigma Aldrich), sodium citrate (CAS #6132-04-3, Innovating Science), urea (CAS #57-13-6, Sigma Aldrich).
Microwave-assisted synthesis of GQDs
2.2.
GQDs were synthesized by microwave-assisted bottom-up carbonization of precursor materials in an HB-P90D23AP-ST Hamilton Beach microwave oven. 2.0 g of precursor, either ascorbic acid, chitosan, citric acid (with 6.0 g of urea), dextran, glucose, glucosamine hydrochloride, hyaluronic acid, L-glutamic acid, PEG, sodium cholate, and sodium citrate, were added into a petri dish and heated in the microwave at 1100 W. After the organic material darkened, indicating the formation of GQDs, the material was cooled to room temperature. 50.0 ml of deionized (DI) water was added to disperse the GQDs with magnetic stirring for 20 min. To purify the product from unreacted precursors, GQDs were dialyzed in 1 kDa dialysis bags against DI water for 24 h. The water was changed every 30 min for the first 3 h, and then every 7 h for the next 21 h. After dialysis, the solutions were syringe-filtered using a 0.22 µm hydrophilic filter membrane to remove aggregates and sterilize. The suspensions were further freeze-dried using a Labconco FreeZone 4.5 freeze dryer for storage and characterization.
Structural and optical characterization
2.3.
The morphology, lattice structure, and size distribution of the GQDs were characterized using high-resolution transmission electron microscopy (HRTEM, JEOL JEM-2100) with a 200 kV acceleration voltage and an acceleration current of 112 μA. For TEM sample preparation, GQDs were dispersed in DI water, and 10 μl of a 1 mg ml^−1^ GQD solution was drop-cast onto 300 mesh carbon-coated copper grids. The grids were later dried under ambient conditions before imaging.
Particle sizes were determined using Fiji [74] (up to 80 GQDs per sample). The microscope pixel calibration (100 pixels = 10 µm) was applied to convert pixel measurements into physical dimensions, and the diameter of each GQD was recorded. Particle size distributions were obtained by plotting the measured diameters into histograms. The resulting data was further analyzed to determine the mean particle size and the standard error. The standard deviation was calculated using the conventional statistical formula (equation (1)), and the standard error was subsequently determined via equation (2),
\documentclass[12pt]{minimal} \usepackage{amsmath} \usepackage{wasysym} \usepackage{amsfonts} \usepackage{amssymb} \usepackage{amsbsy} \usepackage{upgreek} \usepackage{mathrsfs} \setlength{\oddsidemargin}{-69pt} \begin{document} \begin{equation*}s = \sqrt {\frac{{{{\mathop \sum \nolimits}}{\text{ }}{{\left( {x - \bar x{\text{ }}} \right)}^2}}}{{n - 1}}} \end{equation*}\end{document} \documentclass[12pt]{minimal} \usepackage{amsmath} \usepackage{wasysym} \usepackage{amsfonts} \usepackage{amssymb} \usepackage{amsbsy} \usepackage{upgreek} \usepackage{mathrsfs} \setlength{\oddsidemargin}{-69pt} \begin{document} \begin{equation*}{\mathrm{SE}} = \frac{s}{{\sqrt n }}.\end{equation*}\end{document}To characterize the functional groups on the GQD surface, the freeze-dried samples were analyzed using the ATR mode of the Thermo Fisher (Nicolet Nexus 670) Fourier-transform infrared spectrometer (FTIR) in the 500–4000 cm^−1^ range. Regions characteristic for most common GQD functional groups were highlighted. The absorbance of all GQDs was measured between 200 and 1000 nm using a Cary 60 UV–Vis spectrometer (Agilent Technologies, Santa Clara, CA, USA) with a 1.5 nm slit.
Visible fluorescence spectra of GQDs were evaluated using a NanoLog (HORIBA Scientific, Piscataway, NJ, USA) spectrofluorometer with an excitation wavelength of 400 nm in an emission range of 475–700 nm. NIR GQD fluorescence spectra were assessed with an AvaSpec-HS-TEC spectrofluorometer (Avantes, Apeldoorn, The Netherlands) with a 0.9 W cm^−2^ 808 nm laser (808MD-12 V-BL, Q-BAIHE, China) excitation and a 50 μm slit. All spectra were collected in a 3.5 ml quartz cuvette with a 1 cm optical path length.
Zeta potential of the GQDs was evaluated using a NanoBrook ZetaPALS (Brookhaven Instruments Corporation, NanoBrook, Holtville, NY, USA) instrument, averaging 10 runs. Zeta potential measurements were conducted for all GQDs at a concentration of 1 mg ml^−1^. The pH of each sample was adjusted to 7.0 ± 0.2 using microliter aliquots of NaOH or HCl prior to measurement, ensuring consistent pH conditions across all samples.
Cell culture
2.4.
Human embryonic kidney (HEK-293) cells were used for in vitro studies. Cells were cultured in Dulbecco’s modified Eagle’s medium (D6046, Sigma-Aldrich) supplemented with 10% fetal bovine serum (16140–063, Gibco), 1% L-glutamine (G7513, Sigma-Aldrich), minimum essential medium nonessential amino acids (M7145, Sigma-Aldrich), and penicillin/streptomycin (P4333, Sigma-Aldrich). Cells were maintained at 37 °C and 5% CO₂ in a CO₂ incubator (Thermo Scientific, Midi 40) for cell viability assays and NIR fluorescence microscopy imaging.
Cell viability assays
2.5.
MTT assay was conducted to analyze the biocompatibility of the various GQDs. HEK-293 cells (CRL-1573, ATCC) were plated into a 96-well plate at a density of 5000 cells per well and incubated at 37.1 °C with 5% CO_2_ for approximately 18 h. Next, the cells were pre-treated with different concentrations of GQDs prepared by serial dilution. After a 24 h incubation period, the culture medium was replaced with MTT reagent prepared in serum-free medium at a concentration of 1 mg ml^−1^, and the cells were incubated for an additional 4 h. The MTT solution was then replaced with 100% dimethyl sulfoxide (DMSO) to dissolve the formazan crystals, and the plates were shaken at room temperature for 5 min on an orbital shaker. Finally, cell viability was assessed by measuring absorbance at 580 nm using a FLUOstar Omega microplate reader to evaluate formazan absorption.
NIR fluorescence microscopy imaging
2.6.
To test in vitro NIR fluorescence microscopy imaging capabilities of the synthesized GQDs, HEK-293 cells were plated onto coverslips in a 6-well plate at a density of 10 000 cells per well. The coverslips were pre-treated with rat tail collagen I (ALX-522-435-0020, Enzo) according to the manufacturer’s instructions to facilitate cell attachment. The following day, GQDs were added to the designated wells at their biocompatible concentrations (figure 5(c)) and incubated for 12 h. The coverslips with cells were rinsed using 1× phosphate-buffered saline to remove any GQDs that had not been internalized. To prepare the slides for NIR fluorescence imaging, the cells were fixed with 4% formaldehyde (Thermo Scientific, 28 908) and mounted with fluoromount-GTM mounting medium (Invitrogen, 00–4958-02). Non-internalized GQDs were removed during the washing step. GQDs internalized into the cells were excited with an 808 nm laser. NIR fluorescence microscopy images were taken using an Olympus IX73 fluorescence microscope in broadband mode with a 900 nm long pass dichroic mirror, a 900 nm long pass filter, and a 60× (IR-corrected Olympus Plan Apo) water immersion objective. NIR InGaAs Photon etc. (ZephIR 1.7) detector was used to obtain NIR images of GQDs within HEK-293 cells (850–1600 nm).
Results and discussion
The bottom-up synthetic approach is used in this work to produce 11 NIR-emissive GQDs from different precursors: ascorbic acid, chitosan, citric acid–urea, dextran, glucose, glucosamine hydrochloride, hyaluronic acid, L-glutamic acid, PEG, sodium cholate, and sodium citrate. The precursors are selected to span a broad range of chemical, optical, and structural properties. The precursors with amino groups, such as glucosamine hydrochloride, L-glutamic acid, and citric acid–urea, generally yield GQDs with positive zeta potentials [70], while carboxylate-rich precursors, such as sodium citrate and sodium cholate, form GQDs with negative zeta potentials due to surface functionalization [71] (table 2). Moreover, the use of widely available precursors from diverse chemical and biological fields highlights the accessibility of this synthetic approach, supporting broader dissemination of GQD research beyond its current scope.
The microwave carbonization-based synthetic method, developed in our laboratory, uses microwave synthesis to yield the most NIR-emissive GQD structures from the precursors, compared to traditional approaches. The synthesized GQDs dispersed in DI water undergo a 2-step purification (24 h of 1 kDa dialysis followed by filtration through 0.22 µm pore-size syringe filters) to remove non-fluorescent precursor materials and any large aggregates that may form during the dry synthesis process. Synthesis times are varied between 10 and 120 min and optimized to produce a high yield of GQDs with each precursor. Yields are calculated as the percentage of recovered GQD mass relative to the initial precursor mass (table 1).
Transmission electron microscopy (TEM) analysis provides a distribution of GQD sizes for each precursor (figure S3), with average dimensions ranging from 2.8 to 14 nm (table 2). HRTEM images reveal the graphitic lattice structures in all GQDs, with interplanar spacings characteristic of graphitic lattice (table 2). The crystallinity of GQDs is further confirmed by fast Fourier transform (FFT) patterns corresponding to each precursor (figure 1, insets). Interplanar distances of the GQDs range from 0.21 to 0.37 nm. Spacings in the range of 0.21–0.27 nm are consistent with the in-plane lattice spacing and likely correspond to the (100) plane of graphene [70, 75]. In contrast, interplanar spacings between 0.31 and 0.37 nm can be attributed to the (002) plane of graphene [75, 76]. The broad range of interlayer spacings may arise from surface functionalization of the GQDs, particularly the presence of oxygen-containing groups between layers, which can induce lattice expansion [77]. Overall, the observed interplanar spacings are fully consistent with previously reported values for GQDs [78–80].
HRTEM images, with insets displaying the interlayer spacings and FFTs of (a) chitosan GQDs, (b) glucosamine hydrochloride GQDs, (c) ascorbic acid GQDs, (d) dextran GQDs, (e) sodium citrate GQDs, (f) sodium cholate GQDs, (g) PEG GQDs, (h) L-glutamic acid GQDs, (i) hyaluronic acid GQDs, (j) glucose GQDs, and (k) citric acid–urea GQDs.
All 11 GQDs possess several common surface functional groups characterized by FTIR (figure S5) spectroscopy in the ATR mode of freeze-dried GQD samples. Most GQDs have a wide and strong O–H band around 3300 cm^−1^ [81], with glucosamine GQDs having a sharper feature and PEG GQDs showing only a weak O–H peak, indicating some difference in functional group amounts across structures. All GQDs show a characteristic C–O stretching band near ∼1060 cm^−1^. Citric acid–urea, hyaluronic acid, and L-glutamic acid GQDs additionally display more pronounced C–H stretching bands (2800–2920 cm^−1^), suggesting incomplete aromatic carbonization resulting in residual aliphatic carbon species. These samples also show distinct C=O stretching features (1560–1710 cm^−1^) indicative of carbonyl-containing groups, which can further improve GQD solubility [68, 69, 82]. Ascorbic acid, citric acid–urea, and PEG-GQDs’ FTIR spectra present a detectable C=O carbonyl acid/ester feature at 1731 cm^−1^, 1702 cm^−1,^ and 1754 cm^−1^, respectively [83], and a C–O band at 1036 cm^−1^, 1190 cm^−1^, and 1099 cm^−1^, respectively. Sodium cholate and sodium citrate GQDs exhibit a band near ∼1400 cm^−1^ indicative of symmetric stretching vibrations of –COO^−^ carboxylate [56], consistent with their highly negative zeta potentials. The GQDs, as aromatic compounds, also show aromatic overtones seen as fringes [84] between 1600–2000 cm^−1^, with glucosamine hydrochloride displaying only an aromatic C–H band at 3092 cm^−1^ and an aromatic C=C at 1536 cm^−1^ [85]. The GQDs synthesized from nitrogen-based precursors possess amine features: glucosamine GQDs display N–H peaks at ∼3095 cm^−1^ and 1614 cm^−1^ [70], L-glutamic acid GQDs show N–H overtone at 3075 cm^−1^ and C–N peak at 1417 cm^−1^, and citric acid–urea GQDs exhibit C–N peaks around 1060 cm^−1^ [86]. Amine groups enhance the biocompatibility and increase cellular uptake of GQDs [87].
The measured zeta potentials of the synthesized GQDs span a wide range (table 2 and figure S6), with sodium citrate (−51.81 ± 0.49 mV) and sodium cholate (−36.49 ± 1.61 mV) GQDs having highly negative values, suggesting high surface stability due to electrostatic repulsion. The FTIR spectra of these GQDs display broad O–H stretching and C=O/C–O bands due to the presence of surface carboxyl groups, which may indeed result in the highly negative zeta potentials. Moderate negative charges are found in ascorbic acid (−27.64 ± 0.47 mV), chitosan (−10.74 ± 0.54 mV), dextran (−7.35 ± 0.36 mV), glucose (−5.22 ± 0.84 mV), PEG (−4.49 ± 0.57 mV), and hyaluronic acid (−3.38 ± 1.22 mV) GQDs, suggesting relatively lower colloidal stability. The FTIR spectra of chitosan, dextran, glucose, PEG, and hyaluronic acid GQDs reveal prominent O–H and C–O bands characteristic of alcohol and ether groups, which are largely neutral at biological pH, resulting in only mildly negative zeta potentials. In contrast, citric acid–urea (2.76 ± 0.47 mV), glucosamine hydrochloride (4.93 ± 0.11 mV), and L-glutamic acid (6.95 ± 0.58 mV) GQDs yield positive zeta potentials. Citric acid–urea, glucosamine hydrochloride, and L-glutamic acid GQDs contain nitrogen-based surface functional groups, as shown in the FTIR spectra through C–N and N–H bands specific to amide and amine groups. These nitrogen groups are protonated at physiological pH, giving the GQDs their positive zeta potentials.
GQD UV/Vis absorption (figure 2) was measured over a concentration range of 0.002–0.47 mg ml^−1^ (table S1). The UV/Vis absorption features support functional group and lattice structure characterization based on FTIR and HRTEM (figures S5 and S5). PEG, glucose, dextran, and chitosan GQDs exhibit absorption peaks at ∼220 nm for π–π* transition similar to that in GO, while sodium cholate GQDs have a shoulder at 264 nm corresponding to their π–π* transition [88–92]. Dextran, hyaluronic acid, sodium citrate, citric acid–urea, glucose, glucosamine, and chitosan GQDs also possess spectral features between 275 and 300 nm arising from the n-π* transition of the C=O bonds [89]. Chitosan and hyaluronic acid GQDs have long absorption tails that go into the visible, enhancing absorbance even up to the NIR region.
Absorbance spectra of (a) PEG GQDs (dark green), L-glutamic acid GQDs (light blue), hyaluronic acid GQDs (orange), glucose GQDs (dark purple), and citric acid–urea GQDs (red) and (b) chitosan GQDs (mint green), glucosamine hydrochloride GQDs (blue), ascorbic acid GQDs (pink), dextran GQDs (violet), sodium citrate GQDs (dark yellow), and sodium cholate GQDs (black).
Visible photoluminescence excitation/emission maps of the synthesized GQDs reveal excitation-dependent emission (figure 3) in the excitation range of 370–460 nm. This points toward the presence of different-sized emissive structures that can be excited in resonance at different wavelengths. Additionally, different surface functional groups introduce distinct electronic states within the graphitic domains, which may affect the photoluminescence behavior of the GQDs. Ascorbic acid, glucosamine hydrochloride, and PEG GQDs exhibit maximum emission at 525–575 nm when excited between 420–460 nm. This supports a significant presence of ester carbonyl and C–O bands in their FTIR spectra, which create stable mid-range emission states [93]. Similarly, chitosan, hyaluronic acid, citric acid–urea, and glucose GQDs exhibit their strongest emission at 510–545 nm. Dextran and sodium cholate GQDs instead exhibit red-shifted emission maxima exceeding 530–630 nm with 445–460 nm excitation. Conversely, sodium citrate and L-glutamic acid GQDs exhibit the strongest response at 370–390 nm excitation, with emission in the 490–526 and 475–480 nm ranges, respectively (figure 3).
Visible excitation/emission maps of (a) chitosan GQDs, (b) glucosamine hydrochloride GQDs, (c) ascorbic acid GQDs, (d) dextran GQDs, (e) sodium citrate GQDs, (f) sodium cholate GQDs, (g) PEG GQDs, (h) L-glutamic acid GQDs, (i) hyaluronic acid GQDs, (j) glucose GQDs, (k) citric acid–urea GQDs.
Visible fluorescence spectra (figures 4(a) and (b)) of the GQDs at the same 0.25 mg ml^−1^ concentration, collected with 400 nm excitation, generally show a broad feature in the 475–700 nm range. Among all GQDs analyzed at the same concentration with 400 nm excitation. All GQDs are expected to exhibit visible fluorescence originating from quantum confinement effects within their graphitic carbon domains on GQD surface or within the GQD itself [37, 94]. Thus, differences in spectral shapes and positions can arise from variations in GQD emissive-region sizes or in actual GQD sizes [95]. Functional group type is expected to contribute to the edge states at those graphitic islands and GQD edges, while functional group concentration and distribution, both influenced by the initial synthetic precursor, may affect the size of the sp^2^ emissive islands on the GQD surface. For instance, decreasing the average size of graphitic regions on the GQD surface is expected to increase electron transition energies, blue-shifting fluorescence peaks. Since the spectral maxima positions (figures 4(a) and (b)) do not directly correlate with mean GQD sizes in the samples (table 2), one can infer that the visible fluorescence in these GQDs arises rather from the aforementioned localized regions of graphitic carbon rather than from the localization within the actual nanoparticle.
Visible fluorescence emission of (a) PEG GQDs (dark green), L-glutamic acid GQDs (light-blue), hyaluronic acid GQDs (orange), glucose GQDs (dark purple), and citric acid–urea GQDs (red) with 400 nm excitation and (b) chitosan GQDs (mint green), glucosamine hydrochloride GQDs (blue), ascorbic acid GQDs (pink), dextran GQDs (violet), sodium citrate GQDs (dark yellow), and sodium cholate GQDs (black). Normalized NIR fluorescence of (c) PEG GQDs (dark green), L-glutamic acid GQDs (light-blue), hyaluronic acid GQDs (orange), glucose GQDs (dark purple), and citric acid–urea GQDs (red) and (d) chitosan GQDs (mint green), glucosamine hydrochloride GQDs (blue), ascorbic acid GQDs (pink), dextran GQDs (violet), sodium citrate GQDs (dark yellow), and sodium cholate GQDs (black) with 808 nm laser excitation.
The NIR fluorescence (figures 4(c) and (d)) was measured over a concentration range of 0.002–0.47 mg ml^−1^ (table S1). NIR emission exhibited with 808 nm excitation is generally excitation-independent and may arise from localized electronic defects introduced through the incorporation of oxygen-containing functional groups within the graphitic framework [35, 96, 97]. This supports their apparent dependence on the GQD precursor materials observed in this work. Variations in the type and concentration of functional groups can influence fluorescence intensity by controlling the number of NIR-emissive regions and altering spectral shape through changes in their electronic environments.
Most GQDs exhibit a bimodal feature, whereas only chitosan GQDs show a single NIR peak, suggesting structural similarity and a common NIR emission mechanism [98]. However, the ratios of peak intensities vary substantially with the GQD precursor materials, suggesting that their NIR-emissive defect centers may reside in different electronic environments, leading to variations in peak shape and position [99, 100]. For PEG, dextran, sodium citrate, ascorbic acid, glucose, and glucosamine-derived structures, their 920 nm peak appears to be quenched in proportion to the 860 nm feature and split into several sub-structures as compared to that in sodium cholate, hyaluronic acid, L-glutamic acid, and citric acid–urea derived GQDs. Although the origins of both NIR peaks are not fully understood, the dependence of GQD NIR spectral structure on their precursors confirms the strong influence of the electronic environments of functional groups on this process [99].
The NIR GQD emission is critical for their biomedical imaging applications, as NIR penetrates tissue to depths of up to 10 cm [101]. Thus, the selection of the synthetic precursor may alter NIR GQD spectral signatures to optimize those for a specific imaging application and/or multiplex imaging. Since the success of these biomedical applications depends on the biocompatibility of GQDs, we examine the dependence of GQD biocompatibility on precursor materials in the present study using the most common MTT assay in HEK-293 cells (figure 5). The International Organization for Standardization defines materials as biocompatible at above 70% cell viability [102]. To offset any assay variability, we use 80% cell viability, which we achieve at concentrations between 0.047–2.20 mg ml^−1^, with the remarkably high upper limit achieved with Glucosamine-derived GQDs (figure 5(c)). Ascorbic acid and sodium cholate GQDs appear to be the least biocompatible, likely due to trace amounts of their precursor materials, which can affect cellular pH or contribute to cell lysis. Nevertheless, the lowest biocompatible concentration of 0.05 mg ml^−1^ still surpasses those reported for a variety of common nanomaterials, including multi-walled CNTs (0.01 mg ml^−1^) [103], silver nanoparticles (0.02 mg ml^−1^) [104], and Cadmium–Tellurium quantum dots (0.000 75 mg ml^−1^) [105]. This remarkable biocompatibility range supports the significant potential of GQD in biomedical applications. The increase in cell viability above 100% observed for citric acid–urea, glucosamine hydrochloride, L-glutamic acid, and sodium cholate GQDs likely results from partial degradation and consumption by the cells [105].
Cell viability of HEK-293 cells treated with (a) chitosan GQDs (mint green), glucosamine hydrochloride GQDs (blue), ascorbic acid GQDs (pink), dextran GQDs (violet), sodium citrate GQDs (dark yellow), and sodium cholate GQDs (black) and (b) PEG GQDs (dark green), L-glutamic acid GQDs (light -blue), hyaluronic acid GQDs (orange), glucose GQDs (dark purple), and citric acid–urea GQDs (red), (c) and their highest biocompatible concentrations evaluated via the MTT assay.
HEK-293 cells are treated with the highest biocompatible (80% cell viability) concentrations of respective GQDs to track and confirm cell internalization via NIR fluorescence imaging in vitro. Internalization is assessed through excitation with an 808 nm laser at a 12 h time point established in our previous work [37]. Extracellular GQDs are removed in the washing step, thereby nearly no emission is detected in the extracellular environment, with all the GQD NIR fluorescence arising from within the cells (figure 6).
Bright-field and NIR fluorescence overlay of (a) ascorbic acid, (b) chitosan, (c) citric acid–urea, (d) sodium citrate, (e) glucose, (f) glucosamine hydrochloride, (g) hyaluronic acid, (h) L-glutamic acid, (i) PEG, (j) sodium cholate, (k) dextran GQD-treated cells and (l) control. Near-infrared GQD fluorescence (shown in red) is excited at 808 nm.
Figure 6 provides a non-normalized, qualitative indication of fluorescence arising from GQDs within cells. Control cells exhibit no detectable fluorescence across all experimental settings, whereas all GQD-treated samples display fluorescence above control levels, suggesting that the observed signal originates from GQDs rather than cellular autofluorescence. The robust intracellular fluorescence emission detected for the 11 GQD structures suggests their high potential as NIR fluorescence biomarkers. Sodium citrate GQDs exhibit more efficient internalization, possibly due to a highly individualized state driven by their zeta potential. L-glutamic acid-derived GQDs also show efficient cellular translocation. It is plausible that the positive charge of the L-glutamic acid GQDs can facilitate their entry via clathrin-independent endocytosis compartments enriched with glycosylphosphatidylinositol-anchored proteins (CLIC/GEEC) [70]. An expected secondary internalization pathway would be fast endophilin-mediated endocytosis (FEME), due to the positively charged GQDs’ attraction to negatively charged functional groups on FEME receptors [70]. No correlation is observed between biocompatibility and cell internalization.
The unique properties of the GQDs synthesized in this work from various precursors show their potential for numerous biomedical applications. For instance, different functional groups on their surface can aid in the attachment of therapeutics or targeting agents [106–108]. Glucosamine and citric acid–urea GQDs, with amine functional groups, can be conjugated to folic acid or peptides for selective targeted uptake in cancer cells, enhanced delivery, and imaging specificity [109]. Positively charged GQDs, such as L-glutamic acid, glucosamine hydrochloride, and citric acid–urea, may allow selective interaction with negatively charged bacterial membranes, positioning them as antibacterial agents with minimal mammalian cell cytotoxicity shown in the present work. Additionally, GQDs bearing oxygen-containing functional groups can be used as pH sensors, with their fluorescence affected by protonation and deprotonation of these groups [35, 110]. The variety of NIR-emissive GQD structures developed in this work offers a broad range of optical, physical, and electronic properties that can facilitate the development of novel biomedical applications using these biocompatible nanomaterials. The precursor control explored here allows for tuning GQD properties to the specific application.
Conclusion
This work is the first to survey an extensive set of eleven molecular precursors using scalable microwave-assisted carbonization to produce GQDs with diverse physical and NIR optical properties, providing a foundation for tailoring these materials for biomedical imaging applications. All quantum dots synthesized using this novel approach consistently exhibit graphitic lattice fringes, as confirmed by HRTEM. Structural and optical characterization reveals a range of GQD average sizes ranging from 2.8 nm (PEG) to 13.5 nm (citric acid–urea), functional groups including hydroxyl, carboxyl, carbonyl, and amine, as well as surface charges resulting in zeta potentials between −50 and +7 mV. These varied properties, achievable only with different synthetic precursors, can contribute to GQD stability, solubility, biocompatibility, and potential for surface functionalization.
All GQDs demonstrate visible and NIR fluorescence with structure and excitation-dependent spectra in the visible and strong precursor-dependent spectral features in the NIR. With the growing use of NIR fluorescence imaging in biomedicine, allowing for several-centimeter depth tissue penetration, GQDs developed in this work can address the need for versatile NIR fluorophores by offering tunable physical characteristics and distinct NIR emission signatures. All GQDs exhibit high biocompatibility, critical for that role, maintaining over 80% cell viability in HEK-293 cells at concentrations ranging from 0.047 to 2.2 mg ml^−1^. Even at the lower end, they are more compatible than many previously reported nanomaterials. Furthermore, all eleven GQDs developed in this study demonstrate efficient cellular internalization and in vitro NIR fluorescence imaging in HEK-293 cells.
Variation in precursor chemistry explored in this work, therefore, yields NIR-emissive GQDs with tunable optical and chemical properties that can be tailored for specific biological functions. Distinct surface functional groups provide opportunities for drug delivery, targeted agent attachment, and real-time treatment monitoring. The spectral diversity of GQDs further allows multimodal imaging and simultaneous tracking of multiple processes within a single system in the NIR with high fluorescence tissue penetration depth. Collectively, these features define NIR-emissive GQDs as adaptable nanomaterials for integrated imaging, therapeutic, and diagnostic platforms.
The reference list from the paper itself. Each links out to its DOI / PubMed record.
- 1Hasan M T Gonzalez‐Rodriguez R Lin C-W Campbell E Vasireddy S Tsedev U Belcher A M Naumov A V 2020 Rare‐earth metal ions doped graphene quantum dots for near‐ir in vitro/in vivo/ex vivo imaging applications Adv. Opt. Mater.8200089710.1002/adom.202000897 · doi ↗
- 2Lee B H Hasan M T Lichthardt D Gonzalez-Rodriguez R Naumov A V 2020 Manganese–nitrogen and gadolinium–nitrogen co-doped graphene quantum dots as bimodal magnetic resonance and fluorescence imaging nanoprobes Nanotechnology 3209510310.1088/1361-6528/abc 64233126228 · doi ↗ · pubmed ↗
- 3Shi X Xu D Cheng H Chu C Liu G 2023 Recent advances in interventional fluorescence imaging: toward the precise visualization of transarterial mini-invasive delivery systems Acc. Mater. Res.425163251–6310.1021/accountsmr.2c 00195 · doi ↗
- 4Zhao J Zhong D Zhou S 2018 NIR-I-to-NIR-II fluorescent nanomaterials for biomedical imaging and cancer therapy J. Mater. Chem. B 634965349–6510.1039/C 7TB 02573 D 32254515 · doi ↗ · pubmed ↗
- 5Chen G et al 2021 Whole-body fluorescence imaging in the near-infrared window Optical Imaging in Human Disease and Biological Research Springer 8310883–108
- 6Egloff-Juras C Bezdetnaya L Dolivet G Lassalle H-P 2019 NIR fluorescence-guided tumor surgery: new strategies for the use of indocyanine green Int. J. Nanomed.147823387823–3810.2147/IJN.S 207486 PMC 676814931576126 · doi ↗ · pubmed ↗
- 7Henary M Mojzych M 2008 Stability and Reactivity of Polymethine Dyes in Solution, in Heterocyclic Polymethine Dyes: Synthesis, Properties and Applications Springer 22138221–38
- 8Hernandez R Heskamp S Rijpkema M Bos D L Goldenberg D M Mc Bride W J Morgenstern A Bruchertseifer F Cai W Boerman O C 2017 Preventing radiobleaching of cyanine fluorophores enhances stability of nuclear/NIRF multimodality imaging agents Theranostics 7110.7150/thno.1512428042311 PMC 5196880 · doi ↗ · pubmed ↗