Metagenomic analysis of goat feces from Ogliastra (Sardinia, Italy)
Monica Rosaria Molotzu, Piera Angela Cabras, Lisa Di Marcantonio, Rossano Atzeni, Nicolò Pietro Paolo Macciotta, Antonella Canu

TL;DR
This study examines how farming practices and health status affect the gut microbiota of goats in Sardinia.
Contribution
The study identifies Prevotellaceae as a potential indicator of Caprine arthritis encephalitis in goats.
Findings
Intensive farming is associated with higher abundance of Acidoaminococcaceae in goat gut microbiota.
Prevotellaceae abundance is significantly higher in CAE-affected goats.
Farming system and geographical location influence gut microbiota composition in goats.
Abstract
With its constitutive and functional characteristics, the intestinal microbiota plays a crucial role in the health condition of the animals. Variations in the composition and gene expression of the intestinal microbiota are associated with the risk of the onset of various pathologies of the gastrointestinal tract and chronic inflammatory intestinal diseases. The objectives of this study were to evaluate the variability in the composition of the intestinal microbiota of goats of different breeds (Sarda, Maltese, and Alpine) farmed in different flocks of the region of Ogliastra (Sardegna, Italy) and to assess whether the type of feeding (natural pasture grazing-based versus intensive) could affect the intestinal bacterial composition. We also evaluated possible differences in the composition of the intestinal microbiota between healthy and Caprine arthritis encephalitis (CAE)-affected…
Genes, proteins, chemicals, diseases, species, mutations and cell lines named across the full text — each resolved to its canonical identifier and authoritative record.
Click any figure to enlarge with its caption.
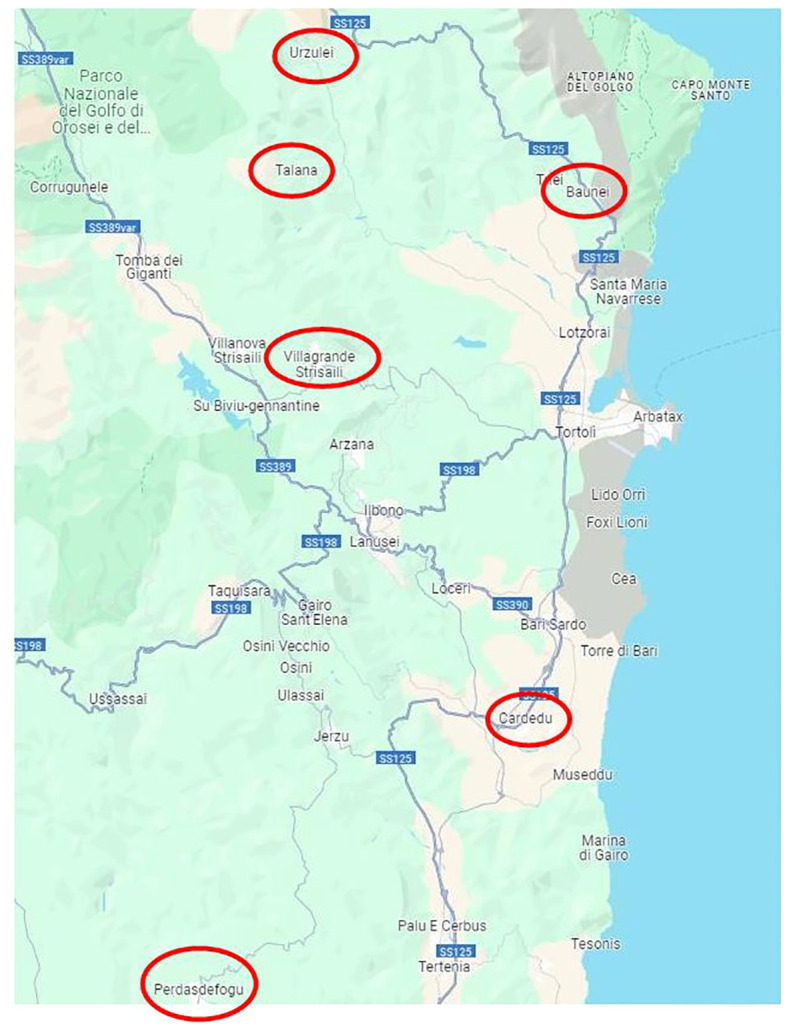 Figure 1
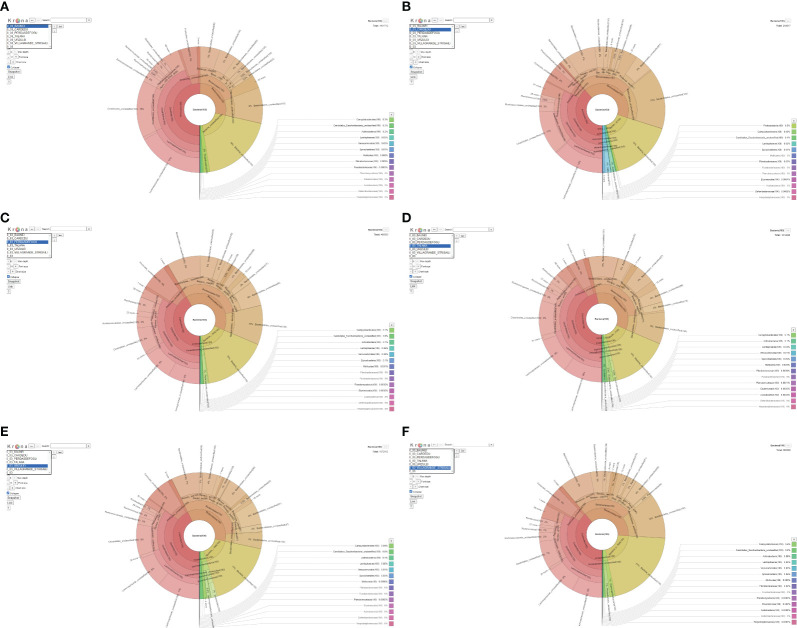 Figure 2
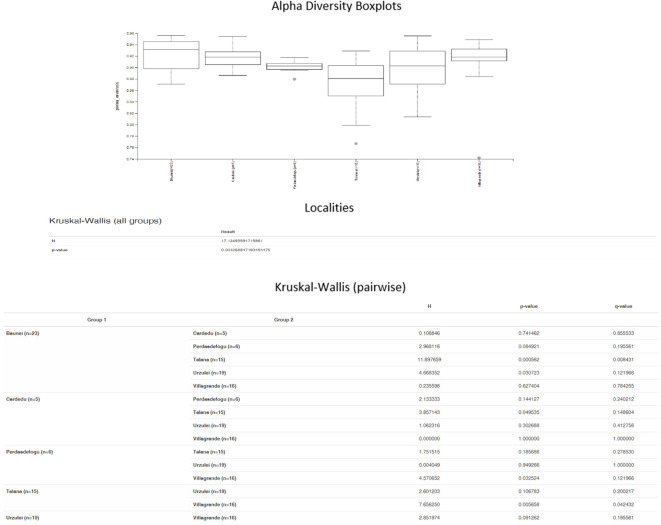 Figure 3
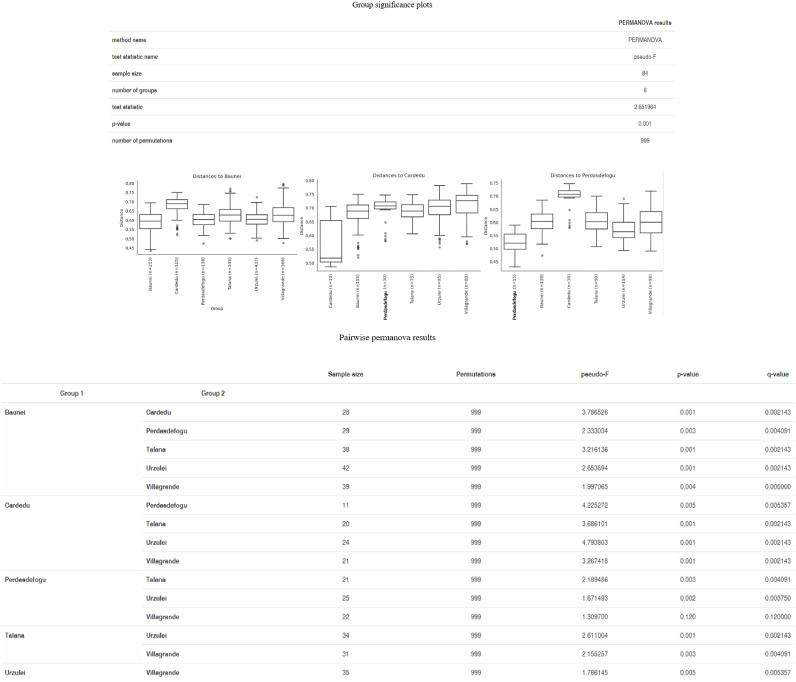 Figure 4
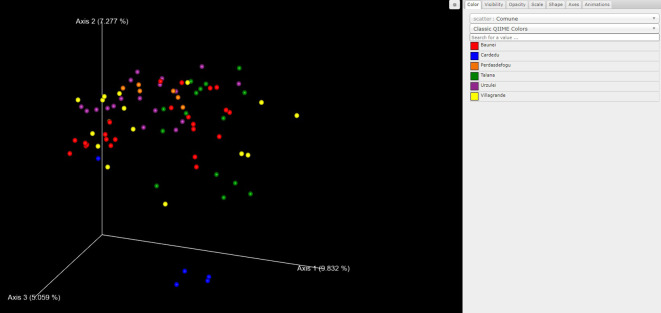 Figure 5
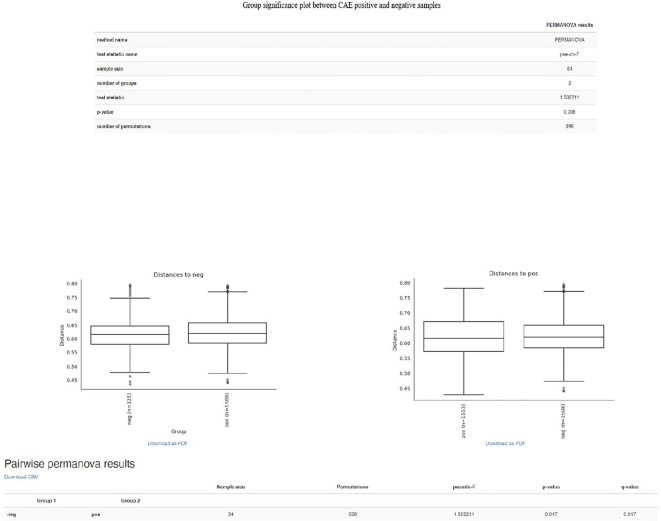 Figure 6
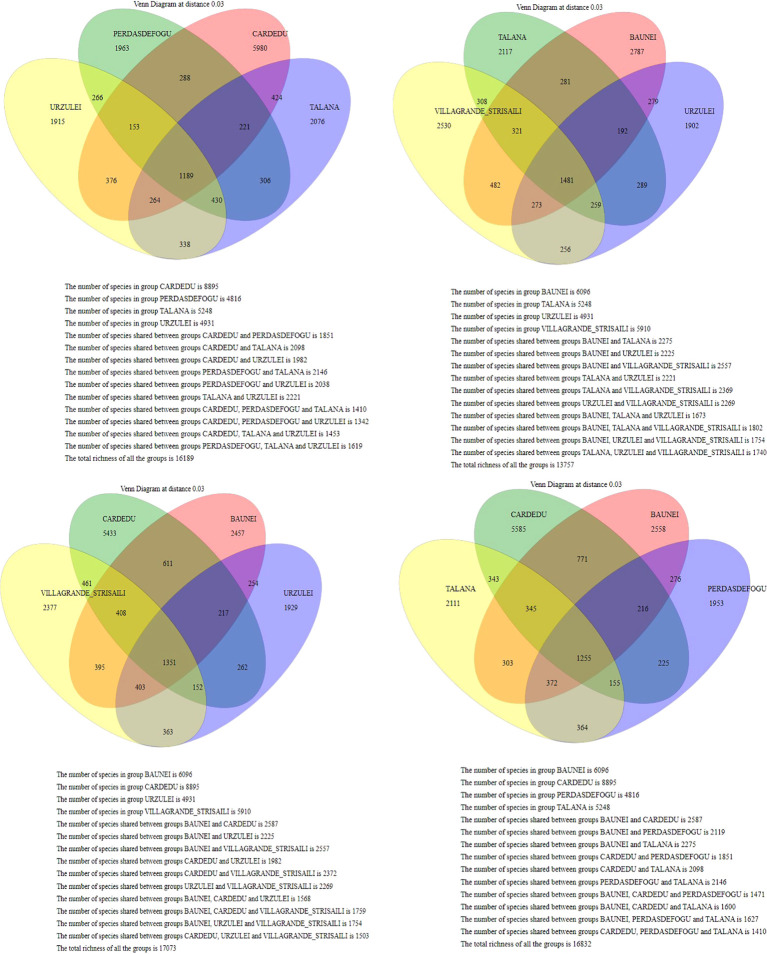 Figure 7
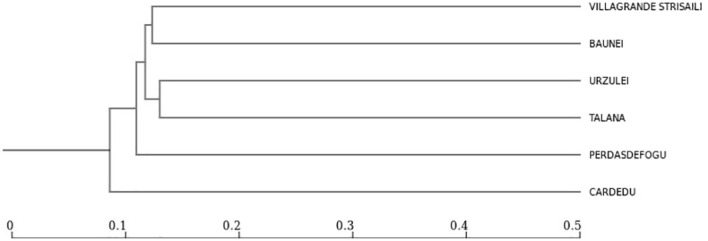 Figure 8
| Sampling data | ||||||
|---|---|---|---|---|---|---|
| Sample | Sampling date | Locality | Sex | Age | Kind | CAE |
| 1 | 29/03/2021 | Baunei | Female | 6 | Sardinian | Negative |
| 2 | 29/03/2021 | Baunei | Female | 3 | Sardinian | Negative |
| 3 | 29/03/2021 | Baunei | Female | 7 | Sardinian | Negative |
| 4 | 29/03/2021 | Baunei | Female | 3 | Sardinian | Negative |
| 6 | 29/03/2021 | Baunei | Female | 7 | Sardinian | Positive |
| 7 | 29/03/2021 | Baunei | Male | 3 | Sardinian | Positive |
| 8 | 18/03/2021 | Baunei | Female | 6 | Sardinian | Negative |
| 9 | 18/03/2021 | Baunei | Female | 5 | Sardinian | Negative |
| 10 | 18/03/2021 | Baunei | Female | 2 | Sardinian | Positive |
| 11 | 18/03/2021 | Baunei | Female | 4 | Sardinian | Negative |
| 12 | 18/03/2021 | Baunei | Female | 5 | Sardinian | Positive |
| 13 | 05/03/2021 | Baunei | Female | 5 | Sardinian | Negative |
| 14 | 05/03/2021 | Baunei | Female | 3 | Sardinian | Negative |
| 15 | 05/03/2021 | Baunei | Female | 6 | Sardinian | Negative |
| 16 | 05/03/2021 | Baunei | Female | 4 | Sardinian | Negative |
| 17 | 05/03/2021 | Baunei | Female | 3 | Sardinian | Negative |
| 19 | 05/03/2021 | Baunei | Female | 13 | Sardinian | Positive |
| 20 | 05/03/2021 | Baunei | Female | 12 | Sardinian | Positive |
| 21 | 05/03/2021 | Baunei | Female | 8 | Sardinian | Positive |
| 22 | 05/03/2021 | Baunei | Female | 3 | Sardinian | Positive |
| 24 | 16/03/2021 | Talana | Female | 3 | Sardinian | Positive |
| 25 | 16/03/2021 | Talana | Female | 4 | Sardinian | Positive |
| 26 | 16/03/2021 | Talana | Female | 3 | Sardinian | Positive |
| 27 | 16/03/2021 | Talana | Female | 6 | Sardinian | Positive |
| 28 | 16/03/2021 | Talana | Female | 5 | Sardinian | Positive |
| 29 | 16/03/2021 | Talana | Female | 6 | Sardinian | Positive |
| 30 | 16/03/2021 | Talana | Female | 6 | Sardinian | Positive |
| 31 | 16/03/2021 | Talana | Female | 5 | Sardinian | Positive |
| 32 | 16/03/2021 | Talana | Female | 6 | Sardinian | Positive |
| 33 | 16/03/2021 | Talana | Female | 5 | Sardinian | Negative |
| 34 | 25/03/2021 | Urzulei | Female | 6 | Sardinian | Positive |
| 35 | 25/03/2021 | Urzulei | Female | 3 | Sardinian | Positive |
| 36 | 25/03/2021 | Urzulei | Female | 3 | Sardinian | Positive |
| 37 | 25/03/2021 | Urzulei | Female | 4 | Sardinian | Positive |
| 38 | 25/03/2021 | Urzulei | Female | 3 | Sardinian | Positive |
| 39 | 25/03/2021 | Urzulei | Female | 1 | Sardinian | Positive |
| 40 | 25/03/2021 | Urzulei | Female | 5 | Sardinian | Positive |
| 41 | 25/03/2021 | Urzulei | Female | 3 | Sardinian | Positive |
| 42 | 25/03/2021 | Urzulei | Female | 6 | Sardinian | Positive |
| 43 | 31/03/2021 | Urzulei | Female | 2 | Sardinian | Positive |
| 44 | 31/03/2021 | Urzulei | Female | 8 | Sardinian | Positive |
| 45 | 31/03/2021 | Urzulei | Female | 4 | Sardinian | Positive |
| 46 | 31/03/2021 | Urzulei | Female | 2 | Sardinian | Positive |
| 47 | 31/03/2021 | Urzulei | Female | 5 | Sardinian | Negative |
| 48 | 07/04/2021 | Urzulei | Female | 3 | Sardinian | Positive |
| 49 | 07/04/2021 | Urzulei | Female | 5 | Sardinian | Positive |
| 50 | 07/04/2021 | Urzulei | Female | 7 | Sardinian | Positive |
| 51 | 07/04/2021 | Urzulei | Female | 3 | Sardinian | Positive |
| 52 | 07/04/2021 | Urzulei | Female | 3 | Sardinian | Negative |
| 53 | 07/04/2021 | Urzulei | Female | 5 | Sardinian-Samen | Positive |
| 54 | 01/03/2021 | Villagrande | Female | 7 | Sardinian | Positive |
| 55 | 01/03/2021 | Villagrande | Female | 6 | Sardinian | Negative |
| 56 | 01/03/2021 | Villagrande | Female | 4 | Sardinian | Positive |
| 57 | 01/03/2021 | Villagrande | Female | 6 | Sardinian | Positive |
| 58 | 01/03/2021 | Villagrande | Female | 3 | Sardinian | Negative |
| 59 | 01/03/2021 | Villagrande | Female | 16 | Sardinian | Positive |
| 60 | 12/03/2021 | Villagrande | Female | 4 | Sardinian | Negative |
| 61 | 12/03/2021 | Villagrande | Female | 5 | Sardinian | Positive |
| 62 | 12/03/2021 | Villagrande | Female | 7 | Sardinian | Positive |
| 63 | 12/03/2021 | Villagrande | Female | 3 | Sardinian | Positive |
| 3 | 12/03/2021 | Villagrande | Female | 5 | Sardinian | Positive |
| 66 | 12/03/2021 | Villagrande | Female | N.D | Sardinian | Positive |
| 67 | 12/03/2021 | Villagrande | Female | N.D | Sardinian | Positive |
| 68 | 12/03/2021 | Villagrande | Female | N.D | Sardinian | Positive |
| 69 | 12/03/2021 | Villagrande | Female | 2 | Sardinian | Positive |
| 70 | 12/03/2021 | Villagrande | Female | 4 | Sardinian | Positive |
| 71 | 24/03/2021 | Cardedu | Female | 4 | Alpine | Positive |
| 72 | 24/03/2021 | Cardedu | Female | 5 | Maltese-Suede | Positive |
| 73 | 24/03/2021 | Cardedu | Female | 6 | Maltese | Positive |
| 74 | 24/03/2021 | Cardedu | Female | 2 | Saanen-Suede | Positive |
| 75 | 24/03/2021 | Cardedu | Female | 3 | Maltese-Saanen | Positive |
| 76 | 09/04/2021 | Talana | Female | 5 | Sardinian | Positive |
| 77 | 09/04/2021 | Talana | Female | 1 | Sardinian | Negative |
| 78 | 09/04/2021 | Talana | Female | 2 | Sardinian | Positive |
| 79 | 09/04/2021 | Talana | Female | 7 | Sardinian | Positive |
| 80 | 09/04/2021 | Talana | Female | 2 | Sardinian | Negative |
| 81 | 14/04/2021 | Perdasdefogu | Female | 4 | Sardinian | Positive |
| 82 | 14/04/2021 | Perdasdefogu | Female | 5 | Sardinian | Positive |
| 83 | 14/04/2021 | Perdasdefogu | Female | 3 | Sardinian | Positive |
| 84 | 14/04/2021 | Perdasdefogu | Female | 5 | Sardinian | Positive |
| 85 | 14/04/2021 | Perdasdefogu | Female | 4 | Sardinian | Negative |
| 86 | 14/04/2021 | Perdasdefogu | Female | 5 | Sardinian | Positive |
| 98 | 05/11/2019 | Arzana | Female | 3 | Sardinian | Positive |
| 99 | 24/06/2021 | Baunei | Female | 8 | Sardinian cross | Negative |
| 100 | 24/06/2021 | Baunei | Female | 3 | Sardinian | Negative |
| 101 | 24/06/2021 | Baunei | Female | 4 | Sardinian | Negative |
| 102 | 24/06/2021 | Baunei | Female | 8 | Sardinian | Negative |
| 103 | 24/06/2021 | Baunei | Female | 5 | Sardinian | Negative |
| Phylum percentages obtained from the Krona graph | ||||||
|---|---|---|---|---|---|---|
| Baunei | Cardedu | Perdasdefogu | Talana | Urzulei | Villagrande Strisaili | |
| Firmicutes | 50 | 36 | 42 | 47 | 43 | 39 |
| Bacteroidetes | 28 | 41 | 40 | 35 | 36 | 37 |
| Proteobacteria | 2 | 0.50 | 1 | 3 | 4 | 3 |
| Actinobacteria | 0.20 | 1 | 0.1 | 0.1 | 0.1 | 0.09 |
| Verrucomicrobia | 0.03 | 2 | 0.02 | 0.1 | 0.01 | 0.02 |
| Percentage of bacterial families divided by locality | ||||||||||||||||
|---|---|---|---|---|---|---|---|---|---|---|---|---|---|---|---|---|
|
|
|
|
|
|
|
|
|
|
|
|
|
|
|
|
| |
| Baunei | 41.05 | 27.47 | 30.70 | 42.26 | 31.31 | 33.13 | 33.95 | 27.98 | 27.39 | 23.84 | 27.57 | 32.78 | 31.92 | 29.87 | 39.26 | 29.28 |
| Cardedu | 31.19 | 25.27 | 19.01 | 19.31 | 112.07 | 5.44 | 25.63 | 60.69 | 32.78 | 60.00 | 33.14 | 23.28 | 20.04 | 23.83 | 22.86 | 35.26 |
| Perdasdefogu | 18.38 | 78.18 | 27.12 | 8.64 | 28.99 | 80.00 | 27.04 | 28.27 | 49.92 | 51.30 | 43.91 | 31.44 | 37.51 | 53.00 | 12.16 | 65.90 |
| Talana | 23.63 | 61.65 | 34.06 | 15.69 | 39.28 | 70.66 | 37.43 | 14.62 | 24.99 | 39.21 | 48.41 | 36.27 | 42.37 | 21.65 | 18.11 | 60.60 |
| Urzulei | 12.47 | 78.44 | 23.28 | 8.55 | 38.37 | 22.00 | 24.22 | 21.19 | 29.01 | 27.92 | 30.42 | 27.99 | 33.22 | 19.88 | 12.00 | 57.50 |
| Villagrande | 17.90 | 45.06 | 38.60 | 15.47 | 37.38 | 33.74 | 32.11 | 44.03 | 45.22 | 52.31 | 44.86 | 34.43 | 36.15 | 40.26 | 21.48 | 41.45 |
| Total | 426993.17 | 912717.22 | 193546.29 | 654987.33 | 188681.25 | 345908.74 | 3131878.20 | 396834.62 | 1243367.90 | 838260.23 | 1770284.92 | 2622805.10 | 1959362.02 | 436662.14 | 94912.87 | 4018615.04 |
| Percentage of bacterial genus divided by locality | ||||
|---|---|---|---|---|
|
|
|
|
| |
| Baunei | 20.82 | 14.14 | 15.95 | 13.61 |
| Cardedu | 18.61 | 11.13 | 9.38 | 9.97 |
| Perdasdefogu | 31.55 | 16.07 | 10.80 | 12.97 |
| Talana | 43.55 | 13.95 | 21.95 | 20.58 |
| Urzulei | 28.83 | 11.12 | 12.80 | 11.71 |
| Villagrande | 35.82 | 19.45 | 13.17 | 17.56 |
| Percentage of bacterial species divided by locality | ||||||
|---|---|---|---|---|---|---|
|
|
|
|
|
|
| |
| Baunei | 9.65 | 13.94 | 18.64 | 18.01 | 13.74 | 15.65 |
| Cardedu | 9.37 | 7.08 | 14.59 | 19.02 | 3.26 | 8.69 |
| Perdasdefogu | 36.93 | 17.83 | 13.75 | 20.61 | 26.63 | 11.03 |
| Talana | 23.15 | 29.57 | 26.07 | 14.55 | 25.59 | 20.74 |
| Urzulei | 9.58 | 13.06 | 15.45 | 13.02 | 16.57 | 26.92 |
| Villagrande | 11.33 | 18.51 | 11.50 | 14.80 | 14.22 | 16.96 |
Peer Reviews
No public reviews on file for this paper yet. If you reviewed it on a platform where reviews are public (OpenReview, ICLR, NeurIPS, ICML), you can paste yours below so the community can read it here.
Videos
No videos yet. Explain this paper in a talk, walkthrough, or lecture? Add one.
Taxonomy
TopicsGenomics and Phylogenetic Studies · Microbial Community Ecology and Physiology · Animal Diversity and Health Studies
Introduction
1
The microbiome describes a dynamic community of microorganisms that colonize organisms from birth onward. The microbiome can vary according to different factors such as host species, age, diet, health, reproductive status, and the external environment. Moreover, it is directly linked to the host’s health status, including metabolism, immunity, and development (Feng et al., 2018). The fecal microbiome is modified in response to transient changes in the host, but the abundance of some major groups of microorganisms is relatively stable throughout the life of the host. Thus, relative proportions of these groups may act as a signature of health and wellbeing, which is known as the host environment (Muegge et al., 2012). In particular, the relative ratio between the two dominant phyla in mammalian fecal microbiomes, Firmicutes and Bacteroidetes, can be used to distinguish between carnivorous and herbivorous mammals, as each group is responsible for different metabolic demands (Kreisinger et al., 2018).
Monitoring the composition of the fecal microbiome throughout the life of animals can help assess their health status (Bahrndorff et al., 2016). For example, many domestic mammal species suffer from poor health, at least partially related to dysbiosis of the fecal microbiome and to a reduced microbial diversity (McKenzie et al., 2017).
Research on this topic has evolved rapidly thanks to new technologies using next-generation sequencing platforms, which have allowed the study of communities of microorganisms (metagenomics) (Satam et al., 2023). The gastrointestinal tract is a complex system that includes a fecal content characterized by more than 10^12^ bacteria per gram of feces, which is named the “microbiota” (Randeni et al., 2024). The genome of the intestinal microbiota is at least 100 times greater than that of the entire individual, and it is defined as the “microbiome.” The term metagenomics refers to the application of modern gene sequencing techniques to the study of microbial communities directly in their natural environment, thus bypassing the need to isolate and cultivate them in the laboratory (Chaudhari et al., 2023; Nam et al., 2023). These techniques have allowed the reconstruction of a large number of metagenome-associated genomes (MAGs) in different animal organisms, including goats, cattle, pigs, sheep, rodents, and poultry, and the detection of associations with host health and some illnesses (Consiglio Superiore di Sanità – Sezione III, 2018).
The 16S ribosomal RNA is a sequence that is shared universally by all prokaryotes, and it has extremely conserved regions interspersed with highly variable regions V1–V9 characterized by variable length and degree of diversity (Bertolo et al., 2024; Hrovat et al., 2024). These can be amplified and sequenced thanks to the use of degenerate primers designed on their flanking regions. The sequencing of hypervariable regions of bacterial 16S rRNA allows for the so-called metataxonomy or phylotyping of the microbial community itself, with the identification and assignment of the relative distributions of the so-called “taxonomic operational units” (OTUs) at different phylogenetic levels and the estimation of their relative abundances (Willis et al., 2019).
Ruminants are herbivorous hoofed mammals with specialized anatomical and physiological adaptations that make them able to perform cellulolytic fermentation of plant materials with a high content of fiber fractions. The study of the fecal microbiome of ruminant species could provide useful tools for developing strategies aimed at improving the animal health status, enhancing the ability to adapt to environmental changes, and preventing disease and parasite epidemics (McKenzie et al., 2017). Caprine arthritis encephalitis (CAE) is an infectious disease first reported in 1974 caused by a virus from the retrovirus family (Crawford et al., 1980; Narayan et al., 1980). The economic consequences of CAE are manifold. Apart from the reduction of milk production, infected animals are more susceptible to several diseases. Such a higher vulnerability not only enhances the risk of secondary infections but also increases the need for veterinary interventions, leading to an increase in operational costs for farmers. Moreover, this affliction contributes to the reduction of the longevity of infected animals, diminishing their overall productive life and, therefore, further enhancing the negative economic impact. Addressing the multifaceted challenges posed by CAE-related viral encephalitis arthritis requires a comprehensive approach that considers both the immediate losses in milk production and the long-term consequences for the health and productivity of livestock (Peterhans et al., 2004; Le Jan et al., 2005).
The study focused on the metagenomic analysis of goat feces, mainly of the Sarda breed, from six locations considered representative of the Ogliastra region, an area of Sardinia where the breeding of the Sarda goat is widespread: Baunei, Cardedu, Perdasdefogu, Talana, Urzulei, and Villagrande.
The study was carried out in the municipalities of Ogliastra (central-eastern Sardinia), included in a blue zone (demographic and/or geographical areas of the world, identified by the scholar Prof. Gianni Pes in which a higher concentration of centenarians is recorded) (Pes and Pouland, 2014). Currently, purebred Sardinian goats are farmed mostly in marginal areas, and crossbreeding with selected breeds (e.g., Murciano-Granadina and Alpine) is a common practice for improving milk yield and slaughter weight of kids. This breed, present on the island since the Neolithic, is characterized by a relevant genetic heterogeneity due to selection performed by shepherds and crosses with other breeds. In particular, three subpopulations differing in size (large, medium, and small), somatic features, and production levels can be distinguished (Macciotta et al., 2002). The Sarda breed goat is well adapted to the harsh environment of some areas of Sardinia where, despite the very difficult farming conditions (Usai et al., 2004), it produces milk and meat of excellent quality.
The aim of the study was to evaluate the differences between the microbial communities present and how the intestinal bacterial composition could be differentiated according to geographical location, type of feeding management (pasture-based or intensive), and CAE status (positive or negative).
Materials and methods
2
Sampling
2.1
The study area was the Ogliastra, in central-eastern Sardinia (Italy), with an extension of 1,855 km^2^ and a population of approximately 58,000 inhabitants, distributed in 23 localities of particular naturalistic interest.
Sampling was carried out between 07 August 2019 and 24 June 2021 on 19 goat flocks distributed in six different localities, representative of the goat farming system of the considered area. (Details on the animals analyzed for each farm and the sampling areas are described in Table 1 and Figure 1).
Sampling map.
In most of the farms, the animals were fed natural pastures, with concentrate supplementation during the manual milking or when animals were kept in the barn. An exception was the farm located in Cardedu, characterized by intensive management, with mechanical milking and the use of antibiotics and pesticides. Natural pastures were characterized by a high presence of Mediterranean scrub. Most represented plant species were Erica, Arbutus unedo, Pistacia lentiscus, Myrtus communis, Allium subhirsutum, Ferula communis, Phillies angustifolia, Genista Corsica, Calycotome villosa, Olea europea, Pyrus amygdaliformis, Quercus ilex, Quercus suber, Rosmarinus officinalis, and Thymus capitatus. Cistus species are chemically characterized by a high content of cellulose and xylan (Duarte et al., 2013).
Individual blood samples were collected using two vacutainer tubes. Stool samples were taken from the rectal ampoule of each animal. The samples were transported to the lab at a controlled temperature of 4°C.
CAE detection
2.2
The detection of the CAE virus was performed in serum samples using indirect ELISA with specific anti-small ruminant lentivirus (SRLV) antibodies. SRLVs are a group of genetically and antigenically heterogeneous RNA viruses belonging to the Retroviridae family and the Lentivirus genus. The viruses responsible for ovine Maedi-visna (MVV) and CAE, respectively, are grouped under the denomination of SRLVs (WOAH, 2021).
Processing, extraction, and library preparation for metagenomics
2.3
Metagenomic analysis was performed on the feces of 87 dairy goats (Supplementary Material 1) frozen at −80°C after collection. After thawing, 300 mg of feces was weighed, and 800 µL of NucliSENS Lysis Buffer from bioMérieux (Florence, Italy) (Bartels et al., 2003; Loens et al., 2003; Van Deursen et al., 2003) was added. The tubes were incubated at 90°C for 10 min with shaking at 1,400 rpm. Samples were centrifuged at 12,000 rpm for 4 min, and 500 µL of supernatant was then taken and subjected to nucleic acid extraction following the instructions provided by the manufacturing company bioMerièux. The DNA concentration of the samples was measured by a “Qubit^®^ 3.0 Fluorometer” using the “High sensitivity assay kit Qubit^®^ dsDNA” kit (Invitrogen, Carlsbad, CA, USA) (Qubit™ 4 Fluorometer Catalog Number Q33226 Publication Number MAN0017209 Revision D.0, Invitrogen). We performed several experiments starting from 100 mg of feces and 500 µL of lysis buffer up to 300 mg of feces, 800 µL of lysis buffer, and 100 µL of silica. This preparation allowed us to reach 3 ng/µL, necessary for metagenomic sequencing as required by the library preparation manual.
A concentration of 3 ng/µL genomic DNA (gDNA) was used for the amplification of the specific DNA region of the extracted samples, using the ranges V 2-4-8 and V 3-6-7 as primer sets −9 of the hypervariable region of the ribosomal 16S. The preparation of the libraries was carried out using the instructions of the manufacturer Thermo Fisher Scientific (Waltham, Massachusetts, USA) and the following kits: Ion 16S Metagenomics Kit, Ion Plus Fragment Library Kit, Agencourt™ AMPure, 70% ethanol, and a high-sensitivity assay kit (Qubit^®^ dsDNA) (Ion 16S™ Metagenomics Kit Catalog Number A26216 Publication Number MAN0010799 Revision C.0, Thermofisher).
Metagenomic sequencing
2.4
Six chips of Ion Chip 318 v2 prepared with the Ion Chef™ Instrument were used. Sequencing was performed with the Ion Personal Genome Machine (PGM) (Ion Chef™ Instrument user guide Maintenance, calibration, and troubleshooting Catalog Number 4484177 Publication number MAN0018668 Revision A.0, Thermofisher; Ion Personal Genome Machine™ (PGM™) System reference guide Catalog Number 4462921, Publication number MAN0009783 Revision A.0, Thermofisher).
Bioinformatic and statistical analysis
2.5
The data analysis was performed using different platforms as described below.
Ion Reporter v. 5.20.2.0 was used in the data analysis. The QIIME2 software suite v2021.4.0 was used to analyze the amplicon data of the 16S rRNA gene. A “manifest file” was created using the “Fastq manifest” command to import the raw FASTQ data. The DADA2 pipeline was used to denoise the sequences and remove chimeric sequences. The Silva database (arb-silva.de) was used to BLAST search the obtained sequences and determine the phylogeny of the OTUs. The naive Bayes classifier trained on the SILVA 99% consensus taxonomy was employed to assign taxonomy into OTUs, which can be accessed at https://data.qiime2.org/2021.4/common/silva-138-99-nb-classifier.qza. To evaluate the completeness of the microbial communities, we conducted a rarefaction analysis using Faith’s PD, Shannon, and observed OTU indices. The alpha diversity indices (observed OTU and Chao1) were computed, and the beta diversity metrics with unweighted UniFrac distances were calculated (Pielou, 1966).
We utilized the Emperor tool to generate Emperor plots for unweighted UniFrac distance and explored the principal coordinate (PCoA) plots in the context of the sample metadata (Vázquez-Baeza et al., 2013).
To calculate the group significance between the alpha and beta diversity indices, we used the Kruskal–Wallis (pairwise) test for the beta-group significance command. Furthermore, the beta-group significance command in the diversity plugin was utilized to test the distances between samples within a group. Finally, the statistical analysis was conducted using PERMANOVA with 999 permutations (Anderson, 2001).
In our study, we employed Mothur version 1.39.5, which was integrated into the Galaxy version 22.05 platform (Schloss et al., 2009; Schloss, 2020; The Galaxy Community, 2022). Following Mothur’s recommended guidelines, we adopted the “Chappid” pipeline (Chappidi et al., 2019) to structure our metagenomic analysis with established best practices.
First, we organized FASTQ files by geographic origin in a Galaxy workspace. Quality control involved FastQC (version 0.11.9) (https://www.bioinformatics.babraham.ac.uk/projects/fastqc/), followed by TrimGalore (version 0.6.7) (https://github.com/FelixKrueger/TrimGalore.com/fenderglass/Flye) for removing low-quality reads and adapters (using default parameters with a quality threshold of 20; QPhred).
For multisample analysis, we created a group file in FASTA format using Mothur’s Make.group. Removal of duplicate sequences was done with Mothur’s unique.seqs. Abundance tables for taxonomic classification and OTUs were generated using count.seqs (Schloss, 2013).
The data quality was assessed using summary.seqs, revealing sequences predominantly within the 125 to 290 base range. Subsequent data cleaning steps included screen.seqs for the systematic removal of low-quality reads and sequences.
After aligning with the Silva database (Quast et al., 2012), we observed most sequences between positions 6,212 and 13,871. To ensure complete overlap, we employed screen.seqs, filter.seqs, unique.seqs, and pre.cluster.
Chimera identification was performed with chimera.vsearch, and removal utilized remove.seqs. Taxonomic assignments via classify.seqs utilized the RDP reference taxonomy (Cole et al., 2013). Lineages were removed using remove.lineage for specific groups.
Cluster.split at the order level, Make.shared, and classify.otu provided OTU information (Wooley et al., 2010).
Krona was visualized by converting the Mothur taxonomy to Krona format and using the Krona pie charts and plots per sample (Ondov et al., 2011).
Normalization involved counting sequences per sample and subsampling using subsamples. Alpha diversity estimation was performed using rarefaction curves generated by Rarefaction.single and visualized with Galaxy’s plotting tool. A comprehensive summary report was produced by Summary.single, including metrics such as observed richness, coverage, the inverse Simpson index, and the total number of sequences.
For beta diversity, the thetaYC and Jaccard indices were calculated using Dist.shared, with visualization through Heatmap.sim. Venn diagrams and dendrograms were generated using the Venn and Tree.shared tools (Cuccuru et al., 2014) (Supplementary Material 1).
Results
3
Six runs were carried out with Ion PGM, which generated 20,590,826 reads with an average of 225,670 reads per sample.
We used the V2-4-8 and V3-6-7 regions because they were included in the sequencing kit. Initially, we analyzed the V4 region alone, which is widely used in the literature, but found the data to be less informative compared to the combined analysis of all regions. The quality of the sequences, assessed using the summary.seqs command, confirmed that most reads fell within the range of 125–290 bases. This multiregion approach enhanced taxonomic resolution and community representativeness, justifying its use despite being less conventional.
The microbiota of goat feces was mainly composed of the phyla Firmicutes and Bacteroidetes. In all the farms, except the one in Cardedu, an abundance of Firmicutes was noted compared to Bacteroidetes; in the farm in Baunei, the ratio was strongly unbalanced in favor of Firmicutes. In all the farms, there was a lower abundance of Proteobacteria, Actinobacteria, and Verrucomicrobia, except the farm in Cardedu, which has a slightly higher percentage than the others (Figure 2; Table 2).
(A-F) Krona.
The most represented families were as follows: Gracilibacteraceae, Erysipelotrichaceae, Clostridiales Family XI. Incertae Sedis, Christensenellaceae, Acidaminococcaceae, Peptostreptococcaceae, Clostridiaceae, Porphyromonadaceae, Prevotellaceae, Flavobacteriaceae, Eubacteriaceae, Ruminococcaceae, Lachnospiraceae, Rikenellaceae, Synergistaceae, and Bacteroidaceae. The Erysipelotrichaceae family has a higher abundance in the Talana, Urzulei, and Perdasdefogu farms. The Acidaminococcaceae and Porphyromonadaceae families were very abundant in the Cardedu farm. The Peptostreptococcaceae family had a higher abundance in the Talana and Perdasdefogu farms, while Peptostreptococcaceae were present in very low percentages in the Cardedu farm. The Prevotellaceae family had a higher abundance in the Perdasdefogu and Villagrande farms (Table 3).
The most represented genera were Ruminococcus, Eubacterium, Roseburia, and Clostridium. For the genera Ruminococcus, Roseburia, and Clostridium, a greater abundance was noted in the Talana farm and a lower abundance in the Cardedu farm. For the genus Eubacterium, no significant difference was noted in the various farms (Table 4).
The most represented species were Ruminococcus faecis, Ruminococcus gauvreauii, Eubacterium hallii, Roseburia faecis, and Clostridium lavalense. For the species R. faecis, R. gauvreauii, and C. lavalense, there were a greater abundance in the Talana and Perdasdefogu farms and a lower abundance in the Cardedu farm. For the species R. faecis, there was a greater abundance in the Talana farm (Table 5).
Significant differences in the relative abundance of taxa were detected between the samples from Baunei and Talana (P = 0.0005) and Cardedu and Talana (P = 0.04) farms (Figure 3).
Alpha diversity boxplots.
As far as beta diversity is concerned, the Cardedu farm was significantly different from the other sites, with P-values ranging from 0.001 to 0.005; similar results were obtained for the Baunei farm (Figure 4). A multidimensional sorting graph (Figure 5), where each sample is a point and the distance between the points represents the similarity, highlighted a cluster made up of the Cardedu locality. Beta diversity was significantly different between the CAE-positive and CAE-negative samples (P = 0.017) (Figure 6). On the farms in the localities of Perdasdefogu and Villagrande, Prevotellaceae were abundant; Peptostreptococcaceae and Erysipelotrichaceae were abundant in the localities of Perdasdefogu, Talana, Urzulei, and Villagrande. A significant abundance of Acidaminococcaceae on the Cardedu farm compared to that of the other families, a high abundance of Porphyromonadaceae and Flavobacteriaceae, and a decreased presence of Peptostreptococcaceae were detected (Table 3). In the samples from the locality of Talana, there was a prevalence of the Roseburia genus and R. faecis (Tables 4, 5).
Group significance plots.
Beta diversity calculated with the weighted UniFrac metric to determine the distance between samples and PCoA to visualize the data.
Group significance plot between CAE-positive and CAE-negative samples.
Discussion
4
Prevotellaceae was found in the localities of Perdasdefogu and Villagrande (Kim et al., 2014), where 4 out of 29 goats tested positive for CAE. From these data, we deduced that the presence of Prevotellaceae can be an indication of the disease, as highlighted by human clinical literature. The intestinal microbiome can exhibit bacterial hyperproliferation in rheumatoid arthritis (RA), which can be related to the onset or course of the disease. In particular, individuals affected by RA showed a high prevalence of Prevotella and Prevotella spp. The presence of these specific bacteria suggests a potential association between the intestinal microbiota and the development or exacerbation of this disease. Understanding the complex pattern of the relationship between the microbiome and RA could provide useful knowledge for the development of new therapeutic strategies targeting the intestinal flora, thus offering new perspectives for the management and treatment of this disease (Horta-Baas et al., 2017; Attur et al., 2022). Compared to FDR controls [first-degree relatives of RA patients (RA-FDR) have a higher risk of developing RA than the general population], individuals at risk of RA with systemic autoimmunity and/or RA-associated symptoms have an enrichment of Prevotella spp. The findings support the hypothesis of a mucosal origin in the development of RA. Intestinal dysbiosis could act as an early environmental modulator and may be a target of future preventive interventions (Alpizar-Rodriguez et al., 2019). These data may be related to the findings of studies on human individuals at risk of rheumatoid arthritis with systemic autoimmunity and/or symptoms associated with rheumatoid arthritis in which an increase in Prevotella spp. was found (Alpizar-Rodriguez et al., 2019). It could be hypothesized that the same scenario also occurs in goats affected by arthritic diseases, such as those analyzed.
Of interest is also the abundance of the genus Roseburia observed in the samples collected in the locality of Talana, higher than in other localities (Supplementary Material 6). Species belonging to the Roseburia genus are important inhabitants of the intestinal microbiome, and they are capable of fermenting complex polysaccharides into butyrate, a short-chain fatty acid that regulates the transepithelial transport of fluids, improves the oxidative and inflammatory state of the mucosa, influences human physiology, and serves as an energy source for colonocytes (Hillman et al., 2020).
The only intensive farm located in Cardedu was statistically different from the other locations. In fact, out of a total of 8,895 identified species, only 3,310 were shared with other locations (Figures 7, 8). In particular, the presence of Acidoaminococcaceae was significant (Table 3). This difference could be attributed to the farming system, the Cardedu farm being the only intensive one, and to the geographical distance of this location from the other sampling sites (Figure 1).
Venn diagram at a distance of 0.03; the Cardedu samples show a statistically significant difference compared to the other localities.
Dendrogram showing 4 clusters with greater distances between Cardedu and the other locality.
Conclusions
5
There are few studies in the literature regarding the fecal microbiome of goats and no studies with the same environmental and experimental conditions.
Therefore, the results of the present study suggest that extensive or intensive management of the farm can influence the intestinal microbiota of goats. The diversity of the farm of Talana could be attributed to the peculiarities of the rough and stony territory with many mines rich in copper, carbonate, and some veins of silver pyrite.
In the future, it would be interesting to compare the results obtained in the present work with those of other areas of Sardinia. To deepen the comparison between wild and intensive farming systems, further sampling would be necessary considering that in the present work, it was possible to analyze a limited number of samples for intensive farming.
It would also be desirable to monitor the goats from birth until a possible positivity for CAE to investigate the changes in the composition of the intestinal microbiome and the increase of Prevotellaceae to have new perspectives in the management of the disease.
The reference list from the paper itself. Each links out to its DOI / PubMed record.
- 1Alpizar-Rodriguez D.Lesker T. R.Gronow A.Gilbert Benoît Raemy E.Lamacchia C.. (2019). Prevotella covers in individuals at risk for rheumatoid arthritis. Rheumatoid Arthritis 78, 590–593. doi: 10.1136/annrheumdis-2018-214514 30760471 · doi ↗ · pubmed ↗
- 2Anderson M. J. (2001). A new method for nonparametric multivariate analysis of variance. Austral Ecol. doi: 10.1111/j.1442-9993.2001.01070.pp.x · doi ↗
- 3Attur M.Scher J. U.Abramson S. B.Attur M. (2022). Role of intestinal dysbiosis and nutrition in rheumatoid arthritis. Cells 11, 2436. doi: 10.3390/cells 11152436 35954278 PMC 9368368 · doi ↗ · pubmed ↗
- 4Bahrndorff S.Alemu T.Alemneh T.Lund Nielsen J. (2016). The microbiome of animals: implications for conservation biology. Int. J. Genomics. doi: 10.1155/2016/5304028 PMC 485235427195280 · doi ↗ · pubmed ↗
- 5Bartels L.Onland G.Boel chevan den Brule A. J. C. (2003). Isolation of Enterovirus RNA from clinical samples using magnetic silica particles. J. Microbiol. Methods 55, 535. 14.
- 6Bertolo A.Valido E.Stoyanov J. (2024). Optimized bacterial community characterization through full-length 16S r RNA gene sequencing utilizing Min ION nanopore technology. BMC Microbiol. 24, 58. doi: 10.1186/s 12866-024-03208-5 38365589 PMC 10870487 · doi ↗ · pubmed ↗
- 7Chappidi S.Villa C. E.Cantarel B. L. (2019). Using Mothur to determine bacterial community composition and structure in 16S ribosomal RNA datasets. Curr. Bioinform. Protocol. 67, 83. doi: 10.1002/cpbi.83 31524992 · doi ↗ · pubmed ↗
- 8Chaudhari H. G.Prajapati S.Wardah Z. H.Raol G.Prajapati V.Patel R.. (2023). Decoding the microbial universe with metagenomics: a brief insight. Front. Genet. 14. doi: 10.3389/fgene.2023.1119740 PMC 1018375637197021 · doi ↗ · pubmed ↗