Correction: Targeting cell surface GRP78-CD44v interaction suppresses cell migration in triple-negative breast cancer cells
Chun-Chih Tseng, Pu Zhang, Mari B. Ishak Gabra, Mei Kong, Amy S. Lee

Abstract
Genes, proteins, chemicals, diseases, species, mutations and cell lines named across the full text — each resolved to its canonical identifier and authoritative record.
Click any figure to enlarge with its caption.
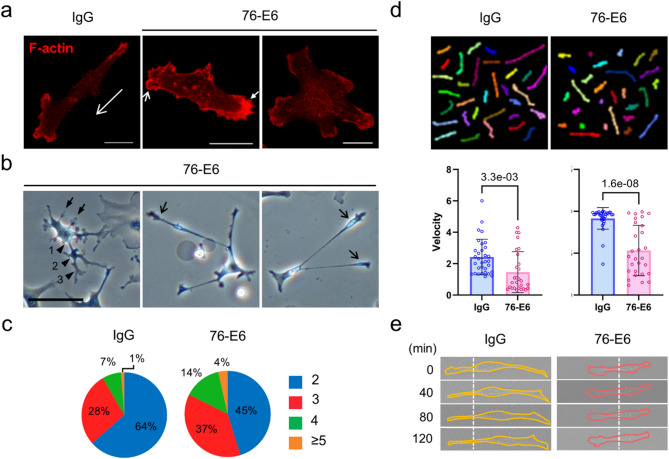 Figure 2
Peer Reviews
No public reviews on file for this paper yet. If you reviewed it on a platform where reviews are public (OpenReview, ICLR, NeurIPS, ICML), you can paste yours below so the community can read it here.
Videos
No videos yet. Explain this paper in a talk, walkthrough, or lecture? Add one.
Taxonomy
TopicsProteoglycans and glycosaminoglycans research · Endoplasmic Reticulum Stress and Disease · Peptidase Inhibition and Analysis
Correction to: Scientific Reports 10.1038/s41598-025-33441-5, published online 21 December 2025
The original version of this Article contained an error in Fig. 2, where the y-axis of the bar graph is partially cropped and not fully legible. The incorrect Figure 2 along with its captions is provided below.Fig. 2MDA-MB-231 cells treated with the anti-GRP78 antibody (76-E6) exhibit an increased number of protrusions and reduced capacity for cell migration. (a) Confocal micrographs showing the F-actin structures of MDA-MB-231 cells treated with 76-E6 antibody or control IgG for 24 h. F-actin was visualized through rhodamine phalloidin staining or transfected mCherry-tagged actin binding peptide. Long open arrow, direction of cell migration. Short open arrows, membrane blebs. Short solid arrow, accumulation of disorganized F-actin. Scale bars, 20 μm. (b) Bright-field micrographs showing the morphology of MDA-MB-231 cells treated with 76-E6 antibody for 49 h. Solid arrows, short cell protrusions. Open arrows, long cell protrusions. Arrowheads, primary (1), secondary (2), and tertiary (3) cell protrusions. Scale bar, 100 μm. (c) The percentage of cells displaying the indicated number of long cell protrusions after treatment with 76-E6 or control IgG for 61 h. Total number of cells analyzed in the study: 2699 (IgG); 942 (76-E6). (d) Upper: Superimposed tracks of control IgG (n = 32) and 76-E6 antibody (n = 28)-treated MDA-MB-231 cells during a 7-h random migration assay. Lower: Comparisons of velocity (displacement/time) and straightness (displacement/total path length) of the cells. The unpaired two-tailed Student’s t-test was used to calculate the p-values; error bars represent the standard deviation (SD). The raw statistical data are provided in Supplementary Information 1. (e) Time-lapse DIC images of MDA-MB-231 cells during a 2-h observation period. Solid lines, cell borders. Dotted lines, positions of the cells. min, minutes.
The original Article has been corrected.